User login
AHA report highlights CVD burden, declines in smoking, sleep importance
Almost half of U.S. adults now have some form of cardiovascular disease, according to the latest annual statistical update from the American Heart Association.
The prevalence is driven in part by the recently changed definition of hypertension, from 140/90 to 130/80 mm Hg, said authors of the American Heart Association Heart Disease and Stroke Statistics–2019 Update.
Cardiovascular disease (CVD) deaths are up, though smoking rates continue to decline, and adults are getting more exercise (Circulation. 2019;139. doi: 10.1161/CIR.0000000000000659).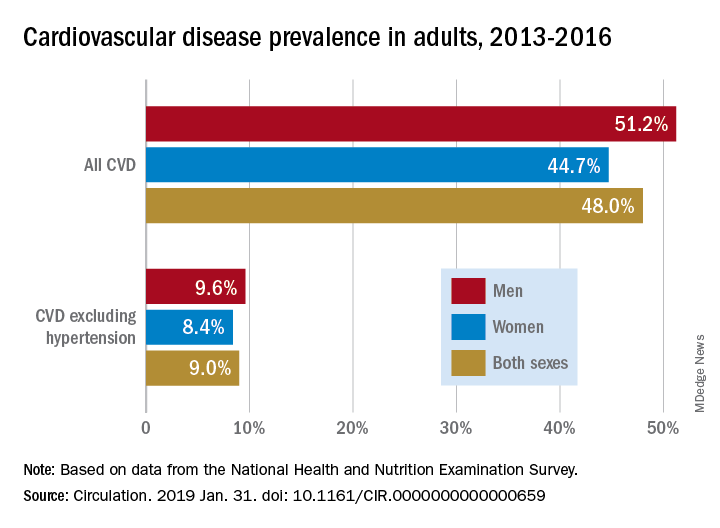
The update includes a new section on sleep and cardiovascular health, an enhanced focus on social determinants of health, and further evidence-based approaches to behavior change, according to the update’s authors, led by chair Emelia J. Benjamin, MD, professor of medicine and epidemiology at Boston University, and vice chair Paul Muntner, PhD, professor of epidemiology at the University of Alabama, Birmingham.
High blood pressure is an “overwhelming presence” that drives heart disease and stroke and can’t be dismissed in the fight against cardiovascular disease, AHA President Ivor J. Benjamin, MD, said in a statement. “Eliminating high blood pressure could have a larger impact on CVD deaths than the elimination of all other risk factors among women, and all except smoking among men.”
Using data from 2013 to 2016, 46% of adults in the United States had hypertension, and in 2016 there were 82,735 deaths attributable primarily to high blood pressure, according to the update.
Total direct costs of hypertension could approach $221 billion by 2035, according to projections in the report.
After decades of decline, U.S. cardiovascular disease deaths increased to 840,678 in 2016, up from 836,546 in 2015, the report says.
Smoking rate declines represent some of the most significant improvements outlined in the report, according to an AHA news release.
Ninety-four percent of adolescents were nonsmokers in the 2015-2016 period, which is up from 76% in 1999-2000, according to the report. The proportion of adult nonsmokers increased to 79% in 2015-2016, up from 73% in 1999-2000.
The new chapter on the importance of sleep cites data from the Centers for Disease Control and Prevention that only 65.2% of Americans have a healthy sleep duration (at least 7 hours), with even lower rates among non-Hispanic blacks, native Hawaiians and Pacific Islanders, and multiracial non-Hispanic individuals.
Short sleep duration is associated with a higher risk of all-cause mortality, total CVD, and coronary heart disease, according to a meta-analysis cited in the report. Long sleep duration, defined as greater than 8 hours, also was associated with higher risk of all-cause mortality, total CVD, coronary heart disease, and stroke.
Members of the statistical update writing group reported disclosures related to the American Heart Association, National Institutes of Health, Amgen, Sanofi, Roche, Abbott, Biogen, Medtronic, and others.
SOURCE: Benjamin EJ et al. Circulation. 2019 Jan 31.
The latest statistics on heart disease and stroke include some metrics that indicate progress, and others that suggest opportunities for improvement.
Tobacco use continues to decline; however, among high school students, e-cigarette use is up to 11.3%, which is concerning.
One bright spot is that the proportion of inactive adults has dropped to 30% in 2016, down from 40% in 2007. Despite that improvement, however, the prevalence of obesity increased significantly over the decade, to the point where nearly 40% of adults are obese and 7.7% are severely obese.

Although 48% of U.S. adults now have cardiovascular disease, according to this latest update, the number drops to just 9% when hypertension is excluded. Even so, 9% represents more than 24.3 million Americans who have coronary artery disease, stroke, or heart failure.
The cost of cardiovascular disease is astronomical, exceeding $351 billion in 2014-1205, with costs projected to increase sharply for older adults over the next few decades.
Starting in 2020, the AHA will begin charting progress in CVD using a metric called health-adjusted life expectancy (HALE), which relies on morbidity and mortality patterns to reflect the number of years a person can expect to live. Patients and the general public may find this metric more understandable than statistics about death rates and cardiovascular risk factors.
Mariell Jessup, MD, is chief science and medical officer for the American Heart Association. Her view on the latest statistical update was derived from a commentary that accompanied the update.
The latest statistics on heart disease and stroke include some metrics that indicate progress, and others that suggest opportunities for improvement.
Tobacco use continues to decline; however, among high school students, e-cigarette use is up to 11.3%, which is concerning.
One bright spot is that the proportion of inactive adults has dropped to 30% in 2016, down from 40% in 2007. Despite that improvement, however, the prevalence of obesity increased significantly over the decade, to the point where nearly 40% of adults are obese and 7.7% are severely obese.
Although 48% of U.S. adults now have cardiovascular disease, according to this latest update, the number drops to just 9% when hypertension is excluded. Even so, 9% represents more than 24.3 million Americans who have coronary artery disease, stroke, or heart failure.
The cost of cardiovascular disease is astronomical, exceeding $351 billion in 2014-1205, with costs projected to increase sharply for older adults over the next few decades.
Starting in 2020, the AHA will begin charting progress in CVD using a metric called health-adjusted life expectancy (HALE), which relies on morbidity and mortality patterns to reflect the number of years a person can expect to live. Patients and the general public may find this metric more understandable than statistics about death rates and cardiovascular risk factors.
Mariell Jessup, MD, is chief science and medical officer for the American Heart Association. Her view on the latest statistical update was derived from a commentary that accompanied the update.
Almost half of U.S. adults now have some form of cardiovascular disease, according to the latest annual statistical update from the American Heart Association.
The prevalence is driven in part by the recently changed definition of hypertension, from 140/90 to 130/80 mm Hg, said authors of the American Heart Association Heart Disease and Stroke Statistics–2019 Update.
Cardiovascular disease (CVD) deaths are up, though smoking rates continue to decline, and adults are getting more exercise (Circulation. 2019;139. doi: 10.1161/CIR.0000000000000659).
The update includes a new section on sleep and cardiovascular health, an enhanced focus on social determinants of health, and further evidence-based approaches to behavior change, according to the update’s authors, led by chair Emelia J. Benjamin, MD, professor of medicine and epidemiology at Boston University, and vice chair Paul Muntner, PhD, professor of epidemiology at the University of Alabama, Birmingham.
High blood pressure is an “overwhelming presence” that drives heart disease and stroke and can’t be dismissed in the fight against cardiovascular disease, AHA President Ivor J. Benjamin, MD, said in a statement. “Eliminating high blood pressure could have a larger impact on CVD deaths than the elimination of all other risk factors among women, and all except smoking among men.”
Using data from 2013 to 2016, 46% of adults in the United States had hypertension, and in 2016 there were 82,735 deaths attributable primarily to high blood pressure, according to the update.
Total direct costs of hypertension could approach $221 billion by 2035, according to projections in the report.
After decades of decline, U.S. cardiovascular disease deaths increased to 840,678 in 2016, up from 836,546 in 2015, the report says.
Smoking rate declines represent some of the most significant improvements outlined in the report, according to an AHA news release.
Ninety-four percent of adolescents were nonsmokers in the 2015-2016 period, which is up from 76% in 1999-2000, according to the report. The proportion of adult nonsmokers increased to 79% in 2015-2016, up from 73% in 1999-2000.
The new chapter on the importance of sleep cites data from the Centers for Disease Control and Prevention that only 65.2% of Americans have a healthy sleep duration (at least 7 hours), with even lower rates among non-Hispanic blacks, native Hawaiians and Pacific Islanders, and multiracial non-Hispanic individuals.
Short sleep duration is associated with a higher risk of all-cause mortality, total CVD, and coronary heart disease, according to a meta-analysis cited in the report. Long sleep duration, defined as greater than 8 hours, also was associated with higher risk of all-cause mortality, total CVD, coronary heart disease, and stroke.
Members of the statistical update writing group reported disclosures related to the American Heart Association, National Institutes of Health, Amgen, Sanofi, Roche, Abbott, Biogen, Medtronic, and others.
SOURCE: Benjamin EJ et al. Circulation. 2019 Jan 31.
FROM CIRCULATION
Flu activity ticks up for second week in a row
Influenza activity increased for a second straight week after a 2-week drop and by one measure has topped the high reached in late December, according to the Centers for Disease Control and Prevention.
For the week ending Jan. 26, 2019, there were 16 states at level 10 on the CDC’s 1-10 scale of influenza-like illness (ILI) activity, compared with 12 states during the week ending Dec. 29. With another seven states at levels 8 and 9, that makes 23 in the high range for the week ending Jan. 26, again putting it above the 19 reported for Dec. 29, the CDC’s influenza division reported Feb. 1.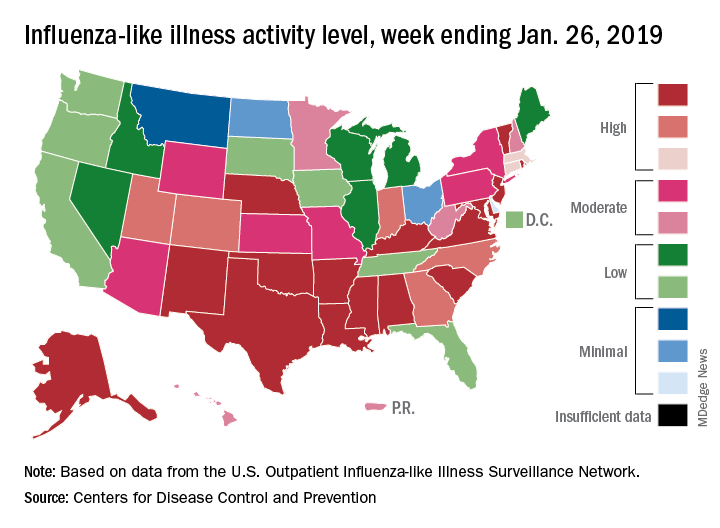
By another measure, however, that December peak in activity remains the seasonal high. The proportion of outpatient visits for ILI that week was 4.0%, compared with the 3.8% reported for Jan. 26. That’s up from 3.3% the week before and 3.1% the week before that, which in turn was the second week of a 2-week decline in activity in early January, CDC data show.
Two flu-related pediatric deaths were reported during the week ending Jan. 26, but both occurred the previous week. For the 2018-2019 flu season so far, a total of 24 pediatric flu deaths have been reported, the CDC said. At the same point in the 2017-2018 flu season, there had been 84 such deaths, according to the CDC’s Influenza-Associated Pediatric Mortality Surveillance System.
There were 143 overall flu-related deaths during the week of Jan. 19, which is the most recent week available. That is down from 189 the week before, but the Jan. 19 reporting is only 75% complete, data from the National Center for Health Statistics show.
Lifetime cost of tobacco use tops $1.9 million per smoker
according to the personal financial website WalletHub.
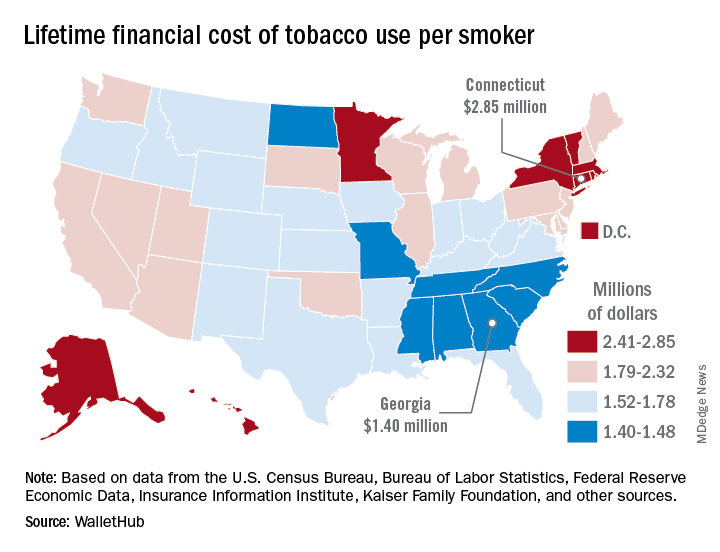
Economic and societal losses related to 37.8 million U.S. tobacco users – including out-of-pocket spending for cigarettes, health care expenses, and lost income – top $300 billion annually, but those costs vary considerably by state, WalletHub said in a recent report.
The state with the highest lifetime cost per smoker is Connecticut, with an estimated total of $2.85 million. That works out to just under $56,000 a year for 51 years because lifetime use was defined as one pack a day starting at age 18 years and continuing until age 69 years. New York has the second-highest lifetime cost, which also rounds off to $2.85 million, followed by the District of Columbia ($2.81 million), Massachusetts ($2.76 million), and Rhode Island ($2.68 million), WalletHub said.
Georgia has the lowest lifetime cost of any state – $1.40 million per smoker – followed by Missouri at $1.41 million, North Carolina at $1.42 million, Mississippi at $1.43 million, and South Carolina at $1.44 million, according to the report.
WalletHub’s formula for total lifetime cost has five components: out-of-pocket cost (one pack of cigarettes per day for 51 years), financial opportunity cost (defined as “the amount of return a person would have earned by instead investing that money in the stock market”), health care cost (spending on treatment for smoking-related health complications), income loss (an average 8% decrease caused by absenteeism and lost productivity), and other costs (loss of a homeowner’s insurance credit and costs of secondhand exposure).
The analysis was based on data from the U.S. Census Bureau, Bureau of Labor Statistics, Centers for Disease Control and Prevention, Insurance Information Institute, Campaign for Tobacco-Free Kids, NYsmokefree.com, Federal Reserve Economic Data, Kaiser Family Foundation, and the Independent Insurance Agents & Brokers of America.
according to the personal financial website WalletHub.
Economic and societal losses related to 37.8 million U.S. tobacco users – including out-of-pocket spending for cigarettes, health care expenses, and lost income – top $300 billion annually, but those costs vary considerably by state, WalletHub said in a recent report.
The state with the highest lifetime cost per smoker is Connecticut, with an estimated total of $2.85 million. That works out to just under $56,000 a year for 51 years because lifetime use was defined as one pack a day starting at age 18 years and continuing until age 69 years. New York has the second-highest lifetime cost, which also rounds off to $2.85 million, followed by the District of Columbia ($2.81 million), Massachusetts ($2.76 million), and Rhode Island ($2.68 million), WalletHub said.
Georgia has the lowest lifetime cost of any state – $1.40 million per smoker – followed by Missouri at $1.41 million, North Carolina at $1.42 million, Mississippi at $1.43 million, and South Carolina at $1.44 million, according to the report.
WalletHub’s formula for total lifetime cost has five components: out-of-pocket cost (one pack of cigarettes per day for 51 years), financial opportunity cost (defined as “the amount of return a person would have earned by instead investing that money in the stock market”), health care cost (spending on treatment for smoking-related health complications), income loss (an average 8% decrease caused by absenteeism and lost productivity), and other costs (loss of a homeowner’s insurance credit and costs of secondhand exposure).
The analysis was based on data from the U.S. Census Bureau, Bureau of Labor Statistics, Centers for Disease Control and Prevention, Insurance Information Institute, Campaign for Tobacco-Free Kids, NYsmokefree.com, Federal Reserve Economic Data, Kaiser Family Foundation, and the Independent Insurance Agents & Brokers of America.
Pulmonary hypertension linked to complications after head and neck procedures
SAN DIEGO – Patients with , compared with their counterparts who do not have the condition. They also face an increase in total charges and length of stay.
The findings come from what is believed to be the first study of its kind to investigate the impact of pulmonary hypertension (PHTN) on major head and neck procedures. “PHTN is a common condition which affects the caliber of lung vasculature, with varied symptom presentation from shortness of breath to syncope, with an estimated prevalence of 2.5 to 7.1 million new cases each year worldwide,” one of the study authors, Nirali M. Patel, said at the Triological Society’s Combined Sections Meeting. “Due to improved therapeutic options, there is an enhanced survival of PHTN patients and higher prevalence of this disease. PHTN has some significant systemic implications. Therefore, cardiopulmonary clearance and a clear understanding of postoperative complications are very important.”
Previous studies have shown PHTN to be an independent predictor of morbidity and mortality in noncardiac procedures, said Ms. Patel, a fourth-year medical student at New Jersey Medical School, Newark. Furthermore, the rate of pulmonary complications is reported to be between 11% and 44.8% following radical head and neck cancer resection. “Despite these findings, there is currently a lack of information regarding perioperative morbidity and mortality of patients with PHTN undergoing major head and neck procedures,” she said.
The researchers queried the National Inpatient Survey from 2002 to 2013 for all cases of major head and neck surgery based on the ICD-9 codes for esophagectomy, glossectomy, laryngectomy, mandibulectomy, and pharyngectomy. They divided patients into two groups: those who had PHTN and those who did not, and performed demographic analyses as well as univariate and multivariate regression analyses.
Ms. Patel reported findings from a cohort of 46,311 patients. Of these, 46,073 had PHTN and 238 did not. The two groups were similar in age (a mean of 69 vs. 60 years in those with and without PHTN, respectively) and race (80% white vs. 79% white, respectively), but there were significantly fewer male patients in the PHTN group (57% vs. 70%; P less than .0001).
Several patient comorbidities were increased in the PHTN group, compared with the non-PHTN group, including coagulopathy (8.4% vs. 3.1%; P less than .0001), chronic heart failure (22.4% vs. 4.1%; P less than .0001), complicated diabetes (4.6% vs. 1.2%; P less than .0001), fluid and electrolyte disorders (30% vs. 18.3%; P less than .0001), and hypertension (63.3% vs. 43.7%; P less than .0001).
Postoperatively, patients with PHTN had a longer length of stay (a mean of 15.80 vs. 11.50 days, respectively; P less than .0001) as well as significantly higher total charges (a mean of $162,021.06 vs. $107,309.46, respectively; P less than .0001). When the researchers evaluated postoperative outcomes between the two cohorts, patients with PHTN had significantly higher rates of cardiac complications (9.2% vs. 3.5%; P less than .0001), iatrogenic pulmonary embolism (2.1% vs. 0.3%; P = .001), pulmonary edema (2.1% vs. 0.4%; P = .003), venous thrombotic events (4.6% vs. 1%; P less than. 0001), pulmonary insufficiency (17.2% vs. 9.7%; P less than .0001), and pneumonia (9.7% vs. 6%; P = .027), as well as higher rates of postoperative tracheostomy (8.4% vs. 4.5%; P = .007).
Multivariate analysis revealed that the following factors predicted in-hospital mortality: coagulopathy, chronic heart failure, fluid and electrolyte disorders, hyperlipidemia, hypertension, hypothyroidism, liver disease, obesity, paralysis, and renal failure. Despite these findings, there was no significant change in overall hospital mortality for those with PHTN, with an odds ratio of 1.055.
“Our study is not without its limitations, many of which are inherent to the use of a database, which is subject to errors in coding and sampling,” Ms. Patel noted at the meeting, which was jointly sponsored by the Triological Society and the American College of Surgeons. “Despite these limitations, the study provides valuable information on the impact of PHTN on major head and neck procedures.
She reported having no financial disclosures.
SOURCE: Patel N et al. Triological CSM, Abstracts.
REPORTING FROM THE TRIOLOGICAL CSM
Key clinical point: Pulmonary hypertension (PHTN) is linked with certain head and neck surgical complications.
Major finding: For patients undergoing head and neck surgery, PHTN is associated with an increased risk of cardiac complications (9.2% vs. 3.5%) and iatrogenic pulmonary embolism (2.1% vs. 0.3%).
Study details: A retrospective analysis of 46,311 patient records from the National Inpatient Survey.
Disclosures: The researchers reported having no financial disclosures.
Source: Patel N et al. Triological CSM, Abstracts.
Managing malignant pleural effusion
Managing patients with malignant pleural effusion can be challenging. Symptoms are often distressing, and its presence signifies advanced disease. Median survival after diagnosis is 4 to 9 months,1–3 although prognosis varies considerably depending on the type and stage of the malignancy.
How patients are best managed depends on clinical circumstances. Physicians should consider the risks and benefits of each option while keeping in mind realistic goals of care.
This article uses brief case presentations to review management strategies for malignant pleural effusion.
CANCER IS A COMMON CAUSE OF PLEURAL EFFUSION
Physicians and surgeons, especially in tertiary care hospitals, must often manage malignant pleural effusion.4 Malignancy is the third leading cause of pleural effusion after heart failure and pneumonia, accounting for 44% to 77% of exudates.5 Although pleural effusion can arise secondary to many different malignancies, the most common causes are lung cancer in men and breast cancer in women; these cancers account for about 75% of all cases of malignant pleural effusion.6,7
A WOMAN ON CHEMOTHERAPY WITH ASYMPTOMATIC PLEURAL EFFUSION
An 18-year-old woman with non-Hodgkin lymphoma has received her first cycle of chemotherapy and is now admitted to the hospital for diarrhea. A routine chest radiograph reveals a left-sided pleural effusion covering one-third of the thoracic cavity. She is asymptomatic and reports no shortness of breath at rest or with exertion. Her oxygen saturation level is above 92% on room air without supplemental oxygen.
Thoracentesis reveals an exudative effusion, and cytologic study shows malignant lymphoid cells, consistent with a malignant pleural effusion. Cultures are negative.
What is the appropriate next step to manage this patient’s effusion?
Observation is reasonable
This patient is experiencing no symptoms and has just begun chemotherapy for her lymphoma. Malignant pleural effusion associated with lymphoma, small-cell lung cancer, and breast cancer is most sensitive to chemotherapy.5 For patients who do not have symptoms from the pleural effusion and who are scheduled to receive further chemotherapy, a watch-and-wait approach is reasonable.
It is important to follow the patient for developing symptoms and obtain serial imaging to evaluate for an increase in the effusion size. We recommend repeat imaging at 2- to 4-week intervals, and sooner if symptoms develop.
If progression is evident or if the patient’s oncologist indicates that the cancer is unresponsive to systemic therapy, further intervention may be necessary with one of the options discussed below.
A MAN WITH LUNG CANCER WITH PLEURAL EFFUSION, LUNG COLLAPSE
 and collapsed lung (blue ar-row), along with midline shift.")
A 42-year-old man with a history of lung cancer is admitted for worsening shortness of breath. Chest radiography reveals a large left-sided pleural effusion with complete collapse of the left lung and contralateral shift of midline structures (Figure 1). Large-volume thoracentesis improves his symptoms. Pleural fluid cytology is positive for malignant cells. A repeat chest radiograph shows incomplete expansion of the left lung, thick pleura, and pneumothorax, indicating a trapped lung (ie, one unable to expand fully). Two weeks later, his symptoms recur, and chest radiography reveals a recurrent effusion.
How should this effusion be managed?
Indwelling pleural catheter placement
In a retrospective cohort study,8 malignant pleural effusion recurred in 97% of patients within 1 month (mean, 4.2 days) of therapeutic aspiration, highlighting the need for definitive treatment.
In the absence of lung expansion, pleurodesis is rarely successful, and placing an indwelling pleural catheter in symptomatic patients is the preferred strategy. The US Food and Drug Administration approved this use in 1997.9
Indwelling pleural catheters are narrow (15.5 French, or about 5 mm in diameter) and soft (made of silicone), with distal fenestrations. The distal end remains positioned in the pleural cavity to enable drainage of pleural fluid. The middle portion passes through subcutaneous tissue, where a polyester cuff prevents dislodgement and infection. The proximal end of the catheter remains outside the patient’s skin and is connected to a 1-way valve that prevents air or fluid flow into the pleural cavity.
Pleural fluid is typically drained every 2 or 3 days for palliation. Patients must be educated about home drainage and proper catheter care.
Indwelling pleural catheters are now initial therapy for many
Although indwelling pleural catheters were first used for patients who were not candidates for pleurodesis, they are now increasingly used as first-line therapy.
Since these devices were introduced, several clinical series including more than 800 patients have found that their use for malignant pleural infusion led to symptomatic improvement in 89% to 100% of cases, with 90% of patients needing no subsequent pleural procedures after catheter insertion.10–13
Davies et al14 randomized 106 patients with malignant pleural effusion to either receive an indwelling pleural catheter or undergo pleurodesis. In the first 6 weeks, the 2 groups had about the same incidence of dyspnea, but the catheter group had less dyspnea at 6 months, shorter index hospitalization (0 vs 4 days), fewer hospital days in the first year for treatment-related complications (1 vs 4.5 days), and fewer patients needing follow-up pleural procedures (6% vs 22%). On the other hand, adverse events were more frequent in the indwelling pleural catheter group (40% vs 13%). The most frequent events were pleural infection, cellulitis, and catheter blockage.
Fysh et al15 also compared indwelling pleural catheter insertion and pleurodesis (based on patient choice) in patients with malignant pleural effusion. As in the previous trial, those who received a catheter required significantly fewer days in the hospital and fewer additional pleural procedures than those who received pleurodesis. Safety profiles and symptom control were comparable.
Indwelling pleural catheters have several other advantages. They have been found to be more cost-effective than talc pleurodesis in patients not expected to live long (survival < 14 weeks).16 Patients with an indwelling pleural catheter can receive chemotherapy, and concurrent treatment does not increase risk of infection.17 And a systematic review18 found a 46% rate of autopleurodesis at a median of 52 days after insertion of an indwelling pleural catheter.
Drainage rate may need to be moderated
Chest pain has been reported with the use of indwelling pleural catheters, related to rapid drainage of the effusion in the setting of failed reexpansion of the trapped lung due to thickened pleura. Drainage schedules may need to be adjusted, with more frequent draining of smaller volumes, to control dyspnea without causing significant pain.
A WOMAN WITH RECURRENT PLEURAL EFFUSION, GOOD PROGNOSIS
A 55-year-old woman with a history of breast cancer presents with shortness of breath. Chest radiography reveals a right-sided effusion, which on thoracentesis is found to be malignant. After fluid removal, repeat chest radiography shows complete lung expansion.
One month later, she returns with symptoms and recurrence of the effusion. Ultrasonography does not reveal any adhesions in the pleural space. Her oncologist informs you that her expected survival is in years.
What is the next step?
Chemical pleurodesis
Chemical pleurodesis involves introducing a sclerosant into the pleural space to provoke an intense inflammatory response, creating adhesions and fibrosis that will obliterate the space. The sclerosing agent (typically talc) can be delivered by tube thoracostomy, video-assisted thoracic surgery (VATS), or medical pleuroscopy. Although the latter 2 methods allow direct visualization of the pleural space and, in theory, a more even distribution of the sclerosing agent, current evidence does not favor 1 option over the other,19 and practice patterns vary between institutions.
Tube thoracostomy. Typically, the sclerosing agent is administered once a chest radiograph shows lung reexpansion, and tube output of pleural fluid is less than 150 mL/day.19 However, some studies indicate that if pleural apposition can be confirmed using ultrasonography, then sclerosant administration at that time leads to optimal pleurodesis efficacy and shorter hospitalization.20,21
VATS is usually done in the operating room with the patient under general anesthesia. A double-lumen endotracheal tube allows for single-lung ventilation; a camera is then inserted into the pleural space of the collapsed lung. Multiple ports of entry are usually employed, and the entire pleural space can be visualized and the sclerosing agent instilled uniformly. The surgeon may alternatively choose to perform mechanical pleurodesis, which entails abrading the visceral and parietal pleura with dry gauze to provoke diffuse petechial hemorrhage and an inflammatory reaction. VATS can also be used to perform biopsy, lobectomy, and pneumonectomy.
Medical pleuroscopy. Medical pleuroscopy is usually done using local anesthesia with the patient awake, moderately sedated, and not intubated. Because no double-lumen endotracheal tube is used, lung collapse may not be complete, making it difficult to completely visualize the entire pleural surfaces.
Although no randomized study of VATS vs medical pleuroscopy exists, a retrospective case-matched study22 comparing VATS (under general anesthesia) to single-port VATS (under local anesthesia) noted equivalent rates of pleurodesis. However, the local anesthesia group had a lower perioperative mortality rate (0% vs 2.3%), a lower postoperative major morbidity rate (5.2% vs 9%), earlier improvement in quality of life, and shorter hospitalization (3 vs 5 days).22 In general, the diagnostic sensitivity of pleuroscopy for pleural malignancy is similar to that of VATS (93% vs 97%).23,24
A MAN WITH PLEURAL EFFUSION AND A POOR PROGNOSIS
A 60-year-old man with metastatic pancreatic cancer is brought to the clinic for worsening shortness of breath over the past 2 months. During that time, he has lost 6 kg and has become bedridden.
On examination, he has severe cachexia and is significantly short of breath at rest with associated hypoxia. His oncologist expects him to survive less than 3 months.
His laboratory investigations reveal hypoalbuminemia and leukocytosis. A chest radiograph shows a large left-sided pleural effusion that was not present 2 months ago.
What should be done for him?
Thoracentesis, repeat as needed
Malignant pleural effusion causing dyspnea is not uncommon in certain advanced malignancies and may contribute to significant suffering at the end of life. A study of 298 patients with malignant pleural effusion noted that the presence of leukocytosis, hypoalbuminemia, and hypoxemia was associated with a poorer prognosis. Patients having all 3 factors had a median survival of 42 days.25
Thoracentesis, the least invasive option that may improve dyspnea, can be done in the clinic setting and is a reasonable strategy for patients with advanced cancer and an expected survival of less than 3 months.26 Although recurrence is expected, it may take up to a few weeks, and repeat thoracentesis can be performed as needed.
- Roberts ME, Neville E, Berrisford RG, Antunes G, Ali NJ; BTS Pleural Disease Guideline Group. Management of a malignant pleural effusion: British Thoracic Society pleural disease guideline 2010. Thorax 2010; 65(suppl 2):ii32–ii40. doi:10.1136/thx.2010.136994
- Ruckdeschel JC. Management of malignant pleural effusions. Semin Oncol 1995; 22(2 suppl 3):58–63. pmid:7740322
- Bielsa S, Martín-Juan J, Porcel JM, Rodríguez-Panadero F. Diagnostic and prognostic implications of pleural adhesions in malignant effusions. J Thorac Oncol 2008; 3(11):1251–1256. doi:10.1097/JTO.0b013e318189f53d
- 35th Annual meeting of the European Association for the Study of Diabetes. Brussels, Belgium, 28 September–2 October, 1999. Abstracts. Diabetologia 1999;42(suppl 1):A1–A354. pmid:10505080
- Antony VB, Loddenkemper R, Astoul P, et al. Management of malignant pleural effusions. Eur Respir J 2001; 18(2):402–419. pmid:11529302
- Sahn SA. Malignancy metastatic to the pleura. Clin Chest Med 1998; 19(2):351–361. pmid:9646986
- Sahn SA. Pleural diseases related to metastatic malignancies. Eur Respir J 1997; 10(8):1907–1913. pmid:9272937
- Anderson CB, Philpott GW, Ferguson TB. The treatment of malignant pleural effusions. Cancer 1974; 33(4):916–922. pmid:4362107
- Uzbeck MH, Almeida FA, Sarkiss MG, et al. Management of malignant pleural effusions. Adv Ther 2010; 27(6):334–347. doi:10.1007/S12325-010-0031-8
- Suzuki K, Servais EL, Rizk NP, et al. Palliation and pleurodesis in malignant pleural effusion: the role for tunneled pleural catheters. J Thorac Oncol 2011; 6(4):762–767. doi:10.1097/JTO.0b013e31820d614f
- Tremblay A, Michaud G. Single-center experience with 250 tunnelled pleural catheter insertions for malignant pleural effusion. Chest 2006; 129(2):362–368. doi:10.1378/chest.129.2.362
- Warren WH, Kalimi R, Khodadadian LM, Kim AW. Management of malignant pleural effusions using the Pleur(x) catheter. Ann Thorac Surg 2008; 85(3):1049–1055 doi:10.1016/j.athoracsur.2007.11.039
- Murthy SC, Okereke I, Mason DP, Rice TW. A simple solution for complicated pleural effusions. J Thorac Oncol 2006; 1(7):697–700. pmid:17409939
- Davies HE, Mishra EK, Kahan BC, et al. Effect of an indwelling pleural catheter vs chest tube and talc pleurodesis for relieving dyspnea in patients with malignant pleural effusion: the TIME2 randomized controlled trial. JAMA 2012; 307(22):2383–2389. doi:10.1001/jama.2012.5535
- Fysh ETH, Waterer GW, Kendall PA, et al. Indwelling pleural catheters reduce inpatient days over pleurodesis for malignant pleural effusion. Chest 2012; 142(2):394–400. doi:10.1378/chest.11-2657
- Olfert JA, Penz ED, Manns BJ, et al. Cost-effectiveness of indwelling pleural catheter compared with talc in malignant pleural effusion. Respirology 2017; 22(4):764–770. doi:10.1111/resp.12962
- Morel A, Mishra E, Medley L, et al. Chemotherapy should not be withheld from patients with an indwelling pleural catheter for malignant pleural effusion. Thorax 2011; 66(5):448–449. doi:10.1136/thx.2009.133504
- Van Meter MEM, McKee KY, Kohlwes RJ. Efficacy and safety of tunneled pleural catheters in adults with malignant pleural effusions: a systematic review. J Gen Intern Med 2011; 26(1):70–76. doi:10.1007/s11606-010-1472-0
- Lee YCG, Baumann MH, Maskell NA, et al. Pleurodesis practice for malignant pleural effusions in five English-speaking countries. Chest 2003; 124(6):2229–2238. pmid:14665505
- Villanueva AG, Gray AW Jr, Shahian DM, Williamson WA, Beamis JF Jr. Efficacy of short term versus long term tube thoracostomy drainage before tetracycline pleurodesis in the treatment of malignant pleural effusions. Thorax 1994; 49(1):23–25. pmid:7512285
- Sartori S, Tombesi P, Tassinari D, et al. Sonographically guided small-bore chest tubes and sonographic monitoring for rapid sclerotherapy of recurrent malignant pleural effusions. J Ultrasound Med 2004; 23(9):1171–1176. pmid:15328431
- Mineo TC, Sellitri F, Tacconi F, Ambrogi V. Quality of life and outcomes after nonintubated versus intubated video-thoracoscopic pleurodesis for malignant pleural effusion: comparison by a case-matched study. J Palliat Med 2014; 17(7):761–768. doi:10.1089/jpm.2013.0617
- Michaud G, Berkowitz DM, Ernst A. Pleuroscopy for diagnosis and therapy for pleural effusions. Chest 2010; 138(5):1242–1246. doi:10.1378/chest.10-1259
- Bhatnagar R, Maskell NA. Medical pleuroscopy. Clin Chest Med 2013; 34(3):487–500. doi:10.1016/j.ccm.2013.04.001
- Pilling JE, Dusmet ME, Ladas G, Goldstraw P. Prognostic factors for survival after surgical palliation of malignant pleural effusion. J Thorac Oncol 2010; 5(10):1544–1550. doi:10.1097/JTO.0b013e3181e95cb8
- Beyea A, Winzelberg G, Stafford RE. To drain or not to drain: an evidence-based approach to palliative procedures for the management of malignant pleural effusions. J Pain Symptom Manage 2012; 44(2):301–306. doi:10.1016/j.jpainsymman.2012.05.002
Managing patients with malignant pleural effusion can be challenging. Symptoms are often distressing, and its presence signifies advanced disease. Median survival after diagnosis is 4 to 9 months,1–3 although prognosis varies considerably depending on the type and stage of the malignancy.
How patients are best managed depends on clinical circumstances. Physicians should consider the risks and benefits of each option while keeping in mind realistic goals of care.
This article uses brief case presentations to review management strategies for malignant pleural effusion.
CANCER IS A COMMON CAUSE OF PLEURAL EFFUSION
Physicians and surgeons, especially in tertiary care hospitals, must often manage malignant pleural effusion.4 Malignancy is the third leading cause of pleural effusion after heart failure and pneumonia, accounting for 44% to 77% of exudates.5 Although pleural effusion can arise secondary to many different malignancies, the most common causes are lung cancer in men and breast cancer in women; these cancers account for about 75% of all cases of malignant pleural effusion.6,7
A WOMAN ON CHEMOTHERAPY WITH ASYMPTOMATIC PLEURAL EFFUSION
An 18-year-old woman with non-Hodgkin lymphoma has received her first cycle of chemotherapy and is now admitted to the hospital for diarrhea. A routine chest radiograph reveals a left-sided pleural effusion covering one-third of the thoracic cavity. She is asymptomatic and reports no shortness of breath at rest or with exertion. Her oxygen saturation level is above 92% on room air without supplemental oxygen.
Thoracentesis reveals an exudative effusion, and cytologic study shows malignant lymphoid cells, consistent with a malignant pleural effusion. Cultures are negative.
What is the appropriate next step to manage this patient’s effusion?
Observation is reasonable
This patient is experiencing no symptoms and has just begun chemotherapy for her lymphoma. Malignant pleural effusion associated with lymphoma, small-cell lung cancer, and breast cancer is most sensitive to chemotherapy.5 For patients who do not have symptoms from the pleural effusion and who are scheduled to receive further chemotherapy, a watch-and-wait approach is reasonable.
It is important to follow the patient for developing symptoms and obtain serial imaging to evaluate for an increase in the effusion size. We recommend repeat imaging at 2- to 4-week intervals, and sooner if symptoms develop.
If progression is evident or if the patient’s oncologist indicates that the cancer is unresponsive to systemic therapy, further intervention may be necessary with one of the options discussed below.
A MAN WITH LUNG CANCER WITH PLEURAL EFFUSION, LUNG COLLAPSE
A 42-year-old man with a history of lung cancer is admitted for worsening shortness of breath. Chest radiography reveals a large left-sided pleural effusion with complete collapse of the left lung and contralateral shift of midline structures (Figure 1). Large-volume thoracentesis improves his symptoms. Pleural fluid cytology is positive for malignant cells. A repeat chest radiograph shows incomplete expansion of the left lung, thick pleura, and pneumothorax, indicating a trapped lung (ie, one unable to expand fully). Two weeks later, his symptoms recur, and chest radiography reveals a recurrent effusion.
How should this effusion be managed?
Indwelling pleural catheter placement
In a retrospective cohort study,8 malignant pleural effusion recurred in 97% of patients within 1 month (mean, 4.2 days) of therapeutic aspiration, highlighting the need for definitive treatment.
In the absence of lung expansion, pleurodesis is rarely successful, and placing an indwelling pleural catheter in symptomatic patients is the preferred strategy. The US Food and Drug Administration approved this use in 1997.9
Indwelling pleural catheters are narrow (15.5 French, or about 5 mm in diameter) and soft (made of silicone), with distal fenestrations. The distal end remains positioned in the pleural cavity to enable drainage of pleural fluid. The middle portion passes through subcutaneous tissue, where a polyester cuff prevents dislodgement and infection. The proximal end of the catheter remains outside the patient’s skin and is connected to a 1-way valve that prevents air or fluid flow into the pleural cavity.
Pleural fluid is typically drained every 2 or 3 days for palliation. Patients must be educated about home drainage and proper catheter care.
Indwelling pleural catheters are now initial therapy for many
Although indwelling pleural catheters were first used for patients who were not candidates for pleurodesis, they are now increasingly used as first-line therapy.
Since these devices were introduced, several clinical series including more than 800 patients have found that their use for malignant pleural infusion led to symptomatic improvement in 89% to 100% of cases, with 90% of patients needing no subsequent pleural procedures after catheter insertion.10–13
Davies et al14 randomized 106 patients with malignant pleural effusion to either receive an indwelling pleural catheter or undergo pleurodesis. In the first 6 weeks, the 2 groups had about the same incidence of dyspnea, but the catheter group had less dyspnea at 6 months, shorter index hospitalization (0 vs 4 days), fewer hospital days in the first year for treatment-related complications (1 vs 4.5 days), and fewer patients needing follow-up pleural procedures (6% vs 22%). On the other hand, adverse events were more frequent in the indwelling pleural catheter group (40% vs 13%). The most frequent events were pleural infection, cellulitis, and catheter blockage.
Fysh et al15 also compared indwelling pleural catheter insertion and pleurodesis (based on patient choice) in patients with malignant pleural effusion. As in the previous trial, those who received a catheter required significantly fewer days in the hospital and fewer additional pleural procedures than those who received pleurodesis. Safety profiles and symptom control were comparable.
Indwelling pleural catheters have several other advantages. They have been found to be more cost-effective than talc pleurodesis in patients not expected to live long (survival < 14 weeks).16 Patients with an indwelling pleural catheter can receive chemotherapy, and concurrent treatment does not increase risk of infection.17 And a systematic review18 found a 46% rate of autopleurodesis at a median of 52 days after insertion of an indwelling pleural catheter.
Drainage rate may need to be moderated
Chest pain has been reported with the use of indwelling pleural catheters, related to rapid drainage of the effusion in the setting of failed reexpansion of the trapped lung due to thickened pleura. Drainage schedules may need to be adjusted, with more frequent draining of smaller volumes, to control dyspnea without causing significant pain.
A WOMAN WITH RECURRENT PLEURAL EFFUSION, GOOD PROGNOSIS
A 55-year-old woman with a history of breast cancer presents with shortness of breath. Chest radiography reveals a right-sided effusion, which on thoracentesis is found to be malignant. After fluid removal, repeat chest radiography shows complete lung expansion.
One month later, she returns with symptoms and recurrence of the effusion. Ultrasonography does not reveal any adhesions in the pleural space. Her oncologist informs you that her expected survival is in years.
What is the next step?
Chemical pleurodesis
Chemical pleurodesis involves introducing a sclerosant into the pleural space to provoke an intense inflammatory response, creating adhesions and fibrosis that will obliterate the space. The sclerosing agent (typically talc) can be delivered by tube thoracostomy, video-assisted thoracic surgery (VATS), or medical pleuroscopy. Although the latter 2 methods allow direct visualization of the pleural space and, in theory, a more even distribution of the sclerosing agent, current evidence does not favor 1 option over the other,19 and practice patterns vary between institutions.
Tube thoracostomy. Typically, the sclerosing agent is administered once a chest radiograph shows lung reexpansion, and tube output of pleural fluid is less than 150 mL/day.19 However, some studies indicate that if pleural apposition can be confirmed using ultrasonography, then sclerosant administration at that time leads to optimal pleurodesis efficacy and shorter hospitalization.20,21
VATS is usually done in the operating room with the patient under general anesthesia. A double-lumen endotracheal tube allows for single-lung ventilation; a camera is then inserted into the pleural space of the collapsed lung. Multiple ports of entry are usually employed, and the entire pleural space can be visualized and the sclerosing agent instilled uniformly. The surgeon may alternatively choose to perform mechanical pleurodesis, which entails abrading the visceral and parietal pleura with dry gauze to provoke diffuse petechial hemorrhage and an inflammatory reaction. VATS can also be used to perform biopsy, lobectomy, and pneumonectomy.
Medical pleuroscopy. Medical pleuroscopy is usually done using local anesthesia with the patient awake, moderately sedated, and not intubated. Because no double-lumen endotracheal tube is used, lung collapse may not be complete, making it difficult to completely visualize the entire pleural surfaces.
Although no randomized study of VATS vs medical pleuroscopy exists, a retrospective case-matched study22 comparing VATS (under general anesthesia) to single-port VATS (under local anesthesia) noted equivalent rates of pleurodesis. However, the local anesthesia group had a lower perioperative mortality rate (0% vs 2.3%), a lower postoperative major morbidity rate (5.2% vs 9%), earlier improvement in quality of life, and shorter hospitalization (3 vs 5 days).22 In general, the diagnostic sensitivity of pleuroscopy for pleural malignancy is similar to that of VATS (93% vs 97%).23,24
A MAN WITH PLEURAL EFFUSION AND A POOR PROGNOSIS
A 60-year-old man with metastatic pancreatic cancer is brought to the clinic for worsening shortness of breath over the past 2 months. During that time, he has lost 6 kg and has become bedridden.
On examination, he has severe cachexia and is significantly short of breath at rest with associated hypoxia. His oncologist expects him to survive less than 3 months.
His laboratory investigations reveal hypoalbuminemia and leukocytosis. A chest radiograph shows a large left-sided pleural effusion that was not present 2 months ago.
What should be done for him?
Thoracentesis, repeat as needed
Malignant pleural effusion causing dyspnea is not uncommon in certain advanced malignancies and may contribute to significant suffering at the end of life. A study of 298 patients with malignant pleural effusion noted that the presence of leukocytosis, hypoalbuminemia, and hypoxemia was associated with a poorer prognosis. Patients having all 3 factors had a median survival of 42 days.25
Thoracentesis, the least invasive option that may improve dyspnea, can be done in the clinic setting and is a reasonable strategy for patients with advanced cancer and an expected survival of less than 3 months.26 Although recurrence is expected, it may take up to a few weeks, and repeat thoracentesis can be performed as needed.
- Roberts ME, Neville E, Berrisford RG, Antunes G, Ali NJ; BTS Pleural Disease Guideline Group. Management of a malignant pleural effusion: British Thoracic Society pleural disease guideline 2010. Thorax 2010; 65(suppl 2):ii32–ii40. doi:10.1136/thx.2010.136994
- Ruckdeschel JC. Management of malignant pleural effusions. Semin Oncol 1995; 22(2 suppl 3):58–63. pmid:7740322
- Bielsa S, Martín-Juan J, Porcel JM, Rodríguez-Panadero F. Diagnostic and prognostic implications of pleural adhesions in malignant effusions. J Thorac Oncol 2008; 3(11):1251–1256. doi:10.1097/JTO.0b013e318189f53d
- 35th Annual meeting of the European Association for the Study of Diabetes. Brussels, Belgium, 28 September–2 October, 1999. Abstracts. Diabetologia 1999;42(suppl 1):A1–A354. pmid:10505080
- Antony VB, Loddenkemper R, Astoul P, et al. Management of malignant pleural effusions. Eur Respir J 2001; 18(2):402–419. pmid:11529302
- Sahn SA. Malignancy metastatic to the pleura. Clin Chest Med 1998; 19(2):351–361. pmid:9646986
- Sahn SA. Pleural diseases related to metastatic malignancies. Eur Respir J 1997; 10(8):1907–1913. pmid:9272937
- Anderson CB, Philpott GW, Ferguson TB. The treatment of malignant pleural effusions. Cancer 1974; 33(4):916–922. pmid:4362107
- Uzbeck MH, Almeida FA, Sarkiss MG, et al. Management of malignant pleural effusions. Adv Ther 2010; 27(6):334–347. doi:10.1007/S12325-010-0031-8
- Suzuki K, Servais EL, Rizk NP, et al. Palliation and pleurodesis in malignant pleural effusion: the role for tunneled pleural catheters. J Thorac Oncol 2011; 6(4):762–767. doi:10.1097/JTO.0b013e31820d614f
- Tremblay A, Michaud G. Single-center experience with 250 tunnelled pleural catheter insertions for malignant pleural effusion. Chest 2006; 129(2):362–368. doi:10.1378/chest.129.2.362
- Warren WH, Kalimi R, Khodadadian LM, Kim AW. Management of malignant pleural effusions using the Pleur(x) catheter. Ann Thorac Surg 2008; 85(3):1049–1055 doi:10.1016/j.athoracsur.2007.11.039
- Murthy SC, Okereke I, Mason DP, Rice TW. A simple solution for complicated pleural effusions. J Thorac Oncol 2006; 1(7):697–700. pmid:17409939
- Davies HE, Mishra EK, Kahan BC, et al. Effect of an indwelling pleural catheter vs chest tube and talc pleurodesis for relieving dyspnea in patients with malignant pleural effusion: the TIME2 randomized controlled trial. JAMA 2012; 307(22):2383–2389. doi:10.1001/jama.2012.5535
- Fysh ETH, Waterer GW, Kendall PA, et al. Indwelling pleural catheters reduce inpatient days over pleurodesis for malignant pleural effusion. Chest 2012; 142(2):394–400. doi:10.1378/chest.11-2657
- Olfert JA, Penz ED, Manns BJ, et al. Cost-effectiveness of indwelling pleural catheter compared with talc in malignant pleural effusion. Respirology 2017; 22(4):764–770. doi:10.1111/resp.12962
- Morel A, Mishra E, Medley L, et al. Chemotherapy should not be withheld from patients with an indwelling pleural catheter for malignant pleural effusion. Thorax 2011; 66(5):448–449. doi:10.1136/thx.2009.133504
- Van Meter MEM, McKee KY, Kohlwes RJ. Efficacy and safety of tunneled pleural catheters in adults with malignant pleural effusions: a systematic review. J Gen Intern Med 2011; 26(1):70–76. doi:10.1007/s11606-010-1472-0
- Lee YCG, Baumann MH, Maskell NA, et al. Pleurodesis practice for malignant pleural effusions in five English-speaking countries. Chest 2003; 124(6):2229–2238. pmid:14665505
- Villanueva AG, Gray AW Jr, Shahian DM, Williamson WA, Beamis JF Jr. Efficacy of short term versus long term tube thoracostomy drainage before tetracycline pleurodesis in the treatment of malignant pleural effusions. Thorax 1994; 49(1):23–25. pmid:7512285
- Sartori S, Tombesi P, Tassinari D, et al. Sonographically guided small-bore chest tubes and sonographic monitoring for rapid sclerotherapy of recurrent malignant pleural effusions. J Ultrasound Med 2004; 23(9):1171–1176. pmid:15328431
- Mineo TC, Sellitri F, Tacconi F, Ambrogi V. Quality of life and outcomes after nonintubated versus intubated video-thoracoscopic pleurodesis for malignant pleural effusion: comparison by a case-matched study. J Palliat Med 2014; 17(7):761–768. doi:10.1089/jpm.2013.0617
- Michaud G, Berkowitz DM, Ernst A. Pleuroscopy for diagnosis and therapy for pleural effusions. Chest 2010; 138(5):1242–1246. doi:10.1378/chest.10-1259
- Bhatnagar R, Maskell NA. Medical pleuroscopy. Clin Chest Med 2013; 34(3):487–500. doi:10.1016/j.ccm.2013.04.001
- Pilling JE, Dusmet ME, Ladas G, Goldstraw P. Prognostic factors for survival after surgical palliation of malignant pleural effusion. J Thorac Oncol 2010; 5(10):1544–1550. doi:10.1097/JTO.0b013e3181e95cb8
- Beyea A, Winzelberg G, Stafford RE. To drain or not to drain: an evidence-based approach to palliative procedures for the management of malignant pleural effusions. J Pain Symptom Manage 2012; 44(2):301–306. doi:10.1016/j.jpainsymman.2012.05.002
KEY POINTS
- Asymptomatic pleural effusion in patients currently on chemotherapy does not require treatment but should be monitored for progression.
- Indwelling pleural catheters are best used to treat effusion with lung collapse and are increasingly used as first-line therapy in other settings.
- Chemical or mechanical pleurodesis results in filling the pleural space to prevent further fluid accumulation and can be accomplished by one of several methods.
- For patients near the end of life, simple thoracentesis, repeated as needed, is a reasonable strategy.
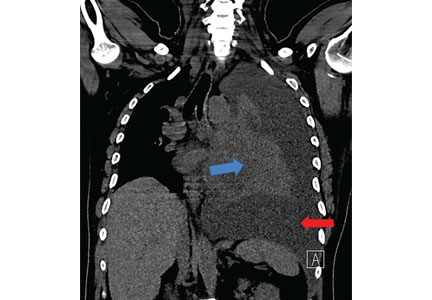
Procalcitonin, Will It Guide Us?
Study Overview
Objective. To assess whether procalcitonin-guided antibiotic usage results in less exposure to antibiotics than usual care, without a significantly higher rate of adverse events.
Design. Multi-center 1:1 randomized trial.
Setting and participants. This study was conducted at 14 academic hospitals in the United States between 2014 and 2017 in which procalcitonin assay was not routinely used. All adult patients in the emergency department with an initial diagnosis of acute lower respiratory tract infection without a decision to give or withhold antibiotics because of uncertainty regarding the need for antibiotics were included in the study. Patients were excluded if antibiotics were unlikely to be held in their case, such as if there was a need for mechanical ventilation or known severe immunosuppression, and if procalcitonin could be falsely elevated (chronic dialysis, metastatic cancer, surgery in the past 7 days).
Intervention. Patients were randomly assigned to receive guideline-based care using procalcitonin (procalcitonin group) or usual care (usual-care group). In the procalcitonin group, the procalcitonin assay results, and the procalcitonin treatment guidelines were provided to the treating physician. The guideline used previously established cutoffs (procalcitonin level of < 0.1 µg/L, antibiotics were strongly discouraged; 0.1 to 0.25 µg/L, antibiotics were discouraged; 0.25 to 0.5 µg/L, antibiotics were recommended; and > 0.5 µg/L, antibiotics were strongly recommended). Procalcitonin was measured initially in the emergency department. If the patient was hospitalized, procalcitonin was again measured 6 to 24 hours later, and on hospital days 3, 5, and 7. To implement this intervention, a multifaceted approach was used, which included sending letters to local primary care providers describing the trial, ensuring rapid delivery of procalcitonin results by tracking and coordinating blood samples with routine morning draws, and embedding the procalcitonin results and guidelines into the sites’ electronic health records. In the usual-care group, procalcitonin levels at enrollment were measured but not disclosed to clinicians. In both treatment groups, clinicians retained autonomy regarding care decisions.
Main outcome measures. The primary outcome was total antibiotic exposure, defined as the total number of antibiotic-days within 30 days after enrollment. The primary safety outcome was any adverse effects that could be attributable to withholding antibiotics in lower respiratory tract infections, within 30 days after enrollment. Secondary outcomes included admission to the intensive care unit (ICU), subsequent emergency department visits by day 30, and quality of life as assessed with the Airway Questionnaire 20.
Main results. 8360 patients with acute lower respiratory tract infection who presented to the emergency department were screened for eligibility; of these, 1664 patients underwent randomization. Ultimately, 1656 patients were included in the final analysis cohort (826 in the procalcitonin group and 830 in the usual-care group), because 8 patients withdrew. Of the cohort, 1345 (81.2%) patients completed the full 30-day follow up. Baseline characteristics were similar between the treatment groups. In the procalcitonin group, clinicians received the procalcitonin results for 95.9% of the patients. As a result of clinical care, 2.2% of the patients in the usual-care group also had procalcitonin testing. Clinicians adhered to the procalcitonin guideline recommendations for 64.8% of the procalcitonin group.
There was no significant difference in the intention-treat-treat analysis between the procalcitonin group and the usual-care group in antibiotic days during the first 30 days (mean antibiotic days, 4.2 and 4.3 days, respectively [95% confidence interval {CI}, –0.6 to 0.5; P = 0.87]). Within 30 days there was no significant difference in the proportion of patients with adverse outcomes in the procalcitonin group and usual-care group (11.7% and 13.1%, respectively [95% CI, –4.6 to 1.7]; P < 0.01 for noninferiority). There was no significant difference between the procalcitonin and usual-care groups for any of the secondary outcomes.
Conclusion. A procalcitonin-directed antibiotic administration guideline did not result in fewer antibiotic days than did usual-care among patients with suspected lower respiratory tract infection.
Commentary
Procalcitonin is a serum biomarker synthesized in thyroid neuroendocrine cells and is the precursor to calcitonin.1 It is undetectable in healthy human serum, but in the setting of systemic inflammation caused by bacterial infection, procalcitonin synthesis is induced in many tissues. Since its discovery in 1970, procalcitonin’s potential utility has been sought in various settings, such as guiding the initiation and/or discontinuation of antibiotics.2
In a prospective randomized trial in patients with an acute chronic obstructive pulmonary disease (COPD) exacerbation, treatment success was not better with antibiotics than placebo in patients with a procalcitonin level < 0.1 µg/L.3 Others replicated these results in COPD patients with acute exacerbation of COPD.4 Another small randomized trial showed that using procalcitonin in intensive care patients reduced antibiotic duration.5 Another small study found similar results in their critical care setting.6 Procalcitonin-guided antibiotic treatment produced similar results in patients with aspiration pneumonia.7 In summary, previously published studies nearly uniformly report reduced antibiotic duration or initiation using procalcitonin cutoffs without increasing adverse events.
In the current study, Huang and colleagues conducted a multi-center randomized trial in 14 academic US hospitals, while simultaneously attempting quality improvement methods for implementing and maximizing compliance with procalcitonin guidelines for local physicians. This study was able to achieve approximately 65% compliance with the guideline, which is relatively lower than in previously reported studies using procalcitonin guidelines. This study was larger and involved more hospitals than the other studies. Interestingly, this study did not find statistically significant differences in antibiotic usage or duration between the procalcitonin group compared to the usual-care group. While this result can be partially explained by the low rate of compliance with the guideline, the result may actually reflect the real-life pattern of procalcitonin guideline usage in clinicians. These results suggest that procalcitonin-based guidelines attempting to reduce antibiotic usage and exposure may be of low value, contrasting with findings from previous studies.
The Huang et al study is well-designed, had a low rate of follow-up loss and withdrawal, was conducted mostly at urban academic hospitals that had a high level of adherence to Joint Commission pneumonia core measures, and had appropriate statistical analyses; however, several factors should be considered when applying the results of this study to clinical practice. First, the large majority (80.1%) of the study cohort had final diagnoses of a COPD exacerbation, asthma exacerbation, or acute bronchitis. These patients had a moderate degree of disease (required hospitalization in 59% of patients with a mean hospital length of stay of 5 days), but their symptoms were severe enough for the patients to present to the emergency department. Patients with a suspected nonrespiratory infection or a milder degree of infection, especially in the ambulatory care setting, may have different antibiotic prescribing patterns. Also, patients in the ambulatory care setting likely have different causal organisms of their diagnosis. Second, this study excluded patients with severe disease who required ICU admission with either septic shock or respiratory failure, patients with pre-existing diseases that placed them at high risk (eg, immunosuppressed patients), and/or patients who had complications of their infection with either a lung abscess or empyema. This pattern of exclusion was widely similar to the other previous procalcitonin studies, which shows that procalcitonin guidelines should not be applied blindly in critically ill patients, even those not requiring ICU admission. Third, patients were excluded from the study if they were on chronic dialysis, had metastatic cancer, or had a recent surgery because of possible elevation of procalcitonin levels without a bacterial infection.
In conclusion, the current study did not find any difference in antibiotic exposure throughout the course of care (including discharge or hospitalization) of patients with a lower respiratory tract infection who presented to the emergency department when a procalcitonin guideline was implemented. The results of the current study raise questions regarding the new trend of widely accepting procalcitonin-based antibiotic usage.
Applications for Clinical Practice
Procalcitonin is a relatively new marker that is released during a systemic bacterial infection. While prior studies have supported systematic use of procalcitonin-based guidelines to initiate and discontinue antibiotics in order to limit antibiotic exposure, clinicians should be mindful that a procalcitonin antibiotic guideline may be useful in specific patients and should only be used in combination with usual clinical judgment. Clinicians must also recognize the medical conditions that may falsely elevate the procalcitonin level. Most important, the procalcitonin level should not be used as the sole indication to withhold antibiotics in an otherwise appropriately indicated clinical scenario.
—Minkyung Kwon, MD, Scott A. Helgeson, MD, and Vichaya Arunthari, MD
Pulmonary and Critical Care Medicine, Mayo Clinic Florida, Jacksonville, FL
1. Maruna P, Nedelnikova K, Gurlich R. Physiology and genetics of procalcitonin. Physiol Res. 2000;49:S57-S61.
2. Deftos LJ, Roos BA, Bronzert D, Parthemore JG. Immunochemical heterogeneity of calcitonin in plasma. J Clin Endocr Metab. 1975;40:409-412.
3. Wang JX, Zhang SM, Li XH, et al. Acute exacerbations of chronic obstructive pulmonary disease with low serum procalcitonin values do not benefit from antibiotic treatment: a prospective randomized controlled trial. Int J Infect Dis. 2016;48:40-45.
4. Corti C, Fally M, Fabricius-Bjerre A, et al. Point-of-care procalcitonin test to reduce antibiotic exposure in patients hospitalized with acute exacerbation of COPD. Int J Chron Obstruct Pulmon Dis. 2016;11:1381-1389.
5. Deliberato RO, Marra AR, Sanches PR, et al. Clinical and economic impact of procalcitonin to shorten antimicrobial therapy in septic patients with proven bacterial infection in an intensive care setting. Diagn Microbiol Infect Dis. 2013;76:266-271.
6. Najafi A, Khodadadian A, Sanatkar M, et al. The comparison of procalcitonin guidance administer antibiotics with empiric antibiotic therapy in critically ill patients admitted in intensive care unit. Acta Med Iran. 2015;53:562-567.
7. Tanaka K, Ogasawara T, Aoshima Y, et al. Procalcitonin-guided algorithm in nursing and healthcare-associated pneumonia. Respirology. 2014;19:220-220.
Study Overview
Objective. To assess whether procalcitonin-guided antibiotic usage results in less exposure to antibiotics than usual care, without a significantly higher rate of adverse events.
Design. Multi-center 1:1 randomized trial.
Setting and participants. This study was conducted at 14 academic hospitals in the United States between 2014 and 2017 in which procalcitonin assay was not routinely used. All adult patients in the emergency department with an initial diagnosis of acute lower respiratory tract infection without a decision to give or withhold antibiotics because of uncertainty regarding the need for antibiotics were included in the study. Patients were excluded if antibiotics were unlikely to be held in their case, such as if there was a need for mechanical ventilation or known severe immunosuppression, and if procalcitonin could be falsely elevated (chronic dialysis, metastatic cancer, surgery in the past 7 days).
Intervention. Patients were randomly assigned to receive guideline-based care using procalcitonin (procalcitonin group) or usual care (usual-care group). In the procalcitonin group, the procalcitonin assay results, and the procalcitonin treatment guidelines were provided to the treating physician. The guideline used previously established cutoffs (procalcitonin level of < 0.1 µg/L, antibiotics were strongly discouraged; 0.1 to 0.25 µg/L, antibiotics were discouraged; 0.25 to 0.5 µg/L, antibiotics were recommended; and > 0.5 µg/L, antibiotics were strongly recommended). Procalcitonin was measured initially in the emergency department. If the patient was hospitalized, procalcitonin was again measured 6 to 24 hours later, and on hospital days 3, 5, and 7. To implement this intervention, a multifaceted approach was used, which included sending letters to local primary care providers describing the trial, ensuring rapid delivery of procalcitonin results by tracking and coordinating blood samples with routine morning draws, and embedding the procalcitonin results and guidelines into the sites’ electronic health records. In the usual-care group, procalcitonin levels at enrollment were measured but not disclosed to clinicians. In both treatment groups, clinicians retained autonomy regarding care decisions.
Main outcome measures. The primary outcome was total antibiotic exposure, defined as the total number of antibiotic-days within 30 days after enrollment. The primary safety outcome was any adverse effects that could be attributable to withholding antibiotics in lower respiratory tract infections, within 30 days after enrollment. Secondary outcomes included admission to the intensive care unit (ICU), subsequent emergency department visits by day 30, and quality of life as assessed with the Airway Questionnaire 20.
Main results. 8360 patients with acute lower respiratory tract infection who presented to the emergency department were screened for eligibility; of these, 1664 patients underwent randomization. Ultimately, 1656 patients were included in the final analysis cohort (826 in the procalcitonin group and 830 in the usual-care group), because 8 patients withdrew. Of the cohort, 1345 (81.2%) patients completed the full 30-day follow up. Baseline characteristics were similar between the treatment groups. In the procalcitonin group, clinicians received the procalcitonin results for 95.9% of the patients. As a result of clinical care, 2.2% of the patients in the usual-care group also had procalcitonin testing. Clinicians adhered to the procalcitonin guideline recommendations for 64.8% of the procalcitonin group.
There was no significant difference in the intention-treat-treat analysis between the procalcitonin group and the usual-care group in antibiotic days during the first 30 days (mean antibiotic days, 4.2 and 4.3 days, respectively [95% confidence interval {CI}, –0.6 to 0.5; P = 0.87]). Within 30 days there was no significant difference in the proportion of patients with adverse outcomes in the procalcitonin group and usual-care group (11.7% and 13.1%, respectively [95% CI, –4.6 to 1.7]; P < 0.01 for noninferiority). There was no significant difference between the procalcitonin and usual-care groups for any of the secondary outcomes.
Conclusion. A procalcitonin-directed antibiotic administration guideline did not result in fewer antibiotic days than did usual-care among patients with suspected lower respiratory tract infection.
Commentary
Procalcitonin is a serum biomarker synthesized in thyroid neuroendocrine cells and is the precursor to calcitonin.1 It is undetectable in healthy human serum, but in the setting of systemic inflammation caused by bacterial infection, procalcitonin synthesis is induced in many tissues. Since its discovery in 1970, procalcitonin’s potential utility has been sought in various settings, such as guiding the initiation and/or discontinuation of antibiotics.2
In a prospective randomized trial in patients with an acute chronic obstructive pulmonary disease (COPD) exacerbation, treatment success was not better with antibiotics than placebo in patients with a procalcitonin level < 0.1 µg/L.3 Others replicated these results in COPD patients with acute exacerbation of COPD.4 Another small randomized trial showed that using procalcitonin in intensive care patients reduced antibiotic duration.5 Another small study found similar results in their critical care setting.6 Procalcitonin-guided antibiotic treatment produced similar results in patients with aspiration pneumonia.7 In summary, previously published studies nearly uniformly report reduced antibiotic duration or initiation using procalcitonin cutoffs without increasing adverse events.
In the current study, Huang and colleagues conducted a multi-center randomized trial in 14 academic US hospitals, while simultaneously attempting quality improvement methods for implementing and maximizing compliance with procalcitonin guidelines for local physicians. This study was able to achieve approximately 65% compliance with the guideline, which is relatively lower than in previously reported studies using procalcitonin guidelines. This study was larger and involved more hospitals than the other studies. Interestingly, this study did not find statistically significant differences in antibiotic usage or duration between the procalcitonin group compared to the usual-care group. While this result can be partially explained by the low rate of compliance with the guideline, the result may actually reflect the real-life pattern of procalcitonin guideline usage in clinicians. These results suggest that procalcitonin-based guidelines attempting to reduce antibiotic usage and exposure may be of low value, contrasting with findings from previous studies.
The Huang et al study is well-designed, had a low rate of follow-up loss and withdrawal, was conducted mostly at urban academic hospitals that had a high level of adherence to Joint Commission pneumonia core measures, and had appropriate statistical analyses; however, several factors should be considered when applying the results of this study to clinical practice. First, the large majority (80.1%) of the study cohort had final diagnoses of a COPD exacerbation, asthma exacerbation, or acute bronchitis. These patients had a moderate degree of disease (required hospitalization in 59% of patients with a mean hospital length of stay of 5 days), but their symptoms were severe enough for the patients to present to the emergency department. Patients with a suspected nonrespiratory infection or a milder degree of infection, especially in the ambulatory care setting, may have different antibiotic prescribing patterns. Also, patients in the ambulatory care setting likely have different causal organisms of their diagnosis. Second, this study excluded patients with severe disease who required ICU admission with either septic shock or respiratory failure, patients with pre-existing diseases that placed them at high risk (eg, immunosuppressed patients), and/or patients who had complications of their infection with either a lung abscess or empyema. This pattern of exclusion was widely similar to the other previous procalcitonin studies, which shows that procalcitonin guidelines should not be applied blindly in critically ill patients, even those not requiring ICU admission. Third, patients were excluded from the study if they were on chronic dialysis, had metastatic cancer, or had a recent surgery because of possible elevation of procalcitonin levels without a bacterial infection.
In conclusion, the current study did not find any difference in antibiotic exposure throughout the course of care (including discharge or hospitalization) of patients with a lower respiratory tract infection who presented to the emergency department when a procalcitonin guideline was implemented. The results of the current study raise questions regarding the new trend of widely accepting procalcitonin-based antibiotic usage.
Applications for Clinical Practice
Procalcitonin is a relatively new marker that is released during a systemic bacterial infection. While prior studies have supported systematic use of procalcitonin-based guidelines to initiate and discontinue antibiotics in order to limit antibiotic exposure, clinicians should be mindful that a procalcitonin antibiotic guideline may be useful in specific patients and should only be used in combination with usual clinical judgment. Clinicians must also recognize the medical conditions that may falsely elevate the procalcitonin level. Most important, the procalcitonin level should not be used as the sole indication to withhold antibiotics in an otherwise appropriately indicated clinical scenario.
—Minkyung Kwon, MD, Scott A. Helgeson, MD, and Vichaya Arunthari, MD
Pulmonary and Critical Care Medicine, Mayo Clinic Florida, Jacksonville, FL
1. Maruna P, Nedelnikova K, Gurlich R. Physiology and genetics of procalcitonin. Physiol Res. 2000;49:S57-S61.
2. Deftos LJ, Roos BA, Bronzert D, Parthemore JG. Immunochemical heterogeneity of calcitonin in plasma. J Clin Endocr Metab. 1975;40:409-412.
3. Wang JX, Zhang SM, Li XH, et al. Acute exacerbations of chronic obstructive pulmonary disease with low serum procalcitonin values do not benefit from antibiotic treatment: a prospective randomized controlled trial. Int J Infect Dis. 2016;48:40-45.
4. Corti C, Fally M, Fabricius-Bjerre A, et al. Point-of-care procalcitonin test to reduce antibiotic exposure in patients hospitalized with acute exacerbation of COPD. Int J Chron Obstruct Pulmon Dis. 2016;11:1381-1389.
5. Deliberato RO, Marra AR, Sanches PR, et al. Clinical and economic impact of procalcitonin to shorten antimicrobial therapy in septic patients with proven bacterial infection in an intensive care setting. Diagn Microbiol Infect Dis. 2013;76:266-271.
6. Najafi A, Khodadadian A, Sanatkar M, et al. The comparison of procalcitonin guidance administer antibiotics with empiric antibiotic therapy in critically ill patients admitted in intensive care unit. Acta Med Iran. 2015;53:562-567.
7. Tanaka K, Ogasawara T, Aoshima Y, et al. Procalcitonin-guided algorithm in nursing and healthcare-associated pneumonia. Respirology. 2014;19:220-220.
Mild OSA spontaneously resolves in about one-third of young children
CORONADO, CALIF. – results from a single-center study showed.

“OSA affects up to 6% of the pediatric population, and diagnosis of young children can be particularly challenging due to the heterogeneity of presenting symptoms,” Douglas C. von Allmen, MD, said at the Triological Society’s Combined Sections Meeting. “While school-age children may present with snoring, that’s less common in the younger population. Up to one-quarter of infants may have noisy breathing, which may mimic obstructive events throughout the first 3 years of life. Additionally, long-term clinical implications of mild sleep apnea in very young children is unclear.”
According to Dr. von Allmen, a fifth-year otolaryngology resident at the University of Cincinnati, management strategies of children with OSA can include a period of observation, particularly when there’s an absence of concerning findings on polysomnography (PSG), such as hypoventilation or significant hypoxia, or when the primary etiology of the OSA is unknown. “Additionally, few studies at this point have attempted to characterize the natural history of mild OSA in pediatric patients under 3 years of age,” he said.
In an effort to assess the effects of observation on the PSG outcomes of children under 3 years with mild OSA, Dr. Von Allmen and his colleagues performed a retrospective review of 26 children who had an overnight PSG with a follow-up PSG performed 3-12 months later. They excluded patients with neuromuscular disease, tracheostomy, or interstitial lung disease. All PSGs were performed at the Cincinnati Children’s Hospital Medical Center between 2012 and 2017 and were scored by a board-certified sleep physician. The researchers defined mild OSA as at least one, but fewer than five, events per hour. The mean age of the 26 patients was 7 months, 65% were male, 92% were white, and their median body mass index was in the 39th percentile. Comorbidities include laryngomalacia (40%), cardiac disease (40%), allergies (34%), asthma (23%), and Down syndrome (11%).
Between baseline and follow-up, the apnea-hypoapnea index (AHI) trended downward from 4.3 to 3.4 events per hour (P = .19), the obstructive AHI decreased significantly from 2.7 to 1.3 events per hour (P = .013), while the central apnea index also trended downward from 1.4 to 1.2 events per hour (P = .60). The oxyhemoglobin nadir and sleep efficiency did not change significantly, but there was a decrease in the arousal index (from 14.7 to 13 events per hour; P = .027) and in the percentage of REM sleep (from 33% to 30%; P = .008).
As for postobservation OSA severity outcomes, eight patients (31%) resolved spontaneously, one patient progressed from mild to moderate OSA, and the rest remained in their mild OSA state. Subanalysis revealed that OSA resolution rate was 36% in patients with laryngomalacia, compared with 27% in those with no laryngomalacia, a difference that did not reach statistical significance (P = .98).
Dr. von Allmen pointed out that the study cohort had comorbidities which may have contributed to the persistence of OSA. He also acknowledged certain limitations of the study, including its retrospective nature, the potential for selection bias, the small sample size, and the fact that it did not include a control sample of normal children. “The presence of laryngomalacia did not affect the resolution rate in our cohort, but we’ll need larger studies to better elucidate the factors that do affect persistent disease and to identify the optimal timing of intervention in children with mild OSA,” he said.
Dr. von Allmen reported having no financial disclosures. The study received a resident research award at the meeting, which was jointly sponsored by the Triological Society and the American College of Surgeons.
SOURCE: von Allmen DC et al. Triological CSM, Abstracts.
CORONADO, CALIF. – results from a single-center study showed.
“OSA affects up to 6% of the pediatric population, and diagnosis of young children can be particularly challenging due to the heterogeneity of presenting symptoms,” Douglas C. von Allmen, MD, said at the Triological Society’s Combined Sections Meeting. “While school-age children may present with snoring, that’s less common in the younger population. Up to one-quarter of infants may have noisy breathing, which may mimic obstructive events throughout the first 3 years of life. Additionally, long-term clinical implications of mild sleep apnea in very young children is unclear.”
According to Dr. von Allmen, a fifth-year otolaryngology resident at the University of Cincinnati, management strategies of children with OSA can include a period of observation, particularly when there’s an absence of concerning findings on polysomnography (PSG), such as hypoventilation or significant hypoxia, or when the primary etiology of the OSA is unknown. “Additionally, few studies at this point have attempted to characterize the natural history of mild OSA in pediatric patients under 3 years of age,” he said.
In an effort to assess the effects of observation on the PSG outcomes of children under 3 years with mild OSA, Dr. Von Allmen and his colleagues performed a retrospective review of 26 children who had an overnight PSG with a follow-up PSG performed 3-12 months later. They excluded patients with neuromuscular disease, tracheostomy, or interstitial lung disease. All PSGs were performed at the Cincinnati Children’s Hospital Medical Center between 2012 and 2017 and were scored by a board-certified sleep physician. The researchers defined mild OSA as at least one, but fewer than five, events per hour. The mean age of the 26 patients was 7 months, 65% were male, 92% were white, and their median body mass index was in the 39th percentile. Comorbidities include laryngomalacia (40%), cardiac disease (40%), allergies (34%), asthma (23%), and Down syndrome (11%).
Between baseline and follow-up, the apnea-hypoapnea index (AHI) trended downward from 4.3 to 3.4 events per hour (P = .19), the obstructive AHI decreased significantly from 2.7 to 1.3 events per hour (P = .013), while the central apnea index also trended downward from 1.4 to 1.2 events per hour (P = .60). The oxyhemoglobin nadir and sleep efficiency did not change significantly, but there was a decrease in the arousal index (from 14.7 to 13 events per hour; P = .027) and in the percentage of REM sleep (from 33% to 30%; P = .008).
As for postobservation OSA severity outcomes, eight patients (31%) resolved spontaneously, one patient progressed from mild to moderate OSA, and the rest remained in their mild OSA state. Subanalysis revealed that OSA resolution rate was 36% in patients with laryngomalacia, compared with 27% in those with no laryngomalacia, a difference that did not reach statistical significance (P = .98).
Dr. von Allmen pointed out that the study cohort had comorbidities which may have contributed to the persistence of OSA. He also acknowledged certain limitations of the study, including its retrospective nature, the potential for selection bias, the small sample size, and the fact that it did not include a control sample of normal children. “The presence of laryngomalacia did not affect the resolution rate in our cohort, but we’ll need larger studies to better elucidate the factors that do affect persistent disease and to identify the optimal timing of intervention in children with mild OSA,” he said.
Dr. von Allmen reported having no financial disclosures. The study received a resident research award at the meeting, which was jointly sponsored by the Triological Society and the American College of Surgeons.
SOURCE: von Allmen DC et al. Triological CSM, Abstracts.
REPORTING FROM THE TRIOLOGICAL CSM
Key clinical point: Comorbidities may contribute to the persistence of OSA in young children.
Major finding: OSA spontaneously resolved in 31% of patients.
Study details: A retrospective analysis of 26 children under age 3 years.
Disclosures: The researchers reported having no financial disclosures.
Source: Von Allmen et al. Triological CSM, Abstracts.
Pediatricians get more guidance to be proactive on youth e-cig use
The American Academy of Pediatrics is pushing for pediatricians to be more proactive in keeping youth from becoming addicted to nicotine through the use of electronic cigarettes. “E-cigarettes are the most common tobacco product used among youth,” Brian Jenssen, MD, policy chair of the AAP Section on Tobacco Control and Susan Walley, MD, chair of the section, wrote in recommendations for pediatricians and policy makers regarding the use of e-cigarettes and similar devices. These recommendations were published in0 Pediatrics.

“To prevent children, adolescents, and young adults from transitioning from e-cigarettes to traditional cigarettes and to minimize the potential public health harm from e-cigarette use, there is a critical need for e-cigarette legislative action, and counterpromotion to help youth live tobacco-free lives,” the authors continued.
To that end, AAP is making a series of recommended actions by pediatricians. First, they are calling for pediatricians to screen for e-cigarette use and exposure and to provide prevention counseling in clinical practice.
Second, the organization is calling on pediatricians to provide counseling that areas where youth spend time – including homes, cars, schools, and other places – should have “comprehensive tobacco-free bans that include e-cigarettes as well as combustible tobacco products.”
Finally, pediatricians should never recommend e-cigarettes as a tobacco-dependence treatment product.
AAP in the guidance document also made a series of policy recommendations, including calling on the Food and Drug Administration to regulate e-cigarettes as they do traditional tobacco products; ban the sale of e-cigarettes to anyone under 21 years of age; ban all flavored e-cigarettes, including menthol; ban advertising of e-cigarettes that is accessible to youth; tax e-cigarettes similar to traditional cigarettes; and incorporate e-cigarettes into current tobacco-free laws and ordinances.
Dr. Jenssen and Dr. Walley also call for more research to inform public policy and understand health effects.
“Additional research is needed to understand the trajectory of addiction among youth and the progression to combustible tobacco products,” they wrote. “Studies are needed to determine if and how e-cigarettes may be effective for smoking cessation; these trials must be carefully designed and adequately powered. Finally, research is needed to evaluate effective countermessaging and public health interventions.”
SOURCE: Jenssen B et al. Pediatrics. doi: 10.1542/peds.2018-3652.
The American Academy of Pediatrics is pushing for pediatricians to be more proactive in keeping youth from becoming addicted to nicotine through the use of electronic cigarettes. “E-cigarettes are the most common tobacco product used among youth,” Brian Jenssen, MD, policy chair of the AAP Section on Tobacco Control and Susan Walley, MD, chair of the section, wrote in recommendations for pediatricians and policy makers regarding the use of e-cigarettes and similar devices. These recommendations were published in0 Pediatrics.
“To prevent children, adolescents, and young adults from transitioning from e-cigarettes to traditional cigarettes and to minimize the potential public health harm from e-cigarette use, there is a critical need for e-cigarette legislative action, and counterpromotion to help youth live tobacco-free lives,” the authors continued.
To that end, AAP is making a series of recommended actions by pediatricians. First, they are calling for pediatricians to screen for e-cigarette use and exposure and to provide prevention counseling in clinical practice.
Second, the organization is calling on pediatricians to provide counseling that areas where youth spend time – including homes, cars, schools, and other places – should have “comprehensive tobacco-free bans that include e-cigarettes as well as combustible tobacco products.”
Finally, pediatricians should never recommend e-cigarettes as a tobacco-dependence treatment product.
AAP in the guidance document also made a series of policy recommendations, including calling on the Food and Drug Administration to regulate e-cigarettes as they do traditional tobacco products; ban the sale of e-cigarettes to anyone under 21 years of age; ban all flavored e-cigarettes, including menthol; ban advertising of e-cigarettes that is accessible to youth; tax e-cigarettes similar to traditional cigarettes; and incorporate e-cigarettes into current tobacco-free laws and ordinances.
Dr. Jenssen and Dr. Walley also call for more research to inform public policy and understand health effects.
“Additional research is needed to understand the trajectory of addiction among youth and the progression to combustible tobacco products,” they wrote. “Studies are needed to determine if and how e-cigarettes may be effective for smoking cessation; these trials must be carefully designed and adequately powered. Finally, research is needed to evaluate effective countermessaging and public health interventions.”
SOURCE: Jenssen B et al. Pediatrics. doi: 10.1542/peds.2018-3652.
FROM PEDIATRICS
Key clinical point: Pediatrics, policy makers need to be more proactive to curb e-cig use in youth
Major finding: There is a critical need for more regulation to protect youth from harmful effects of e-cigs.
Study details: Recommendations by the American Academy of Pediatrics to help minimize youth exposure to e-cigs.
Disclosures: No disclosures were reported by the authors.
Source: Jenssen B et al. Pediatrics. 2019. doi: 10.1542/peds.2018-3652.
Does left atrial appendage closure reduce stroke rates as well as oral anticoagulants and antiplatelet meds in A-fib patients?
EVIDENCE SUMMARY
A 2017 network meta-analysis included 19 RCTs and 87,831 patients receiving anticoagulation, antiplatelet therapy, or LAAC for NVAF.1 LAAC was superior to antiplatelet therapy (hazard ratio [HR]=0.44; 95% confidence interval [CI], 0.23-0.86; P<.05) and similar to NOACs (HR=1.01; 95% CI, 0.53-1.92; P=.969) for reducing risk of stroke.
LAAC and NOACs found “most effective”
A network meta-analysis of 21 RCTs, which included data from 96,017 patients, examined the effectiveness of 7 interventions to prevent stroke in patients with NVAF: 4 NOACs, VKA, aspirin, and LAAC; the analysis compared VKA with the other interventions.2 The 2 trials that investigated LAAC accounted for only 1114 patients.
When the 7 interventions were ranked simultaneously on 2 efficacy outcomes (stroke/systemic embolism and all-cause mortality), all 4 NOACs and LAAC clustered together as “the most effective and lifesaving.”
Fewer hemorrhagic strokes with LAAC than VKA
A 2016 meta-analysis of 6 RCTs compared risk of stroke for adults with NVAF who received LAAC, VKA, or NOACs.3 No significant differences were found between NOACs and VKA or LAAC and VKA. The LAAC group had a significantly smaller number of patients.
A 2015 meta-analysis of 2406 patients with NVAF found that patients who received LAAC had significantly fewer hemorrhagic strokes (HR=0.22; P<.05) than patients who received VKA.4 No differences in all-cause stroke were found between the 2 groups during an average follow-up of 2.69 years.
LAAC found superior to warfarin for stroke prevention in one trial
A 2014 multicenter, randomized study (PROTECT-AF) of 707 patients with NVAF plus 1 additional stroke risk factor compared LAAC with VKA (warfarin).5 LAAC met criteria at 3.8 years for both noninferiority and superiority in preventing stroke, based on 2.3 events per 100 patient-years compared with 3.8 events per 100 patient-years for VKA. The number needed to treat with LAAC was 67 to result in 1 less event per patient-year.
A 2014 RCT (PREVAIL) evaluated patients with NVAF plus 1 additional stroke risk factor. LAAC was noninferior to warfarin for ischemic stroke prevention.6
Continue to: RECOMMENDATIONS
RECOMMENDATIONS
The American College of Cardiology (ACC) recommends LAAC for patients with NVAF who are not candidates for long-term anticoagulation.7 Similarly, the 2016 European Society of Cardiology guidelines issued a Class IIb recommendation for LAAC for stroke prevention in those with contraindications for long-term anticoagulation.8 Lastly, in a 2014 guideline, the American Heart Association, ACC, and the Heart Rhythm Society issued a Class IIb recommendation for surgical excision of the left atrial appendage in patients with atrial fibrillation undergoing cardiac surgery, but did not provide recommendations regarding LAAC.9
1. Sahay S, Nombela-Franco L, Rodes-Cabau J, et al. Efficacy and safety of left atrial appendage closure versus medical treatment in atrial fibrillation: a network meta-analysis from randomised trials. Heart. 2017;103:139-147.
2. Tereshchenko LG, Henrikson CA, Cigarroa, J, et al. Comparative effectiveness of interventions for stroke prevention in atrial fibrillation: a network meta-analysis. J Am Heart Assoc. 2016; 5:e003206.
3. Bajaj NS, Kalra R, Patel N, et al. Comparison of approaches for stroke prophylaxis in patients with non-valvular atrial fibrillation: network meta-analyses of randomized clinical trials. PLoS One. 2016;11:e0163608.
4. Holmes DR Jr, Doshi SK, Kar S, et al. Left atrial appendage closure as an alternative to warfarin for stroke prevention in atrial fibrillation: a patient-level meta-analysis. J Am Coll Cardiol. 2015;65:2614-2623.
5. Reddy VY, Sievert H, Halperin J, et al. Percutaneous left atrial appendage closure vs warfarin for atrial fibrillation: a randomized clinical trial. JAMA. 2014;312:1988-1998.
6. Holmes DR Jr, Kar S, Price MJ, et al. Prospective randomized evaluation of the Watchman Left Atrial Appendage Closure device in patients with atrial fibrillation versus long-term warfarin therapy: the PREVAIL trial. J Am Coll Cardiol. 2014;64:1-12.
7. Panaich S, Holmes DR. Left atrial appendage occlusion: Expert analysis. http://www.acc.org/latest-in-cardiology/articles/2017/ 01/31/13/08/left-atrial-appendage-occlusion. Accessed April 5, 2018.
8. Kirchof P, Benussi S, Kotecha D, et al. 2016 ESC guidelines for management of atrial fibrillation developed in collaboration with EACTS. Europace. 2016;18:1609-1678.
9. January CT, Wann LS, Alpert LS, et al. 2014 AHA/ACC/HRS guideline for the management of patients with atrial fibrillation: executive summary. JACC. 2014;64:2246-2280.
EVIDENCE SUMMARY
A 2017 network meta-analysis included 19 RCTs and 87,831 patients receiving anticoagulation, antiplatelet therapy, or LAAC for NVAF.1 LAAC was superior to antiplatelet therapy (hazard ratio [HR]=0.44; 95% confidence interval [CI], 0.23-0.86; P<.05) and similar to NOACs (HR=1.01; 95% CI, 0.53-1.92; P=.969) for reducing risk of stroke.
LAAC and NOACs found “most effective”
A network meta-analysis of 21 RCTs, which included data from 96,017 patients, examined the effectiveness of 7 interventions to prevent stroke in patients with NVAF: 4 NOACs, VKA, aspirin, and LAAC; the analysis compared VKA with the other interventions.2 The 2 trials that investigated LAAC accounted for only 1114 patients.
When the 7 interventions were ranked simultaneously on 2 efficacy outcomes (stroke/systemic embolism and all-cause mortality), all 4 NOACs and LAAC clustered together as “the most effective and lifesaving.”
Fewer hemorrhagic strokes with LAAC than VKA
A 2016 meta-analysis of 6 RCTs compared risk of stroke for adults with NVAF who received LAAC, VKA, or NOACs.3 No significant differences were found between NOACs and VKA or LAAC and VKA. The LAAC group had a significantly smaller number of patients.
A 2015 meta-analysis of 2406 patients with NVAF found that patients who received LAAC had significantly fewer hemorrhagic strokes (HR=0.22; P<.05) than patients who received VKA.4 No differences in all-cause stroke were found between the 2 groups during an average follow-up of 2.69 years.
LAAC found superior to warfarin for stroke prevention in one trial
A 2014 multicenter, randomized study (PROTECT-AF) of 707 patients with NVAF plus 1 additional stroke risk factor compared LAAC with VKA (warfarin).5 LAAC met criteria at 3.8 years for both noninferiority and superiority in preventing stroke, based on 2.3 events per 100 patient-years compared with 3.8 events per 100 patient-years for VKA. The number needed to treat with LAAC was 67 to result in 1 less event per patient-year.
A 2014 RCT (PREVAIL) evaluated patients with NVAF plus 1 additional stroke risk factor. LAAC was noninferior to warfarin for ischemic stroke prevention.6
Continue to: RECOMMENDATIONS
RECOMMENDATIONS
The American College of Cardiology (ACC) recommends LAAC for patients with NVAF who are not candidates for long-term anticoagulation.7 Similarly, the 2016 European Society of Cardiology guidelines issued a Class IIb recommendation for LAAC for stroke prevention in those with contraindications for long-term anticoagulation.8 Lastly, in a 2014 guideline, the American Heart Association, ACC, and the Heart Rhythm Society issued a Class IIb recommendation for surgical excision of the left atrial appendage in patients with atrial fibrillation undergoing cardiac surgery, but did not provide recommendations regarding LAAC.9
1. Sahay S, Nombela-Franco L, Rodes-Cabau J, et al. Efficacy and safety of left atrial appendage closure versus medical treatment in atrial fibrillation: a network meta-analysis from randomised trials. Heart. 2017;103:139-147.
2. Tereshchenko LG, Henrikson CA, Cigarroa, J, et al. Comparative effectiveness of interventions for stroke prevention in atrial fibrillation: a network meta-analysis. J Am Heart Assoc. 2016; 5:e003206.
3. Bajaj NS, Kalra R, Patel N, et al. Comparison of approaches for stroke prophylaxis in patients with non-valvular atrial fibrillation: network meta-analyses of randomized clinical trials. PLoS One. 2016;11:e0163608.
4. Holmes DR Jr, Doshi SK, Kar S, et al. Left atrial appendage closure as an alternative to warfarin for stroke prevention in atrial fibrillation: a patient-level meta-analysis. J Am Coll Cardiol. 2015;65:2614-2623.
5. Reddy VY, Sievert H, Halperin J, et al. Percutaneous left atrial appendage closure vs warfarin for atrial fibrillation: a randomized clinical trial. JAMA. 2014;312:1988-1998.
6. Holmes DR Jr, Kar S, Price MJ, et al. Prospective randomized evaluation of the Watchman Left Atrial Appendage Closure device in patients with atrial fibrillation versus long-term warfarin therapy: the PREVAIL trial. J Am Coll Cardiol. 2014;64:1-12.
7. Panaich S, Holmes DR. Left atrial appendage occlusion: Expert analysis. http://www.acc.org/latest-in-cardiology/articles/2017/ 01/31/13/08/left-atrial-appendage-occlusion. Accessed April 5, 2018.
8. Kirchof P, Benussi S, Kotecha D, et al. 2016 ESC guidelines for management of atrial fibrillation developed in collaboration with EACTS. Europace. 2016;18:1609-1678.
9. January CT, Wann LS, Alpert LS, et al. 2014 AHA/ACC/HRS guideline for the management of patients with atrial fibrillation: executive summary. JACC. 2014;64:2246-2280.
EVIDENCE-BASED ANSWER:
Yes. Left atrial appendage closure (LAAC) with the Watchman device is noninferior to vitamin K antagonists (VKAs) and non-VKA oral anticoagulants (NOACs) for adults with nonvalvular atrial fibrillation (NVAF) and 1 additional stroke risk factor (strength of recommendation [SOR]: A, multiple meta-analyses).
LAAC has consistently been shown to be superior to antiplatelet therapy (SOR: A, single meta-analysis). One randomized controlled trial (RCT) demonstrated superiority of LAAC to VKA (SOR: B, single RCT).

Flu activity increases after 2 weeks of declines
according to the Centers for Disease Control and Prevention.
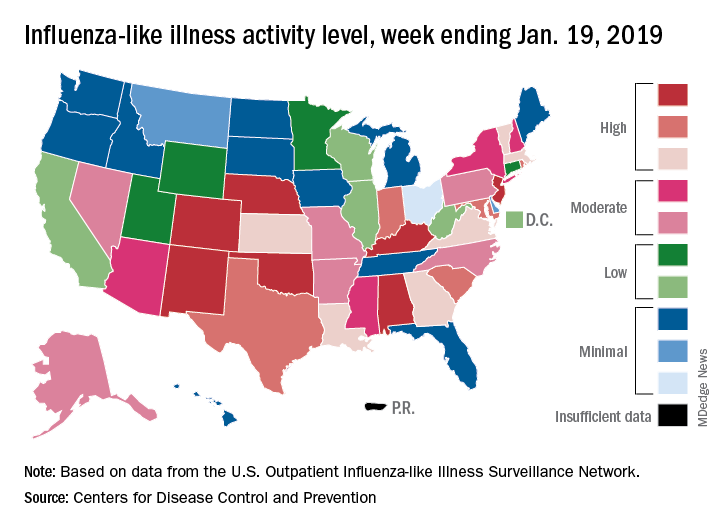
The proportion of outpatient visits for influenza-like illness (ILI) was 3.3% for the most recent measurement period, the CDC’s influenza division reported Jan 25. The previous 2-week decline had seen ILI visits dip down to 3.1% for the week ending Jan. 12 after hitting a season high of 4%.
To go along with the national increase in visits, more states reported high levels of flu activity. For the week ending Jan. 19, seven states were at level 10 on the CDC’s 1-10 scale, compared with four the previous week, and there were 18 states in the high range (levels 8-10), compared with 9 the week before, the CDC said.
Three flu-related pediatric deaths were reported in the week ending Jan. 19, although all three occurred during earlier weeks. The total number of pediatric deaths for the 2018-2019 season is now up to 22. Deaths among all ages, which are reported a week later, totaled 118 for the week ending Jan. 12, with 63% of reporting complete. There were 144 deaths during the week ending Jan. 5, with reporting 86% complete. During the second full week of 2018, in the middle of the very severe 2017-2018 season, there were 1,537 flu-related deaths, CDC data show.
according to the Centers for Disease Control and Prevention.
The proportion of outpatient visits for influenza-like illness (ILI) was 3.3% for the most recent measurement period, the CDC’s influenza division reported Jan 25. The previous 2-week decline had seen ILI visits dip down to 3.1% for the week ending Jan. 12 after hitting a season high of 4%.
To go along with the national increase in visits, more states reported high levels of flu activity. For the week ending Jan. 19, seven states were at level 10 on the CDC’s 1-10 scale, compared with four the previous week, and there were 18 states in the high range (levels 8-10), compared with 9 the week before, the CDC said.
Three flu-related pediatric deaths were reported in the week ending Jan. 19, although all three occurred during earlier weeks. The total number of pediatric deaths for the 2018-2019 season is now up to 22. Deaths among all ages, which are reported a week later, totaled 118 for the week ending Jan. 12, with 63% of reporting complete. There were 144 deaths during the week ending Jan. 5, with reporting 86% complete. During the second full week of 2018, in the middle of the very severe 2017-2018 season, there were 1,537 flu-related deaths, CDC data show.