User login
Electronic Reminders Extend the Reach of Health Care
Many health care providers (HCPs) view the US Department of Veterans Affairs (VA) system of electronic reminders as a model. User experience and improvements that make clinical life easier (like automated text messaging, which requires no hands-on staff involvement) have brought more HCPs into the fold. And during a viral pandemic, preventive care is ever more important, as are the ways to provide it. But a recent Centers for Disease Control and Prevention (CDC) study shows some non-VA providers have some catching up to do.
Although the CDC researchers noted that electronic reminders can improve preventive and follow-up care, they also pointed out that HCPs must first have the computing capabilities to accomplish this. They analyzed 2017 data (the most recent available) from the National Electronic Health Records Survey of > 10,000 physicians and found only 65% of office-based physicians did.
Not surprisingly, practices that used electronic health record (EHR) systems were more than 3 times as likely to also have computerized capability to identify patients who needed preventive care or follow-up (71% vs 23% of practices without EHR). Primary care physicians were more likely than surgeons and other nonprimary care physicians to have the capability (73% vs 55% and 59%, respectively). Age also entered into it, with 70% of physicians aged between 45 and 54 years having the capability, compared with 57% of those aged 65 to 84 years. Offices with multiple physicians were more likely to have computerized capability.
The VA began using computerized clinical reminders 20 years ago to encourage patients to take better care of themselves to, for example, moderate alcohol use, manage cholesterol, or stop smoking. In 2006, the Veterans Health Information Systems and Technology Architecture (VistA) won an Innovations in American Government Award from Harvard University. The committee called VistA innovative because of its “unique linkage with standardized, consistent performance measurement.” VistA, the committee said, “substantially improves efficiency, reduces costs and demonstrably improves clinical decision-making.”
However, when the VA was getting its electronic reminder system up to speed, not all users were comfortable with it. Researchers who studied uptake of a system that sent reminders about lipid management to patients with ischemic heart disease found “substantial barriers” to implementation, including a possibly significant effect of “prior culture and attitudes” toward reminders.
Four years after the VA began using computerized reminders, attendees at “Camp CPRS,” a week-long meeting to train employees in the Computerized Patient Record System, were asked about facilitation and barriers. More than half of respondents could report at least 1 situation in which reminders helped them deliver care more effectively. But “[w]hile the potential benefits of such a system are significant,” the researchers said, “and in fact some VA hospitals are showing an increase in compliance with some best practices…it is generally understood that some providers within the VA do not use the clinical reminders.” Some HCPs said they were hard to use and cited insufficient training.
Experience and consistent use pay off, though. For instance, researchers from the VA Puget Sound Health Care System in Washington evaluated the effectiveness of an electronic clinical reminder for brief alcohol counseling at 8 VA sites. They wanted to determine how often the HCPs used the reminder, and whether it helped patients resolve unhealthy alcohol use. The study, involving 4,198 participants who screened positive for alcohol use, found 71% of the patients had the clinical reminder documented in the EHR—a high rate, the researchers noted, relative to other studies. The results were similar across the 2-year period, even in the first 8 months.
Sustainability also is a factor. At the time of their study, the researchers said, no health care system had achieved sustained implementation of brief alcohol counseling for patients who screened positive. Moreover, the patients who had reminders were significantly more likely to report having resolved unhealthy alcohol use at follow-up.
Do electronic daily reminders really improve adherence? Valentin Rivish, DNP, RN, NE-BC, telehealth specialist and facility e-consult coordinator with the Phoenix VA Health Care System in Arizona, wanted to see what evidence exists on telehealth adherence and utilization. He enlisted 40 veterans whose home-telehealth response rates were < 70%. Over 4 weeks, the veterans received an electronic daily reminder sent to their home-telehealth device, with the goal of having them respond daily.
As Rivish expected, daily reminders did improve adherence. After 4 weeks, 24 participants (60%) showed an increased response rate, and 14 (35%) achieved at least a 70% response rate pos-intervention. As a result, the Phoenix telehealth department has included the cost-effective intervention in its standard operating procedure.
The VA has continued to add to its repertoire of ways to stay in touch with patients. In 2018, for instance, it launched VEText, a text messaging appointment-reminder system. According to the Veterans Health Administration Office of Veterans Access to Care, in just the first few months more than 3.24 million patients had received VEText messages (and had canceled 319,504 appointments, freeing up time slots for other veterans).
This year, the VA, US Department of Defense, and US Coast Guard launched a joint health information exchange (HIE) that allows partners to quickly and securely share EHR data bidirectionally with participating community healthcare providers. To that end, the 46,000-member HIE is collaborating with the CommonWell Health Alliance, adding a nationwide network of more than 15,000 hospitals and clinics.
“As a clinician who is using the joint HIE, the more patient information I have access to, the more I can understand the full picture of my patients’ care and better meet their needs,” says Dr. Neil Evans, a VA primary care physician and clinical leader with the Federal Electronic Health Record Modernization office. “During the COVID-19 pandemic, efficient electronic health information is more important than ever.”
Guideline Concordance with Durvalumab in Unresectable Stage III Non-Small Cell Lung Cancer: A Single Center Veterans Hospital Experience
The US Food and Drug Administration (FDA) approved the use of durvalumab for patients with unresectable stage III non-small cell lung cancer (NSCLC) whose disease has not progressed following concurrent platinum-based chemotherapy and radiation therapy (CRT).1 After 2 randomized phase 3 studies in 2017 and 2018 showed significant progression-free and overall survival respectively,2,3 durvalumab became a category 1 recommendation for the above indication per National Comprehensive Cancer Network (NCCN) guidelines.4 Adherence to guidelines have been shown to improve patient survival across several cancer types.5-7 However, guideline adherence rates have been variable across health institutions. Therefore, further study is warranted to evaluate nonadherent practices with the goal of improving the quality of cancer care delivery.8,9
Stage III NSCLC is associated with poor survival rates.10 Concurrent CRT remains the standard of care in patients with good performance status based on clinical trial populations.4 Lung cancer remains a disease of the elderly, with a median age at diagnosis of 70 years.11 Discrepancies in the treatment of lung cancer in older adults can vary widely due to a lack of evidence surrounding the treatment in those who have comorbidities and poor performance status, widening the gap between clinical trial and real-world populations.11
A recent review by Passaro and colleagues revealed that at least 11 pivotal randomized controlled trials have shown the activity of immune checkpoint inhibitors (ICI) in locally advanced and metastatic lung cancer. However, these studies have mostly excluded patients with a performance status of the Eastern Cooperative Oncology Group (ECOG) level ≥ 2.11
Durvalumab is one of many new therapies to enter clinical practice to demonstrate survival benefit, but its use among veterans with stage III NSCLC in adherence with National Comprehensive Cancer Network (NCCN) guidelines was not robust at the Birmingham Veterans Affairs Medical Center (VAMC) in Alabama. Therefore, we decided to study the level of adherence and to identify barriers to conformity to the category 1 NCCN recommendations.
Methods
The Birmingham VAMC Outpatient Oncology Clinic billing data identified all individuals diagnosed with lung cancer treated between October 2017 and August 2019. Patients who did not have NSCLC that was stage III and unresectable were excluded from our study. Patients who did not receive a majority of their treatment at US Department of Veterans Affairs (VA) facilities were excluded as well. Each patient’s demographic, functional level, and tumor characteristics during the treatment planning phase and follow-up visits were obtained. Two investigators who evaluated health care provider documentation using the VA Computerized Patient Record System (CPRS) conducted chart reviews.
The primary outcomes were the proportion of patients who received concurrent CRT and the proportion who received durvalumab consolidation. Our chart review also categorized reasons for nonreceipt of concurrent CRT and subsequent durvalumab. Documented reasons for guideline discordancy were generated empirically and broadly. We noted if documentation was unclear and included reasons for why a veteran was not a candidate for CRT, the presence of toxicities associated with CRT, and a patient’s refusal for therapy despite medical advice. Descriptive data were analyzed for all clinical or demographic characteristics and outcomes.
This was considered an internal quality improvement initiative. As such, Birmingham VAMC did not require institutional review board approval for the study. The facility is accredited by the American College of Surgeons Commission on Cancer.
Results
A total of 41 veterans with stage III NSCLC were identified to have established care in the Birmingham VAMC Oncology Clinic between October 2017 and August 2019. Of these, 7 received the majority of their treatment from community-based non-VA facilities and 14 were not candidates for CRT and were excluded from this study.
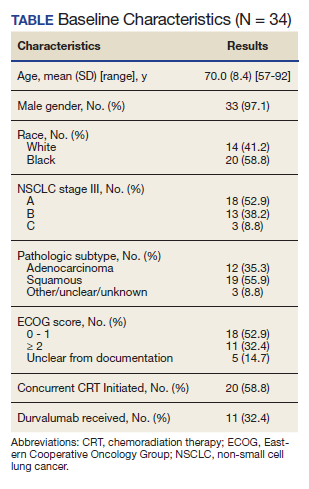
The mean (SD) age of study participants was 70.0 (8.4) years (range, 57 to 92 years). Most of the study veterans (33; 97.1%) were male and 20 (58.8%) were African American (Table). Eighteen (53%) of study participants had clinical stage IIIa NSCLC; 19 (56%) showed a squamous subtype of NSCLC. A majority (53%) of the veterans studied were evaluated to be functionally fit with an ECOG status of 0 to 1, although documentation of ECOG status was lacking in 5 (14.7%) patients in the initial treatment planning visit records. It was unclear if performance status had been reevaluated and changes noted over the course of concurrent CRT.
CRT Patients
The relative distribution of veterans who underwent CRT for stage III NSCLC plus the reasons they did not receive guideline-based treatment with durvalumab is shown in the Figure. Fourteen patients (41%) were inappropriate candidates for CRT; the most common reason for this was their poor performance status upon initial evaluation and 3 patients (8.8%) in the study had extensive disease or were upstaged upon follow-up clinic visit.
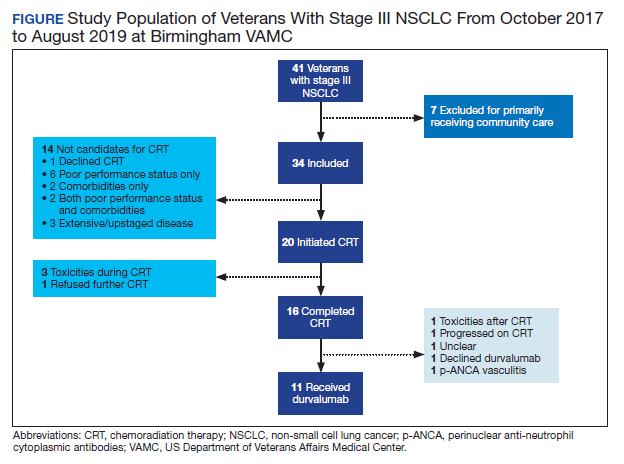
Twenty (59%) veterans in the study initiated CRT. However, only 16 (47.1%) completed CRT. Those who dropped out of CRT did so because of toxicities that included various cytopenia, gastrointestinal toxicities due to radiation and/or chemotherapy, or failure to thrive.
Durvalumab Treatment
After initiation of CRT, 9 (26.5%) patients did not go on to receive durvalumab. Three patients (8.8%) suffered toxicities during CRT. One study patient was found to have a severe respiratory infection requiring intensive care unit admission. Another study patient was found to have a new sternal lesion on follow-up positron emission tomography. One declined because of a history of severe antineutrophil cytoplasmic antibodies vasculitis, which made durvalumab use unsafe. Three patients (8.8%) declined treatment with CRT or durvalumab because of personal preference. Documentation was unclear as to why durvalumab was prescribed to one patient who had completed CRT.
Discussion
NCCN guidelines on the use of durvalumab in NSCLC are based on the phase 3 PACIFIC placebo-controlled randomized clinical trial. This trial, which included only patients with documented performance status of ECOG 0 or 1, reported that grade 3 or 4 events occurred in 30.5% of patients randomized to consolidative durvalumab. Treatment was discontinued in 15.4% of patients due to adverse events.3
Our study examined consolidation therapy with durvalumab in patients with unresectable stage III NSCLC with an ECOG performance status of 0 to 1 who had not progressed after 2 or more cycles of definitive concurrent CRT.4 Patients with previous exposure to immunotherapy, a history of immunodeficiency, active infection, unresolved toxicity from CRT, autoimmune disease, and patients who received sequential CRT were excluded.2 Surprisingly, the adherence rate to guidelines was close to 100% with appropriate documentation and justification of CRT initiation and durvalumab use. Five (14.7%) of veterans with unresectable stage III NSCLC did not have clear documentation of ECOG status on initial visit and only 1 veteran who completed CRT did not have clear documentation as to why durvalumab was not provided. Unfortunately, 23 (68.6%) veterans in the study were unable to receive durvalumab, a potentially disease-modifying drug; nearly one-third (10) of veterans were deemed poor candidates for concurrent CRT despite the fact that 52.9% (18) of veterans in the study had a documented ECOG of 0 or 1 on initial evaluation.
Clinical Trials vs Real World
The heterogeneity between anticipated study populations, those who were able to receive durvalumab in the PACIFIC trial, compared with our observed real-world veteran population, likely stems from the lack of information about how comorbidity and fitness can affect the choice of therapeutic intervention in patients with lung cancer.12 In addition, older adults who participated in randomized controlled trials (RCTs) are not representative of the average older adult who presents to medical oncology clinics, making the application of guideline concordant care difficult.13
Similar real-world observations parallel to our analyses have confirmed, complemented and/or refuted findings of RCTs, and have helped impact the treatment of multiple acute and chronic conditions including influenza, cardiovascular disease, and diabetes.14
A component of socioeconomic barriers and access to supportive care played roles in the decisions of certain patients who chose not to undergo concurrent CRT despite medical advice. These 2 obstacles also affected the decision making for some in the study when considering the use of durvalumab (administered by a 60-minute IV infusion every 2 weeks for 1 year) per recommended guidelines.1 These hurdles need further study in the context of their effect on quality of life and the difficulties generated by various social determinants of health.
Limitations
Study limitations included the biased and confounding factors previously described about retrospective and nonrandomized observational studies that are controlled for during RCTs.15 Electronic health record data may have been incorrectly collected resulting in missing or wrong data points that affect the validity of our conclusion. Recall bias with regard to documentation by health care providers describing reasons why CRT or durvalumab were not initiated or the patient’s ability to recall previous treatments and report ECOG status or toxicities also may have impacted our findings. Comorbidities and poor performance status, frequently occurring among veterans, negatively impact cancer treatment decisions and may result in a detection bias. For example, tobacco use, cardiovascular disease, including heart failure, and chronic obstructive pulmonary disease, are notoriously higher in the US veteran population when compared with civilian cohorts.16-18 Also, veterans with poorly controlled depression and posttraumatic stress disorder resulting in functional impairment are a factor.19 Steps were taken to address some of these biases by performing repeat checks of tabulated data and employing 2 independent reviewers to evaluate all relevant clinical documentation, compare results, and reach a consensus.
Conlcusions
This retrospective analysis of adherence to category 1 NCCN guidelines for durvalumab use among patients at the Birmingham VAMC Oncology Clinic reinforced our practice and identified minor deficiencies in documentation that would impact future clinical visits. More importantly, it depicted the massive disparity in treatment candidacy among Birmingham veterans compared with clinical trial populations. Efforts will be made to address factors impacting a veteran’s candidacy for CRT and explore other variables such as socioeconomic barriers to treatment. Multiple complementary tools to assess patients’ frailty, such as the Charlson Comorbidity Index (CCI), are now being used for a variety of disorders including cancers. More robust data and standardization are needed to validate the use of these assessments in predicting response to immune checkpoint inhibitors.
Immune checkpoint inhibitors are currently being evaluated in stage III NSCLC studies and may be implemented as routine practice in the future.12 It is important to distinguish fit from frail veterans with lung cancer for treatment selection. We would like to see the expansion of the eligibility criteria for clinical trials to include patients with a performance status of ECOG 2 in order for results to be truly generalizable to the real-world population. Our hope is that such work will improve not only the quality of lung cancer care, but also the quality of care across multiple tumor types.
1. US Food and Drug Administration. FDA approves durvalumab after chemoradiation for unresectable stage II. Published February 20, 2018. Accessed October 9, 2020. https://www.fda.gov/drugs/resources-information-approved-drugs/fda-approves-durvalumab-after-chemoradiation-unresectable-stage-iii-nsclc
2. Antonia SJ, Villegas A, Daniel D, et al. Durvalumab after chemoradiotherapy in stage III non-small-cell lung cancer. N Engl J Med. 2017;377(20):1919-1929. doi:10.1056/NEJMoa1709937
3. Antonia SJ, Villegas A, Daniel D, et al. Overall survival with durvalumab after chemoradiotherapy in stage III NSCLC. N Engl J Med. 2018;379(24):2342-2350. doi:10.1056/NEJMoa1809697
4. Ettinger DS, Wood DE, Aisner DL et al. NCCN clinical practice guidelines in oncology: non-small cell lung cancer. Version8.2020. Updated September 15, 2020. Accessed October 9, 2020. https://www.nccn.org/professionals/physician_gls/pdf/nscl.pdf
5. Bristow RE, Chang J, Ziogas A, Campos B, Chavez LR, Anton-Culver H. Impact of National Cancer Institute Comprehensive Cancer Centers on ovarian cancer treatment and survival. J Am Coll Surg. 2015;220(5):940-950. doi:10.1016/j.jamcollsurg.2015.01.056
6. Boland GM, Chang GJ, Haynes AB, et al. Association between adherence to National Comprehensive Cancer Network treatment guidelines and improved survival in patients with colon cancer. Cancer. 2013;119(8):1593-1601. doi:10.1002/cncr.27935
7. Schwentner L, Wöckel A, König J, et al. Adherence to treatment guidelines and survival in triple-negative breast cancer: a retrospective multi-center cohort study with 9,156 patients. BMC Cancer. 2013;13:487. Published 2013 Oct 21. doi:10.1186/1471-2407-13-487
8. Jazieh A, Alkaiyat MO, Ali Y, Hashim MA, Abdelhafiz N, Al Olayan A. Improving adherence to lung cancer guidelines: a quality improvement project that uses chart review, audit and feedback approach. BMJ Open Qual. 2019;8(3):e000436. Published 2019 Aug 26. doi:10.1136/bmjoq-2018-000436
9. Shaverdian N, Offin MD, Rimner A, et al. Utilization and factors precluding the initiation of consolidative durvalumab in unresectable stage III non-small cell lung cancer. Radiother Oncol. 2020;144:101-104. doi:10.1016/j.radonc.2019.11.015
10. National Cancer Institute. SEER cancer statistics review, 1975-2015, Table 15.1 cancer of the lung and bronchus. Accessed October 19, 2020 https://seer.cancer.gov/archive/csr/1975_2015/results_merged/sect_15_lung_bronchus.pdf. Updated September 10, 2018
11. Passaro A, Spitaleri G, Gyawali B, de Marinis F. Immunotherapy in non-small-cell lung cancer patients with performance status 2: clinical decision making with scant evidence. J Clin Oncol. 2019;37(22):1863-1867. doi:10.1200/JCO.18.02118
12. Driessen EJM, Janssen-Heijnen MLG, Maas HA, Dingemans AC, van Loon JGM. Study protocol of the NVALT25-ELDAPT trial: selecting the optimal treatment for older patients with stage III non-small-cell lung cancer. Clin Lung Cancer. 2018;19(6):e849-e852. doi:10.1016/j.cllc.2018.07.003
13. Schulkes KJ, Nguyen C, van den Bos F, van Elden LJ, Hamaker ME. Selection of Patients in Ongoing Clinical Trials on Lung Cancer. Lung. 2016;194(6):967-974. doi:10.1007/s00408-016-9943-7
14. Blonde L, Khunti K, Harris SB, Meizinger C, Skolnik NS. Interpretation and impact of real-world clinical data for the practicing clinician. Adv Ther. 2018;35(11):1763-1774. doi:10.1007/s12325-018-0805-y
15. Garrison LP Jr, Neumann PJ, Erickson P, Marshall D, Mullins CD. Using real-world data for coverage and payment decisions: the ISPOR Real-World Data Task Force report. Value Health. 2007;10(5):326-335. doi:10.1111/j.1524-4733.2007.00186.x
16. Assari S. Veterans and risk of heart disease in the United States: a cohort with 20 years of follow up. Int J Prev Med. 2014;5(6):703-709.
17. Shahoumian TA, Phillips BR, Backus LI. Cigarette smoking, reduction and quit attempts: prevalence among veterans with coronary heart disease. Prev Chronic Dis. 2016;13:E41. Published 2016 Mar 24. doi:10.5888/pcd13.150282
18. Murphy DE, Chaudhry Z, Almoosa KF, Panos RJ. High prevalence of chronic obstructive pulmonary disease among veterans in the urban midwest. Mil Med. 2011;176(5):552-560. doi:10.7205/milmed-d-10-00377
19. Kozel FA, Didehbani N, DeLaRosa B, et al. Factors impacting functional status in veterans of recent conflicts with PTSD. J Neuropsychiatry Clin Neurosci. 2016;28(2):112-117. doi:10.1176/appi.neuropsych.15070183
The US Food and Drug Administration (FDA) approved the use of durvalumab for patients with unresectable stage III non-small cell lung cancer (NSCLC) whose disease has not progressed following concurrent platinum-based chemotherapy and radiation therapy (CRT).1 After 2 randomized phase 3 studies in 2017 and 2018 showed significant progression-free and overall survival respectively,2,3 durvalumab became a category 1 recommendation for the above indication per National Comprehensive Cancer Network (NCCN) guidelines.4 Adherence to guidelines have been shown to improve patient survival across several cancer types.5-7 However, guideline adherence rates have been variable across health institutions. Therefore, further study is warranted to evaluate nonadherent practices with the goal of improving the quality of cancer care delivery.8,9
Stage III NSCLC is associated with poor survival rates.10 Concurrent CRT remains the standard of care in patients with good performance status based on clinical trial populations.4 Lung cancer remains a disease of the elderly, with a median age at diagnosis of 70 years.11 Discrepancies in the treatment of lung cancer in older adults can vary widely due to a lack of evidence surrounding the treatment in those who have comorbidities and poor performance status, widening the gap between clinical trial and real-world populations.11
A recent review by Passaro and colleagues revealed that at least 11 pivotal randomized controlled trials have shown the activity of immune checkpoint inhibitors (ICI) in locally advanced and metastatic lung cancer. However, these studies have mostly excluded patients with a performance status of the Eastern Cooperative Oncology Group (ECOG) level ≥ 2.11
Durvalumab is one of many new therapies to enter clinical practice to demonstrate survival benefit, but its use among veterans with stage III NSCLC in adherence with National Comprehensive Cancer Network (NCCN) guidelines was not robust at the Birmingham Veterans Affairs Medical Center (VAMC) in Alabama. Therefore, we decided to study the level of adherence and to identify barriers to conformity to the category 1 NCCN recommendations.
Methods
The Birmingham VAMC Outpatient Oncology Clinic billing data identified all individuals diagnosed with lung cancer treated between October 2017 and August 2019. Patients who did not have NSCLC that was stage III and unresectable were excluded from our study. Patients who did not receive a majority of their treatment at US Department of Veterans Affairs (VA) facilities were excluded as well. Each patient’s demographic, functional level, and tumor characteristics during the treatment planning phase and follow-up visits were obtained. Two investigators who evaluated health care provider documentation using the VA Computerized Patient Record System (CPRS) conducted chart reviews.
The primary outcomes were the proportion of patients who received concurrent CRT and the proportion who received durvalumab consolidation. Our chart review also categorized reasons for nonreceipt of concurrent CRT and subsequent durvalumab. Documented reasons for guideline discordancy were generated empirically and broadly. We noted if documentation was unclear and included reasons for why a veteran was not a candidate for CRT, the presence of toxicities associated with CRT, and a patient’s refusal for therapy despite medical advice. Descriptive data were analyzed for all clinical or demographic characteristics and outcomes.
This was considered an internal quality improvement initiative. As such, Birmingham VAMC did not require institutional review board approval for the study. The facility is accredited by the American College of Surgeons Commission on Cancer.
Results
A total of 41 veterans with stage III NSCLC were identified to have established care in the Birmingham VAMC Oncology Clinic between October 2017 and August 2019. Of these, 7 received the majority of their treatment from community-based non-VA facilities and 14 were not candidates for CRT and were excluded from this study.
The mean (SD) age of study participants was 70.0 (8.4) years (range, 57 to 92 years). Most of the study veterans (33; 97.1%) were male and 20 (58.8%) were African American (Table). Eighteen (53%) of study participants had clinical stage IIIa NSCLC; 19 (56%) showed a squamous subtype of NSCLC. A majority (53%) of the veterans studied were evaluated to be functionally fit with an ECOG status of 0 to 1, although documentation of ECOG status was lacking in 5 (14.7%) patients in the initial treatment planning visit records. It was unclear if performance status had been reevaluated and changes noted over the course of concurrent CRT.
CRT Patients
The relative distribution of veterans who underwent CRT for stage III NSCLC plus the reasons they did not receive guideline-based treatment with durvalumab is shown in the Figure. Fourteen patients (41%) were inappropriate candidates for CRT; the most common reason for this was their poor performance status upon initial evaluation and 3 patients (8.8%) in the study had extensive disease or were upstaged upon follow-up clinic visit.
Twenty (59%) veterans in the study initiated CRT. However, only 16 (47.1%) completed CRT. Those who dropped out of CRT did so because of toxicities that included various cytopenia, gastrointestinal toxicities due to radiation and/or chemotherapy, or failure to thrive.
Durvalumab Treatment
After initiation of CRT, 9 (26.5%) patients did not go on to receive durvalumab. Three patients (8.8%) suffered toxicities during CRT. One study patient was found to have a severe respiratory infection requiring intensive care unit admission. Another study patient was found to have a new sternal lesion on follow-up positron emission tomography. One declined because of a history of severe antineutrophil cytoplasmic antibodies vasculitis, which made durvalumab use unsafe. Three patients (8.8%) declined treatment with CRT or durvalumab because of personal preference. Documentation was unclear as to why durvalumab was prescribed to one patient who had completed CRT.
Discussion
NCCN guidelines on the use of durvalumab in NSCLC are based on the phase 3 PACIFIC placebo-controlled randomized clinical trial. This trial, which included only patients with documented performance status of ECOG 0 or 1, reported that grade 3 or 4 events occurred in 30.5% of patients randomized to consolidative durvalumab. Treatment was discontinued in 15.4% of patients due to adverse events.3
Our study examined consolidation therapy with durvalumab in patients with unresectable stage III NSCLC with an ECOG performance status of 0 to 1 who had not progressed after 2 or more cycles of definitive concurrent CRT.4 Patients with previous exposure to immunotherapy, a history of immunodeficiency, active infection, unresolved toxicity from CRT, autoimmune disease, and patients who received sequential CRT were excluded.2 Surprisingly, the adherence rate to guidelines was close to 100% with appropriate documentation and justification of CRT initiation and durvalumab use. Five (14.7%) of veterans with unresectable stage III NSCLC did not have clear documentation of ECOG status on initial visit and only 1 veteran who completed CRT did not have clear documentation as to why durvalumab was not provided. Unfortunately, 23 (68.6%) veterans in the study were unable to receive durvalumab, a potentially disease-modifying drug; nearly one-third (10) of veterans were deemed poor candidates for concurrent CRT despite the fact that 52.9% (18) of veterans in the study had a documented ECOG of 0 or 1 on initial evaluation.
Clinical Trials vs Real World
The heterogeneity between anticipated study populations, those who were able to receive durvalumab in the PACIFIC trial, compared with our observed real-world veteran population, likely stems from the lack of information about how comorbidity and fitness can affect the choice of therapeutic intervention in patients with lung cancer.12 In addition, older adults who participated in randomized controlled trials (RCTs) are not representative of the average older adult who presents to medical oncology clinics, making the application of guideline concordant care difficult.13
Similar real-world observations parallel to our analyses have confirmed, complemented and/or refuted findings of RCTs, and have helped impact the treatment of multiple acute and chronic conditions including influenza, cardiovascular disease, and diabetes.14
A component of socioeconomic barriers and access to supportive care played roles in the decisions of certain patients who chose not to undergo concurrent CRT despite medical advice. These 2 obstacles also affected the decision making for some in the study when considering the use of durvalumab (administered by a 60-minute IV infusion every 2 weeks for 1 year) per recommended guidelines.1 These hurdles need further study in the context of their effect on quality of life and the difficulties generated by various social determinants of health.
Limitations
Study limitations included the biased and confounding factors previously described about retrospective and nonrandomized observational studies that are controlled for during RCTs.15 Electronic health record data may have been incorrectly collected resulting in missing or wrong data points that affect the validity of our conclusion. Recall bias with regard to documentation by health care providers describing reasons why CRT or durvalumab were not initiated or the patient’s ability to recall previous treatments and report ECOG status or toxicities also may have impacted our findings. Comorbidities and poor performance status, frequently occurring among veterans, negatively impact cancer treatment decisions and may result in a detection bias. For example, tobacco use, cardiovascular disease, including heart failure, and chronic obstructive pulmonary disease, are notoriously higher in the US veteran population when compared with civilian cohorts.16-18 Also, veterans with poorly controlled depression and posttraumatic stress disorder resulting in functional impairment are a factor.19 Steps were taken to address some of these biases by performing repeat checks of tabulated data and employing 2 independent reviewers to evaluate all relevant clinical documentation, compare results, and reach a consensus.
Conlcusions
This retrospective analysis of adherence to category 1 NCCN guidelines for durvalumab use among patients at the Birmingham VAMC Oncology Clinic reinforced our practice and identified minor deficiencies in documentation that would impact future clinical visits. More importantly, it depicted the massive disparity in treatment candidacy among Birmingham veterans compared with clinical trial populations. Efforts will be made to address factors impacting a veteran’s candidacy for CRT and explore other variables such as socioeconomic barriers to treatment. Multiple complementary tools to assess patients’ frailty, such as the Charlson Comorbidity Index (CCI), are now being used for a variety of disorders including cancers. More robust data and standardization are needed to validate the use of these assessments in predicting response to immune checkpoint inhibitors.
Immune checkpoint inhibitors are currently being evaluated in stage III NSCLC studies and may be implemented as routine practice in the future.12 It is important to distinguish fit from frail veterans with lung cancer for treatment selection. We would like to see the expansion of the eligibility criteria for clinical trials to include patients with a performance status of ECOG 2 in order for results to be truly generalizable to the real-world population. Our hope is that such work will improve not only the quality of lung cancer care, but also the quality of care across multiple tumor types.
1. US Food and Drug Administration. FDA approves durvalumab after chemoradiation for unresectable stage II. Published February 20, 2018. Accessed October 9, 2020. https://www.fda.gov/drugs/resources-information-approved-drugs/fda-approves-durvalumab-after-chemoradiation-unresectable-stage-iii-nsclc
2. Antonia SJ, Villegas A, Daniel D, et al. Durvalumab after chemoradiotherapy in stage III non-small-cell lung cancer. N Engl J Med. 2017;377(20):1919-1929. doi:10.1056/NEJMoa1709937
3. Antonia SJ, Villegas A, Daniel D, et al. Overall survival with durvalumab after chemoradiotherapy in stage III NSCLC. N Engl J Med. 2018;379(24):2342-2350. doi:10.1056/NEJMoa1809697
4. Ettinger DS, Wood DE, Aisner DL et al. NCCN clinical practice guidelines in oncology: non-small cell lung cancer. Version8.2020. Updated September 15, 2020. Accessed October 9, 2020. https://www.nccn.org/professionals/physician_gls/pdf/nscl.pdf
5. Bristow RE, Chang J, Ziogas A, Campos B, Chavez LR, Anton-Culver H. Impact of National Cancer Institute Comprehensive Cancer Centers on ovarian cancer treatment and survival. J Am Coll Surg. 2015;220(5):940-950. doi:10.1016/j.jamcollsurg.2015.01.056
6. Boland GM, Chang GJ, Haynes AB, et al. Association between adherence to National Comprehensive Cancer Network treatment guidelines and improved survival in patients with colon cancer. Cancer. 2013;119(8):1593-1601. doi:10.1002/cncr.27935
7. Schwentner L, Wöckel A, König J, et al. Adherence to treatment guidelines and survival in triple-negative breast cancer: a retrospective multi-center cohort study with 9,156 patients. BMC Cancer. 2013;13:487. Published 2013 Oct 21. doi:10.1186/1471-2407-13-487
8. Jazieh A, Alkaiyat MO, Ali Y, Hashim MA, Abdelhafiz N, Al Olayan A. Improving adherence to lung cancer guidelines: a quality improvement project that uses chart review, audit and feedback approach. BMJ Open Qual. 2019;8(3):e000436. Published 2019 Aug 26. doi:10.1136/bmjoq-2018-000436
9. Shaverdian N, Offin MD, Rimner A, et al. Utilization and factors precluding the initiation of consolidative durvalumab in unresectable stage III non-small cell lung cancer. Radiother Oncol. 2020;144:101-104. doi:10.1016/j.radonc.2019.11.015
10. National Cancer Institute. SEER cancer statistics review, 1975-2015, Table 15.1 cancer of the lung and bronchus. Accessed October 19, 2020 https://seer.cancer.gov/archive/csr/1975_2015/results_merged/sect_15_lung_bronchus.pdf. Updated September 10, 2018
11. Passaro A, Spitaleri G, Gyawali B, de Marinis F. Immunotherapy in non-small-cell lung cancer patients with performance status 2: clinical decision making with scant evidence. J Clin Oncol. 2019;37(22):1863-1867. doi:10.1200/JCO.18.02118
12. Driessen EJM, Janssen-Heijnen MLG, Maas HA, Dingemans AC, van Loon JGM. Study protocol of the NVALT25-ELDAPT trial: selecting the optimal treatment for older patients with stage III non-small-cell lung cancer. Clin Lung Cancer. 2018;19(6):e849-e852. doi:10.1016/j.cllc.2018.07.003
13. Schulkes KJ, Nguyen C, van den Bos F, van Elden LJ, Hamaker ME. Selection of Patients in Ongoing Clinical Trials on Lung Cancer. Lung. 2016;194(6):967-974. doi:10.1007/s00408-016-9943-7
14. Blonde L, Khunti K, Harris SB, Meizinger C, Skolnik NS. Interpretation and impact of real-world clinical data for the practicing clinician. Adv Ther. 2018;35(11):1763-1774. doi:10.1007/s12325-018-0805-y
15. Garrison LP Jr, Neumann PJ, Erickson P, Marshall D, Mullins CD. Using real-world data for coverage and payment decisions: the ISPOR Real-World Data Task Force report. Value Health. 2007;10(5):326-335. doi:10.1111/j.1524-4733.2007.00186.x
16. Assari S. Veterans and risk of heart disease in the United States: a cohort with 20 years of follow up. Int J Prev Med. 2014;5(6):703-709.
17. Shahoumian TA, Phillips BR, Backus LI. Cigarette smoking, reduction and quit attempts: prevalence among veterans with coronary heart disease. Prev Chronic Dis. 2016;13:E41. Published 2016 Mar 24. doi:10.5888/pcd13.150282
18. Murphy DE, Chaudhry Z, Almoosa KF, Panos RJ. High prevalence of chronic obstructive pulmonary disease among veterans in the urban midwest. Mil Med. 2011;176(5):552-560. doi:10.7205/milmed-d-10-00377
19. Kozel FA, Didehbani N, DeLaRosa B, et al. Factors impacting functional status in veterans of recent conflicts with PTSD. J Neuropsychiatry Clin Neurosci. 2016;28(2):112-117. doi:10.1176/appi.neuropsych.15070183
FIT unfit for inpatient, emergency settings
Most fecal immunochemical tests (FIT) in the hospital setting or the ED are performed for inappropriate indications, according to new data.
“This is the largest study that focuses exclusively on the use of FIT in the ED, inpatient wards, and in the ICU, and it shows significant misuse,” said investigator Umer Bhatti, MD, from Indiana University, Indianapolis.
The only “validated indication” for FIT is to screen for colorectal cancer. However, “99.5% of the FIT tests done in our study were for inappropriate indications,” he reported at the annual meeting of the American College of Gastroenterology, where the study was honored with an ACG Presidential Poster Award.
And the inappropriate use of FIT in these settings had no positive effect on clinical decision-making, he added.
For their study, Dr. Bhatti and colleagues looked at all instances of FIT use in their hospital’s electronic medical records from November 2017 to October 2019 to assess how often FIT was being used, the indications for which it was being used, and the impact of its use on clinical care.
They identified 550 patients, 48% of whom were women, who underwent at least one FIT test. Mean age of the study cohort was 54 years. Only three of the tests, or 0.5%, were performed to screen for colorectal cancer (95% confidence interval, 0.09%-1.52%).
Among the indications documented for FIT were anemia in 242 (44.0%) patients, suspected GI bleeding in 225 (40.9%), abdominal pain in 31 (5.6%), and change in bowel habits in 19 (3.5%).
The tests were performed most often in the ED (45.3%) and on the hospital floor (42.2%), but were also performed in the ICU (10.5%) and burn unit (2.0%).
Overall, 297 of the tests, or 54%, were negative, and 253, or 46%, were positive.
“GI consults were obtained in 46.2% of the FIT-positive group, compared with 13.1% of the FIT-negative patients” (odds ratio, 5.93; 95% CI, 3.88-9.04, P < .0001), Dr. Bhatti reported.
Among FIT-positive patients, those with overt bleeding were more likely to receive a GI consultation than those without (OR, 3.3; 95% CI, 1.9-5.5; P < .0001).
Of the 117 FIT-positive patients who underwent a GI consultation, upper endoscopy was a more common outcome than colonoscopy (51.3% vs. 23.1%; P < .0001). Of the 34 patients who underwent colonoscopy or sigmoidoscopy, one was diagnosed with colorectal cancer and one with advanced adenoma.
Overt GI bleeding was a better predictor of a GI consultation than a positive FIT result. In fact, use of FIT for patients with overt GI bleeding indicates a poor understanding of the test’s utility, the investigators reported.
“For patients with overt GI bleeding, having a positive FIT made no difference on how often a bleeding source was identified on endoscopy, suggesting that FIT should not be used to guide decisions about endoscopy or hospitalization,” Dr. Bhatti said.
In light of these findings, the team urges their peers to consider measures to reduce FIT tests for unnecessary indications.
“We feel that FIT is unfit for use in the inpatient and emergency settings, and measures should be taken to curb its use,” Dr. Bhatti concluded. “We presented our data to our hospital leadership and a decision was made to remove the FIT as an orderable test from the EMR.”
These results are “striking,” said Jennifer Christie, MD, from the University, Atlanta.
“We should be educating our ER providers and inpatient providers about the proper use of FIT,” she said in an interview. “Another option – and this has been done in many settings with the fecal occult blood test – is just take FIT off the units or out of the ER, so providers won’t be tempted to use it as an assessment of these patients. Because often times, as this study showed, it doesn’t really impact outcomes.”
In fact, unnecessary FI testing could put patients at risk for unnecessary procedures. “We also know that calling for an inpatient or ER consult from a gastroenterologist may increase both length of stay and costs,” she added.
Dr. Bhatti and Dr. Christie disclosed no relevant financial relationships.
A version of this article originally appeared on Medscape.com.
Leadership & Professional Development: Fighting Reputational Inertia
“Becoming is better than being.”
—Carol Dweck
The words spoken about her in the staff meeting were flattering. She’d just been acknowledged with a departmental teaching award for the second year in a row. With only 3 years under her belt since completing training, the former chief resident was living up to all they’d anticipated.
Eager students requested to be on her team and colleagues delighted in sharing patients with her. “Great, as always,” her peers and learners said in hallways and evaluations. This would come to define her identity.
Things were going well. She was succeeding. But she began to wonder if this reciprocating engine of accolades represented who she truly was. Was she really that good? Was she an imposter? In her performance meetings, the feedback never wavered: “Great, as always.”
The following year she would leave for a different job.
THE THREAT OF REPUTATIONAL INERTIA
While specific plans for growth and improvement often get laid out for struggling colleagues and learners, far less effort is devoted to coaching high performers. Feedback that consists of nonspecific compliments may hinder potential, growth, and job satisfaction. We outline strategies for preventing this professional plateau in those you lead.
ENCOURAGE A GROWTH MINDSET
In Mindset: The New Psychology of Success, psychologist Carol Dweck describes how emphasis on qualities such as “being smart” or, in this example, “great,” underscores this “fixed mindset” that certain attributes are set in stone.1 Conversely, she defines the “growth mindset” as a belief that potential can be cultivated through efforts. Even when there aren’t obvious issues with performance, the failure, fine-tuning, and feedback necessary for resilience and, ultimately, sustained growth require intention.
Emphasize Effort
Instead of lauding an individual for being “great, as always,” consider focusing on the effort it required to get there. For example, regarding the aforementioned junior colleague who’d just won awards, a typical compliment might be: “Wow, you’re on fire!” An option, to promote a growth mindset, might be: “You work very hard at bedside teaching and innovative curriculum development. I’m happy to see that our learners and department have recognized your commitment and effort.” This language also affirms others and makes achievements seem attainable to all.
Provide Active Coaching
Identifying specific opportunities for development can challenge individuals to expand their skills. Even those who are doing well have room to become even better. Coproduction of new milestones that push beyond current comfort zones can acknowledge current achievements while encouraging continued growth—and make things personal. For example, encouraging an individual to apply to a national faculty development program, such as the Society of Hospital Medicine’s Academic Hospitalist Academy, could help them expand their skills and social network.
Offer Meaningful Feedback
Prioritizing feedback is essential for growth and peak performance. This can be particularly powerful when the observer moves beyond basic expectations to incorporate personal goals. Concrete feedback measured against individual potential then takes the place of nondescript compliments. For example, you could say: “Your teaching on systolic ejection murmurs was on target for the students. Next time I want to challenge you to broaden your teaching script to include points appropriate for more seasoned learners.” This feedback leaves them with a set of tailored “marching orders” to guide practice and improvement.
CONCLUSION
No matter where a person stands on the spectrum of performance, growth in medicine relies on deliberate practice, active coaching, meaningful feedback, and graduated opportunities. Even the most proficient among us can stagnate without these things. If we aren’t careful, this reputational inertia could amplify imposter syndrome, prevent individuals from achieving their full potential, and threaten faculty retention. Intentional work toward a growth mindset allows everyone to grow—and be seen.
Disclosures
The authors have nothing to disclose.
1. Dweck CS. Mindset: The New Psychology of Success. New York: Ballantine Books; 2008.
“Becoming is better than being.”
—Carol Dweck
The words spoken about her in the staff meeting were flattering. She’d just been acknowledged with a departmental teaching award for the second year in a row. With only 3 years under her belt since completing training, the former chief resident was living up to all they’d anticipated.
Eager students requested to be on her team and colleagues delighted in sharing patients with her. “Great, as always,” her peers and learners said in hallways and evaluations. This would come to define her identity.
Things were going well. She was succeeding. But she began to wonder if this reciprocating engine of accolades represented who she truly was. Was she really that good? Was she an imposter? In her performance meetings, the feedback never wavered: “Great, as always.”
The following year she would leave for a different job.
THE THREAT OF REPUTATIONAL INERTIA
While specific plans for growth and improvement often get laid out for struggling colleagues and learners, far less effort is devoted to coaching high performers. Feedback that consists of nonspecific compliments may hinder potential, growth, and job satisfaction. We outline strategies for preventing this professional plateau in those you lead.
ENCOURAGE A GROWTH MINDSET
In Mindset: The New Psychology of Success, psychologist Carol Dweck describes how emphasis on qualities such as “being smart” or, in this example, “great,” underscores this “fixed mindset” that certain attributes are set in stone.1 Conversely, she defines the “growth mindset” as a belief that potential can be cultivated through efforts. Even when there aren’t obvious issues with performance, the failure, fine-tuning, and feedback necessary for resilience and, ultimately, sustained growth require intention.
Emphasize Effort
Instead of lauding an individual for being “great, as always,” consider focusing on the effort it required to get there. For example, regarding the aforementioned junior colleague who’d just won awards, a typical compliment might be: “Wow, you’re on fire!” An option, to promote a growth mindset, might be: “You work very hard at bedside teaching and innovative curriculum development. I’m happy to see that our learners and department have recognized your commitment and effort.” This language also affirms others and makes achievements seem attainable to all.
Provide Active Coaching
Identifying specific opportunities for development can challenge individuals to expand their skills. Even those who are doing well have room to become even better. Coproduction of new milestones that push beyond current comfort zones can acknowledge current achievements while encouraging continued growth—and make things personal. For example, encouraging an individual to apply to a national faculty development program, such as the Society of Hospital Medicine’s Academic Hospitalist Academy, could help them expand their skills and social network.
Offer Meaningful Feedback
Prioritizing feedback is essential for growth and peak performance. This can be particularly powerful when the observer moves beyond basic expectations to incorporate personal goals. Concrete feedback measured against individual potential then takes the place of nondescript compliments. For example, you could say: “Your teaching on systolic ejection murmurs was on target for the students. Next time I want to challenge you to broaden your teaching script to include points appropriate for more seasoned learners.” This feedback leaves them with a set of tailored “marching orders” to guide practice and improvement.
CONCLUSION
No matter where a person stands on the spectrum of performance, growth in medicine relies on deliberate practice, active coaching, meaningful feedback, and graduated opportunities. Even the most proficient among us can stagnate without these things. If we aren’t careful, this reputational inertia could amplify imposter syndrome, prevent individuals from achieving their full potential, and threaten faculty retention. Intentional work toward a growth mindset allows everyone to grow—and be seen.
Disclosures
The authors have nothing to disclose.
1. Dweck CS. Mindset: The New Psychology of Success. New York: Ballantine Books; 2008.
1. Dweck CS. Mindset: The New Psychology of Success. New York: Ballantine Books; 2008.
© 2020 Society of Hospital Medicine
Trends in COVID-19 Risk-Adjusted Mortality Rates
Early reports showed high mortality from coronavirus disease 2019 (COVID-19), while current United States data mortality rates are lower, raising hope that new treatments and management strategies have improved outcomes. For instance, Centers for Disease Control and Prevention data show that 6.7% of cases resulted in death in April, compared with 1.9% in September.1 However, the demographics of those infected have also changed, and more available testing may mean more comprehensive identification and earlier treatment. Nationally, for instance, the median age of confirmed cases was 38 years at the end of August, down from 46 years at the start of May.2 Therefore, whether decreasing COVID-19 mortality rates simply reflect changing demographics or represent actual improvements in clinical care is unknown. The objective of this analysis was to assess outcomes over time in a single health system, accounting for changes in demographics, clinical factors, and severity of disease at presentation.
METHODS
We analyzed monthly mortality rates for admissions between March 1 and August 31, 2020, in a single health system in New York City. Outcomes were obtained as of October 8, 2020. We included all hospitalizations of people 18 years and older with laboratory-confirmed severe acute respiratory syndrome coronavirus 2 (SARS-CoV-2) infection identified during the hospitalization or in the prior 2 weeks, excluding those admitted to hospice care. Patients with multiple hospitalizations (N=208 patients, 229 hospitalizations, 4.4%) were included repeatedly if they continued to have laboratory-confirmed disease. Patients without admission vital signs (N=28) were excluded. Mortality was defined as in-hospital death or discharge to hospice care. In-house laboratory testing began March 16 and all inpatients were tested for SARS-CoV-2 by April 1; elective surgeries resumed May 4-11 and were only conducted on confirmed SARS-CoV-2–negative patients.
All data were obtained from the electronic health record (Epic Systems, Verona, Wisconsin). Diagnosis codes were obtained from the problem list, past medical history, and billing codes. In addition, we used objective data such as hemoglobin A1c, ejection fraction, outpatient creatinine, and outpatient blood pressure to augment problem list diagnoses where relevant.
Based on prior literature, we constructed multivariable logistic regression models for mortality adjusting for age; sex; self-reported race and ethnicity; body mass index; smoking history; presence of hypertension, heart failure, hyperlipidemia, coronary artery disease, diabetes, cancer, chronic kidney disease, dementia, or pulmonary disease individually as dummy variables; and admission oxygen saturation, D-dimer, ferritin, and C-reactive protein.3-6 In the first model (C statistic 0.82), we did not include month of admission as a covariate and calculated the ratio of the sum of observed and expected deaths (obtained from the model) in each month to obtain the standardized mortality ratio (SMR) for each month. We then multiplied each period’s SMR by the overall average crude mortality to generate monthly adjusted mortality rates. We calculated Poisson control limits and indicated points outside the control limits as significantly different.
In a second model (C statistic 0.84), we included month as a covariate and calculated average marginal effects (AME) for each time period by using the margins library in R,7 which uses a discrete first-difference in predicted outcomes to obtain the AME. The average marginal effect represents the percentage point difference between the reference period (March) and a subsequent time period in probability of death or discharge to hospice, for equivalent patients. We obtained lower and upper confidence intervals for the AME using a bootstrapping approach described in Green.8 Finally, we conducted two sensitivity analyses: one, restricting the analysis to only those patients with principal diagnosis of COVID-19, sepsis, or respiratory disease (see Appendix A for complete list of codes) and one restricting the analysis to only those with length of stay of at least 3 days.
All statistical analyses were conducted with R, version 4.0.2. All analyses used 2-sided statistical tests, and we considered a P value < .05 to be statistically significant without adjustment for multiple testing. The NYU institutional review board approved the study and granted a waiver of consent and a waiver of the Health Information Portability and Accountability Act.
RESULTS
We included 5,121 hospitalizations, of which 5,118 (99.94%) had known outcomes (death or hospital discharge). Peak hospitalizations occurred in late March to mid-April, which accounted for 53% of the hospitalizations. Median length of stay for patients who died or were discharged to hospice was 8 days (interquartile range, 4-15; max 140 days). The median age and the proportion male or with any comorbidity decreased over time (Table). For instance, the proportion with any chronic condition decreased from 81% in March to 72% in August.

Adjusted mortality dropped each month, from 25.6% in March to 7.6% in August (Table and Figure). The SMR declined progressively over time, from 1.26 (95% CI, 1.15-1.39) in March to 0.38 (95% CI, 0.12-0.88) in August (Table). The adjusted average marginal effect was also significantly lower than in March in every subsequent month, reaching a maximum of an average 18.2 (95% CI, 12.0-24.4) percentage point decrease in probability of death in August, accounting for changes in demographics and clinical severity (Table and Appendix B). The decrease in unadjusted mortality over time was observed across age groups (Appendix C).

Results of the two sensitivity analyses were similar (Appendices D and E), though attenuated in the case of the sepsis/respiratory cohort, with adjusted mortality falling from 31.4% to 14.4%, SMR decreasing from 1.28 (95% CI, 1.16-1.41) to 0.59 (95% CI, 0.16-1.50), and AME in August 17.0 percentage points (95% CI, 6.0-28.1).
DISCUSSION
In this study of COVID-19 mortality over 6 months at a single health system, we found that changes in demographics and severity of illness at presentation did not fully explain decreases in mortality seen over time. Even after risk adjustment for a variety of clinical and demographic factors, including severity of illness at presentation, mortality was significantly and progressively lower over the course of the study period.
Similar risk-adjusted results have been preliminarily reported among intensive care unit patients in a preprint from the United Kingdom.9 Incremental improvements in outcomes are likely a combination of increasing clinical experience, decreasing hospital volume, growing use of new pharmacologic treatments (such as systemic corticosteroids,10 remdesivir,11 and anticytokine treatments), nonpharmacologic treatments (such as placing the patient in the prone position, or proning, rather than on their back), earlier intervention, community awareness, and, potentially, lower viral load exposure from increased mask wearing and social distancing.12
Strengths of this study include highly detailed electronic health record data on hospitalizations at three different hospitals, a diverse patient population,6 near-complete study outcomes, and a lengthy period of investigation of 6 months. However, this study does have limitations. All patients were from a single geographic region and treated within a single health system, though restricting data to one system reduces institution-level variability and allows us to assess how care may have evolved with growing experience. Aggregating data from numerous health systems that might be at different stages of local outbreaks, provide different quality of care, and contribute different numbers of patients in each period introduces its own biases. We were also unable to disentangle different potential explanatory factors given the observational nature of the study. Residual confounding, such as a higher proportion of particularly frail patients admitted in earlier periods, is also a possibility, though the fact that we observed declines across all age groups mitigates this concern. Thresholds for hospital admission may also have changed over time with less severely ill patients being admitted in the later time periods. While changing admission thresholds could have contributed to higher survival rates in the latter portions of the study, our inclusion of several highly predictive clinical and laboratory results likely captured many aspects of disease severity.
CONCLUSION
In summary, data from one health system suggest that COVID-19 remains a serious disease for high-risk patients, but that mortality rates are improving over time.
1. CDC COVID Data Tracker. 2020. Centers for Disease Control and Prevention. Accessed October 14, 2020. https://covid.cdc.gov/covid-data-tracker/#trends_dailytrendscases
2. Boehmer TK, DeVies J, Caruso E, et al. Changing age distribution of the COVID-19 pandemic - United States, May-August 2020. MMWR Morb Mortal Wkly Rep. 2020;69(39):1404-1409 http://dx.doi.org/0.15585/mmwr.mm6939e1
3. Lu L, Zhong W, Bian Z, et al. A comparison of mortality-related risk factors of COVID-19, SARS, and MERS: A systematic review and meta-analysis. J Infect. 2020;81(4):318-e25. https://doi.org/10.1016/j.jinf.2020.07.002
4. Parohan M, Yaghoubi S, Seraji A, Javanbakht MH, Sarraf P, Djalali M. Risk factors for mortality in patients with coronavirus disease 2019 (COVID-19) infection: a systematic review and meta-analysis of observational studies. Aging Male. 2020;Jun8:1-9. https://doi.org/10.1080/13685538.2020.1774748
5. Zheng Z, Peng F, Xu B, et al. Risk factors of critical & mortal COVID-19 cases: a systematic literature review and meta-analysis. J Infect. 2020;81(2):e16-e25. https://doi.org/10.1016/j.jinf.2020.04.021
6. Petrilli CM, Jones SA, Yang J, et al. Factors associated with hospital admission and critical illness among 5279 people with coronavirus disease 2019 in New York City: prospective cohort study. BMJ. 2020;369:m1966. https://doi.org/10.1136/bmj.m1966
7. margins: Marginal Effects for Model Objects [computer program]. Version R package version 0.3.232018. Accessed October 1, 2020. https://rdrr.io/cran/margins/
8. Greene WH. Econometric Analysis. 7th ed. Pearson; 2012.
9. Doidge JC, Mouncey PR, Thomas K, et al. Trends in intensive care for patients with COVID-19 in England, Wales and Northern Ireland. Preprints 2020. Preprint posted online August 11, 2020. https://doi.org/10.20944/preprints202008.0267.v1
10. Recovery Collaborative Group, Horby P, Lim WS, et al. Dexamethasone in hospitalized patients with Covid-19 - preliminary report. N Engl J Med. 2020. Online first July 17, 2020. https://doi.org/10.1056/NEJMoa2021436
11. Beigel JH, Tomashek KM, Dodd LE, et al. Remdesivir for the treatment of Covid-19 – final report. N Enl J Med. 2020. Online first October 8, 2020. https://doi.org/10.1056/NEJMoa2007764
12. Gandhi M, Rutherford GW. Facial masking for Covid-19 - potential for “variolation” as we await a vaccine. N Engl J Med. 2020. Online first September 8, 2020. https://doi.org/10.1056/NEJMp2026913
Early reports showed high mortality from coronavirus disease 2019 (COVID-19), while current United States data mortality rates are lower, raising hope that new treatments and management strategies have improved outcomes. For instance, Centers for Disease Control and Prevention data show that 6.7% of cases resulted in death in April, compared with 1.9% in September.1 However, the demographics of those infected have also changed, and more available testing may mean more comprehensive identification and earlier treatment. Nationally, for instance, the median age of confirmed cases was 38 years at the end of August, down from 46 years at the start of May.2 Therefore, whether decreasing COVID-19 mortality rates simply reflect changing demographics or represent actual improvements in clinical care is unknown. The objective of this analysis was to assess outcomes over time in a single health system, accounting for changes in demographics, clinical factors, and severity of disease at presentation.
METHODS
We analyzed monthly mortality rates for admissions between March 1 and August 31, 2020, in a single health system in New York City. Outcomes were obtained as of October 8, 2020. We included all hospitalizations of people 18 years and older with laboratory-confirmed severe acute respiratory syndrome coronavirus 2 (SARS-CoV-2) infection identified during the hospitalization or in the prior 2 weeks, excluding those admitted to hospice care. Patients with multiple hospitalizations (N=208 patients, 229 hospitalizations, 4.4%) were included repeatedly if they continued to have laboratory-confirmed disease. Patients without admission vital signs (N=28) were excluded. Mortality was defined as in-hospital death or discharge to hospice care. In-house laboratory testing began March 16 and all inpatients were tested for SARS-CoV-2 by April 1; elective surgeries resumed May 4-11 and were only conducted on confirmed SARS-CoV-2–negative patients.
All data were obtained from the electronic health record (Epic Systems, Verona, Wisconsin). Diagnosis codes were obtained from the problem list, past medical history, and billing codes. In addition, we used objective data such as hemoglobin A1c, ejection fraction, outpatient creatinine, and outpatient blood pressure to augment problem list diagnoses where relevant.
Based on prior literature, we constructed multivariable logistic regression models for mortality adjusting for age; sex; self-reported race and ethnicity; body mass index; smoking history; presence of hypertension, heart failure, hyperlipidemia, coronary artery disease, diabetes, cancer, chronic kidney disease, dementia, or pulmonary disease individually as dummy variables; and admission oxygen saturation, D-dimer, ferritin, and C-reactive protein.3-6 In the first model (C statistic 0.82), we did not include month of admission as a covariate and calculated the ratio of the sum of observed and expected deaths (obtained from the model) in each month to obtain the standardized mortality ratio (SMR) for each month. We then multiplied each period’s SMR by the overall average crude mortality to generate monthly adjusted mortality rates. We calculated Poisson control limits and indicated points outside the control limits as significantly different.
In a second model (C statistic 0.84), we included month as a covariate and calculated average marginal effects (AME) for each time period by using the margins library in R,7 which uses a discrete first-difference in predicted outcomes to obtain the AME. The average marginal effect represents the percentage point difference between the reference period (March) and a subsequent time period in probability of death or discharge to hospice, for equivalent patients. We obtained lower and upper confidence intervals for the AME using a bootstrapping approach described in Green.8 Finally, we conducted two sensitivity analyses: one, restricting the analysis to only those patients with principal diagnosis of COVID-19, sepsis, or respiratory disease (see Appendix A for complete list of codes) and one restricting the analysis to only those with length of stay of at least 3 days.
All statistical analyses were conducted with R, version 4.0.2. All analyses used 2-sided statistical tests, and we considered a P value < .05 to be statistically significant without adjustment for multiple testing. The NYU institutional review board approved the study and granted a waiver of consent and a waiver of the Health Information Portability and Accountability Act.
RESULTS
We included 5,121 hospitalizations, of which 5,118 (99.94%) had known outcomes (death or hospital discharge). Peak hospitalizations occurred in late March to mid-April, which accounted for 53% of the hospitalizations. Median length of stay for patients who died or were discharged to hospice was 8 days (interquartile range, 4-15; max 140 days). The median age and the proportion male or with any comorbidity decreased over time (Table). For instance, the proportion with any chronic condition decreased from 81% in March to 72% in August.
Adjusted mortality dropped each month, from 25.6% in March to 7.6% in August (Table and Figure). The SMR declined progressively over time, from 1.26 (95% CI, 1.15-1.39) in March to 0.38 (95% CI, 0.12-0.88) in August (Table). The adjusted average marginal effect was also significantly lower than in March in every subsequent month, reaching a maximum of an average 18.2 (95% CI, 12.0-24.4) percentage point decrease in probability of death in August, accounting for changes in demographics and clinical severity (Table and Appendix B). The decrease in unadjusted mortality over time was observed across age groups (Appendix C).
Results of the two sensitivity analyses were similar (Appendices D and E), though attenuated in the case of the sepsis/respiratory cohort, with adjusted mortality falling from 31.4% to 14.4%, SMR decreasing from 1.28 (95% CI, 1.16-1.41) to 0.59 (95% CI, 0.16-1.50), and AME in August 17.0 percentage points (95% CI, 6.0-28.1).
DISCUSSION
In this study of COVID-19 mortality over 6 months at a single health system, we found that changes in demographics and severity of illness at presentation did not fully explain decreases in mortality seen over time. Even after risk adjustment for a variety of clinical and demographic factors, including severity of illness at presentation, mortality was significantly and progressively lower over the course of the study period.
Similar risk-adjusted results have been preliminarily reported among intensive care unit patients in a preprint from the United Kingdom.9 Incremental improvements in outcomes are likely a combination of increasing clinical experience, decreasing hospital volume, growing use of new pharmacologic treatments (such as systemic corticosteroids,10 remdesivir,11 and anticytokine treatments), nonpharmacologic treatments (such as placing the patient in the prone position, or proning, rather than on their back), earlier intervention, community awareness, and, potentially, lower viral load exposure from increased mask wearing and social distancing.12
Strengths of this study include highly detailed electronic health record data on hospitalizations at three different hospitals, a diverse patient population,6 near-complete study outcomes, and a lengthy period of investigation of 6 months. However, this study does have limitations. All patients were from a single geographic region and treated within a single health system, though restricting data to one system reduces institution-level variability and allows us to assess how care may have evolved with growing experience. Aggregating data from numerous health systems that might be at different stages of local outbreaks, provide different quality of care, and contribute different numbers of patients in each period introduces its own biases. We were also unable to disentangle different potential explanatory factors given the observational nature of the study. Residual confounding, such as a higher proportion of particularly frail patients admitted in earlier periods, is also a possibility, though the fact that we observed declines across all age groups mitigates this concern. Thresholds for hospital admission may also have changed over time with less severely ill patients being admitted in the later time periods. While changing admission thresholds could have contributed to higher survival rates in the latter portions of the study, our inclusion of several highly predictive clinical and laboratory results likely captured many aspects of disease severity.
CONCLUSION
In summary, data from one health system suggest that COVID-19 remains a serious disease for high-risk patients, but that mortality rates are improving over time.
1. CDC COVID Data Tracker. 2020. Centers for Disease Control and Prevention. Accessed October 14, 2020. https://covid.cdc.gov/covid-data-tracker/#trends_dailytrendscases
2. Boehmer TK, DeVies J, Caruso E, et al. Changing age distribution of the COVID-19 pandemic - United States, May-August 2020. MMWR Morb Mortal Wkly Rep. 2020;69(39):1404-1409 http://dx.doi.org/0.15585/mmwr.mm6939e1
3. Lu L, Zhong W, Bian Z, et al. A comparison of mortality-related risk factors of COVID-19, SARS, and MERS: A systematic review and meta-analysis. J Infect. 2020;81(4):318-e25. https://doi.org/10.1016/j.jinf.2020.07.002
4. Parohan M, Yaghoubi S, Seraji A, Javanbakht MH, Sarraf P, Djalali M. Risk factors for mortality in patients with coronavirus disease 2019 (COVID-19) infection: a systematic review and meta-analysis of observational studies. Aging Male. 2020;Jun8:1-9. https://doi.org/10.1080/13685538.2020.1774748
5. Zheng Z, Peng F, Xu B, et al. Risk factors of critical & mortal COVID-19 cases: a systematic literature review and meta-analysis. J Infect. 2020;81(2):e16-e25. https://doi.org/10.1016/j.jinf.2020.04.021
6. Petrilli CM, Jones SA, Yang J, et al. Factors associated with hospital admission and critical illness among 5279 people with coronavirus disease 2019 in New York City: prospective cohort study. BMJ. 2020;369:m1966. https://doi.org/10.1136/bmj.m1966
7. margins: Marginal Effects for Model Objects [computer program]. Version R package version 0.3.232018. Accessed October 1, 2020. https://rdrr.io/cran/margins/
8. Greene WH. Econometric Analysis. 7th ed. Pearson; 2012.
9. Doidge JC, Mouncey PR, Thomas K, et al. Trends in intensive care for patients with COVID-19 in England, Wales and Northern Ireland. Preprints 2020. Preprint posted online August 11, 2020. https://doi.org/10.20944/preprints202008.0267.v1
10. Recovery Collaborative Group, Horby P, Lim WS, et al. Dexamethasone in hospitalized patients with Covid-19 - preliminary report. N Engl J Med. 2020. Online first July 17, 2020. https://doi.org/10.1056/NEJMoa2021436
11. Beigel JH, Tomashek KM, Dodd LE, et al. Remdesivir for the treatment of Covid-19 – final report. N Enl J Med. 2020. Online first October 8, 2020. https://doi.org/10.1056/NEJMoa2007764
12. Gandhi M, Rutherford GW. Facial masking for Covid-19 - potential for “variolation” as we await a vaccine. N Engl J Med. 2020. Online first September 8, 2020. https://doi.org/10.1056/NEJMp2026913
© 2020 Society of Hospital Medicine
Clinical Progress Note: Decision-making for Tracheostomy Placement in Children With Neurological Impairment
Children with complex medical conditions are living longer, many with the help of interventions and technology, such as gastrostomy tubes, tracheostomies, ventilator support, and parenteral nutrition. Children with medical complexity and technology account for over 80% of hospital days in pediatric academic centers.1
Hospitalists need communication skills and clinical information to guide discussions with patients and families about whether to pursue these measures. Tracheostomy discussions can be particularly challenging. Over 4,000 infants and children undergo tracheostomy each year, with related hospital charges of more than $2 billion, a 30-day readmission rate of 24.9%, and a median length of stay for pneumonia or tracheitis of 4 days.2 There is limited research on prognosis, outcomes, decision-making, and effects on quality of life, especially in the population of children who have significant neurological impairment (NI) and/or progressive or deteriorating neurological conditions. Physician biases may also influence this discussion.
This article will examine the question: How can a hospitalist guide decision-making discussions with families about tracheostomy placement for children with NI? A literature search was performed on Medline and Web of Science using the key terms tracheostomy, prognosis, neurologically impaired children, and decision-making. Articles included were relevant to the clinical question and published in the last 5 years. One article was included outside this timeframe given the scarcity of data.
INDICATIONS FOR TRACHEOSTOMY
Indications for tracheostomy include airway obstruction and the need for prolonged ventilation support.3 The number of tracheostomies placed has been increasing over the last 30 years, especially at tertiary care centers.3 Primary indications for tracheostomy include prolonged ventilation particularly in the context of underlying conditions such as congenital or acquired respiratory disease, congenital or acquired neurologic disease, cardiopulmonary disease, and primary anatomic airway obstruction.3,4 Children who undergo tracheostomy often have multiple medical conditions that impact their overall health and prognosis, with 41% having three or more complex chronic health conditions.5 This article will focus on children who have a primary indication of NI and in whom tracheostomy is often used as a life-prolonging measure.
PROGNOSIS
Discussions about tracheostomy should include information about risks, benefits, and prognosis. Prognosis discussions can be challenging given that many children for whom this intervention is being considered have multiple and complex medical conditions with uncertain or even known poor prognoses. Mortality rates ranging from 3% to 11% have been reported during the initial tracheostomy admission, with NI increasing the risk for mortality during the tracheostomy admission.5,6 Children with NI also have higher mortality beyond the initial hospital stay, lower decannulation rates, and more frequent admissions with longer lengths of stay than do children receiving a tracheostomy for upper airway obstruction (Table 1).6,7

For most children in this population, prognosis is related more to the underlying disease process than to the risk of the surgery for tracheostomy placement itself. Discussions with families should include the anticipated prognosis of the underlying disease, as well as current available data on outcomes for children with neurological impairment who have undergone tracheostomy placement. Most patients who receive a tracheostomy are children with complex medical conditions who have an acute event that leads to airway compromise and respiratory failure underscoring the importance of advance care planning.5
GOALS OF CARE DISCUSSIONS
Clinicians face challenges when initiating advance care planning discussions, including prognostic uncertainty, the perception that families may not want to engage in these discussions, and the complexity and time these discussions can take. In one study of more than 300 chronically ill children, only 17% of parents had discussed advance directives, although 49% reported they would like to create one for their child.9 A small study found that, although parents find these discussions difficult, they also find them important. They value a step by step approach with consideration for hope and nonmedical concerns.10 Advance care planning discussions should be viewed as a time out to clarify what the family sees as the best path forward before initiation of a tracheostomy discussion and decision.
Determining goals of care is a cornerstone of any discussion about tracheostomy placement, especially when a child has a condition that is life limiting. The decision to pursue tracheostomy should involve shared decision-making. This decision-making process is the preferred communication model when multiple options could be pursued, each with its own risks and benefits.10
In this model of decision-making, the family’s goals and values should be determined in the context of the medical intervention that is being pursued. Medical information such as prognosis, risk, benefits, and impact of the intervention on quality of life should all be shared with the family. Ideally, shared decision-making allows the practitioner and family to make a decision together that matches the family’s goals and values with the best option available. If the family’s goal is to prolong life and they feel their child has good quality of life, tracheostomy placement may be the most appropriate option. However, it is also possible that the family’s goals may align more with less invasive treatment options or a transition to comfort care.
Discussions regarding goals of care can be challenging, and involving an interdisciplinary team and a Palliative Care consultant can be helpful.
WHAT PROVIDERS SAY, WHAT FAMILIES NEED TO HEAR
Research on what parents find helpful in discussions about tracheostomy is limited. One study of 56 caregivers found that parents did not feel they could make a “free choice” because the alternative to tracheostomy was death.11 In interviews with caregivers following tracheostomy, this same study found several themes in caregiver perspectives on their decision for tracheostomy (Table 2); caregivers saw a benefit to “health and well-being” from tracheostomy even though they reported feeling unprepared for the caregiving aspect at home or the potential negative side effects. Half the children in this study had a neurologic diagnosis, and only families who chose tracheostomy placement were included. To this author’s knowledge, there are currently no studies that look at decisional themes, satisfaction, or outcomes for families that chose to not pursue tracheostomy.

There is limited literature about how providers discuss tracheostomy. One single-center study of practitioners found that providers focused more often on the benefits of tracheostomy rather than burdens (72% vs 28%).12 A common benefit theme was the provider “suggesting life with a tracheostomy might not be as difficult as families fear in that the child may have the ability to regain speech, engage in normal activities, and have the tracheostomy reversed once the child’s health improved.” However, decannulation rates and recovery trajectories for children with NI do not support this general expectation (Table 1). These provider communication themes may help to explain the family’s perspective that they feel unprepared for the burdens of a tracheostomy or the intensity of home caregiving. Given the limited data, it is difficult to generalize. Comparing communication and decision-making themes side by side does draw attention to how providers might better communicate with families about this decision (Table 2).
The difficult aspects of caregiving deserve special attention. A study of 25 parents showed reduced parental quality of life after their child’s tracheostomy placement related to overwhelming medical care, fear of death of the child requiring constant vigilance, and financial and psychological stressors.13 Most (72%) families in this study reported decisional regret at 3 months.Resources and support for a child with this level of care varies based on the child’s community. Exploration and discussion of what is available for each family, including home nursing, respite, and/or a skilled nursing facility, should be completed prior to tracheostomy placement. Honest discussions about the potential effects of this intervention on the family’s life can help inform their decision.
Decision-making tools for tracheostomy could be valuable for both families and clinicians. These tools allow for a more systematic approach to the decision-making process that takes into account the multidimensional aspects of this decision. The “Child Tracheostomy Decision Guide,” published by the Winnipeg Regional Health Authority, is one available tool.14 This tool guides families through the factors that may affect their decision-making and includes thoughts about goals of care, quality of life, prognosis, care at home, and other options such as comfort care. The Courageous Parents Network has also developed parent videos giving the perspective of parents who have chosen or not chosen tracheostomy.15 Currently, there are no studies that examine the usefulness of decision-making tools.
GAPS IN LITERATURE
A common theme throughout the literature is the lack of a unifying classification system for reporting outcomes data. Each study utilizes different primary indications for tracheostomy and often different definitions for NI. There is very little literature that focuses specifically on outcomes for children with NI who receive tracheostomy as a life-prolonging measure. These gaps present challenges for obtaining meaningful prognosis data to share with families. Outcomes data for children who do not receive tracheostomy is also lacking. Additional studies on how families make this decision and their decisional satisfaction could help inform the decision-making process for both parents and clinicians. Research regarding the helpfulness and outcomes with decision-making tools would be useful.
CONCLUSIONS
Although there are limited data on outcomes specific to the children with NI and tracheostomy, existing literature shows a higher mortality, lower decannulation rate, higher hospitalization rate, and longer length of stay than that for children who receive tracheostomy for other indications. Tracheostomy is often a life-prolonging measure for children with NI. Shared decision-making should be the preferred communication process and include defining goals of care, as well as anticipated prognosis with balanced information about risks and benefits. Further research about the decision-making process and communication would be beneficial.
DISCLOSURE
Dr Shaw has nothing to disclose.
1. Children’s Hospital Association. Spend for children with dominant chronic diseases – The CARE award. Historical spending: 2012-2014. https://www.childrenshospitals.org/Care/Children-With-Medical-Complexity 2018
2. Russel CJ, Mack WJ, Schrager SM, Wu S. Care variations, length of stay and readmissions in children hospitalized for bacterial tracheostomy-associated respiratory infections. Hosp Pediatr. 2017;7(1):16-23. https://doi.org/10.1542/hpeds.2016-0104
3. McPherson ML, Shekerdemian L, Goldsworthy M, et al. A decade of pediatric tracheostomies: indications, outcomes, and long-term prognosis. Pediatr Pulmonol. 2017;52(7):946-953. https://doi.org/10.1002/ppul.23657
4. Gergin O, Adil EA, Kawai K, Watters K, Moritz E, Rahbar R. Indications of pediatric tracheostomy over the last 30 years: has anything changed? Int J Pediatr Otorhinolaryngol. 2016;87:144-147. https://doi.org/10.1016/j.ijporl.2016.06.018
5. Edwards J, Houtrow A, Lucas A, et al. Children and young adults who receive tracheostomies or were initiated on long-term ventilation in PICUs. Pediatr Crit Care Med. 2016;17(8):e324-334. https://doi.org/10.1097/pcc.0000000000000844
6. Berry JG, Graham DA, Graham RJ, et al. Predictors of clinical outcomes and hospital resource use of children after tracheotomy. Pediatrics. 2009;124(2):563-572. https://doi.org/10.1542/peds.2008-3491
7. Tsuboi N, Ide K, Nishimura N, Nakagawa S, Morimoto N. Pediatric tracheostomy: survival and long-term outcomes. Int J Pediatr Otorhinolaryngol. 2016;89:81-85. https://doi.org/10.1016/j.ijporl.2016.07.033
8. Liberman DB, Pham PK, Nager AL. Pediatric advance directives: parents’ knowledge, experience, and preferences. Pediatrics. 2014;134(2):e436-e443. https://doi.org/10.1542/peds.2013-3124
9. Lotz JD, Daxer M, Jox RJ, Borasio GD, Führer M. “Hope for the best, prepare for the worst”: a qualitative interview study on parents’ needs and fears in pediatric advance care planning. Palliat Med. 2017;31(8):764-771. https://doi.org/10.1177/0269216316679913
10. Nelson KE, Mahant S. Shared decision-making about assistive technology for the child with severe neurologic impairment. Pediatr Clin North Am. 2014;61(4):641-652. https://doi.org/10.1016/j.pcl.2014.04.001
11. Nageswaran S, Golden SL, Gower WA, King NMP. Caregiver perceptions about their decision to pursue tracheostomy for children with medical complexity. J Pediatr. 2018;203:354-360.e1. https://doi.org/10.1016/j.jpeds.2018.07.045
12. Hebert LM, Watson AC, Madrigal V, October TW. Discussing benefits and risks of tracheostomy: what physicians actually say. Pediatr Crit Care Med. 2017;18(12):e592-e597. https://doi.org/10.1097/PCC.0000000000001341
13. October T, Jones A, Michals H, Hebert L, Jiang J, Wang J. Parental conflict, regret, and short-term impact on quality of life in tracheostomy decision making. Pediatr Crit Care Med. 2020;21(2):136-142. https://doi.org/10.1097/PCC.0000000000002109
14. Winnipeg Regional Health Authority. Childhood Tracheostomy Decision Guide. Accessed August 15, 2019. https://www.wrha.mb.ca/extranet/eipt/files/EIPT-023-001.pdf
15. Courageous Parents Network. Tracheostomy Decision Making Videos. Accessed August 20, 2019. https://courageousparentsnetwork.org/video-library/decision-making/tracheostomy
Children with complex medical conditions are living longer, many with the help of interventions and technology, such as gastrostomy tubes, tracheostomies, ventilator support, and parenteral nutrition. Children with medical complexity and technology account for over 80% of hospital days in pediatric academic centers.1
Hospitalists need communication skills and clinical information to guide discussions with patients and families about whether to pursue these measures. Tracheostomy discussions can be particularly challenging. Over 4,000 infants and children undergo tracheostomy each year, with related hospital charges of more than $2 billion, a 30-day readmission rate of 24.9%, and a median length of stay for pneumonia or tracheitis of 4 days.2 There is limited research on prognosis, outcomes, decision-making, and effects on quality of life, especially in the population of children who have significant neurological impairment (NI) and/or progressive or deteriorating neurological conditions. Physician biases may also influence this discussion.
This article will examine the question: How can a hospitalist guide decision-making discussions with families about tracheostomy placement for children with NI? A literature search was performed on Medline and Web of Science using the key terms tracheostomy, prognosis, neurologically impaired children, and decision-making. Articles included were relevant to the clinical question and published in the last 5 years. One article was included outside this timeframe given the scarcity of data.
INDICATIONS FOR TRACHEOSTOMY
Indications for tracheostomy include airway obstruction and the need for prolonged ventilation support.3 The number of tracheostomies placed has been increasing over the last 30 years, especially at tertiary care centers.3 Primary indications for tracheostomy include prolonged ventilation particularly in the context of underlying conditions such as congenital or acquired respiratory disease, congenital or acquired neurologic disease, cardiopulmonary disease, and primary anatomic airway obstruction.3,4 Children who undergo tracheostomy often have multiple medical conditions that impact their overall health and prognosis, with 41% having three or more complex chronic health conditions.5 This article will focus on children who have a primary indication of NI and in whom tracheostomy is often used as a life-prolonging measure.
PROGNOSIS
Discussions about tracheostomy should include information about risks, benefits, and prognosis. Prognosis discussions can be challenging given that many children for whom this intervention is being considered have multiple and complex medical conditions with uncertain or even known poor prognoses. Mortality rates ranging from 3% to 11% have been reported during the initial tracheostomy admission, with NI increasing the risk for mortality during the tracheostomy admission.5,6 Children with NI also have higher mortality beyond the initial hospital stay, lower decannulation rates, and more frequent admissions with longer lengths of stay than do children receiving a tracheostomy for upper airway obstruction (Table 1).6,7
For most children in this population, prognosis is related more to the underlying disease process than to the risk of the surgery for tracheostomy placement itself. Discussions with families should include the anticipated prognosis of the underlying disease, as well as current available data on outcomes for children with neurological impairment who have undergone tracheostomy placement. Most patients who receive a tracheostomy are children with complex medical conditions who have an acute event that leads to airway compromise and respiratory failure underscoring the importance of advance care planning.5
GOALS OF CARE DISCUSSIONS
Clinicians face challenges when initiating advance care planning discussions, including prognostic uncertainty, the perception that families may not want to engage in these discussions, and the complexity and time these discussions can take. In one study of more than 300 chronically ill children, only 17% of parents had discussed advance directives, although 49% reported they would like to create one for their child.9 A small study found that, although parents find these discussions difficult, they also find them important. They value a step by step approach with consideration for hope and nonmedical concerns.10 Advance care planning discussions should be viewed as a time out to clarify what the family sees as the best path forward before initiation of a tracheostomy discussion and decision.
Determining goals of care is a cornerstone of any discussion about tracheostomy placement, especially when a child has a condition that is life limiting. The decision to pursue tracheostomy should involve shared decision-making. This decision-making process is the preferred communication model when multiple options could be pursued, each with its own risks and benefits.10
In this model of decision-making, the family’s goals and values should be determined in the context of the medical intervention that is being pursued. Medical information such as prognosis, risk, benefits, and impact of the intervention on quality of life should all be shared with the family. Ideally, shared decision-making allows the practitioner and family to make a decision together that matches the family’s goals and values with the best option available. If the family’s goal is to prolong life and they feel their child has good quality of life, tracheostomy placement may be the most appropriate option. However, it is also possible that the family’s goals may align more with less invasive treatment options or a transition to comfort care.
Discussions regarding goals of care can be challenging, and involving an interdisciplinary team and a Palliative Care consultant can be helpful.
WHAT PROVIDERS SAY, WHAT FAMILIES NEED TO HEAR
Research on what parents find helpful in discussions about tracheostomy is limited. One study of 56 caregivers found that parents did not feel they could make a “free choice” because the alternative to tracheostomy was death.11 In interviews with caregivers following tracheostomy, this same study found several themes in caregiver perspectives on their decision for tracheostomy (Table 2); caregivers saw a benefit to “health and well-being” from tracheostomy even though they reported feeling unprepared for the caregiving aspect at home or the potential negative side effects. Half the children in this study had a neurologic diagnosis, and only families who chose tracheostomy placement were included. To this author’s knowledge, there are currently no studies that look at decisional themes, satisfaction, or outcomes for families that chose to not pursue tracheostomy.
There is limited literature about how providers discuss tracheostomy. One single-center study of practitioners found that providers focused more often on the benefits of tracheostomy rather than burdens (72% vs 28%).12 A common benefit theme was the provider “suggesting life with a tracheostomy might not be as difficult as families fear in that the child may have the ability to regain speech, engage in normal activities, and have the tracheostomy reversed once the child’s health improved.” However, decannulation rates and recovery trajectories for children with NI do not support this general expectation (Table 1). These provider communication themes may help to explain the family’s perspective that they feel unprepared for the burdens of a tracheostomy or the intensity of home caregiving. Given the limited data, it is difficult to generalize. Comparing communication and decision-making themes side by side does draw attention to how providers might better communicate with families about this decision (Table 2).
The difficult aspects of caregiving deserve special attention. A study of 25 parents showed reduced parental quality of life after their child’s tracheostomy placement related to overwhelming medical care, fear of death of the child requiring constant vigilance, and financial and psychological stressors.13 Most (72%) families in this study reported decisional regret at 3 months.Resources and support for a child with this level of care varies based on the child’s community. Exploration and discussion of what is available for each family, including home nursing, respite, and/or a skilled nursing facility, should be completed prior to tracheostomy placement. Honest discussions about the potential effects of this intervention on the family’s life can help inform their decision.
Decision-making tools for tracheostomy could be valuable for both families and clinicians. These tools allow for a more systematic approach to the decision-making process that takes into account the multidimensional aspects of this decision. The “Child Tracheostomy Decision Guide,” published by the Winnipeg Regional Health Authority, is one available tool.14 This tool guides families through the factors that may affect their decision-making and includes thoughts about goals of care, quality of life, prognosis, care at home, and other options such as comfort care. The Courageous Parents Network has also developed parent videos giving the perspective of parents who have chosen or not chosen tracheostomy.15 Currently, there are no studies that examine the usefulness of decision-making tools.
GAPS IN LITERATURE
A common theme throughout the literature is the lack of a unifying classification system for reporting outcomes data. Each study utilizes different primary indications for tracheostomy and often different definitions for NI. There is very little literature that focuses specifically on outcomes for children with NI who receive tracheostomy as a life-prolonging measure. These gaps present challenges for obtaining meaningful prognosis data to share with families. Outcomes data for children who do not receive tracheostomy is also lacking. Additional studies on how families make this decision and their decisional satisfaction could help inform the decision-making process for both parents and clinicians. Research regarding the helpfulness and outcomes with decision-making tools would be useful.
CONCLUSIONS
Although there are limited data on outcomes specific to the children with NI and tracheostomy, existing literature shows a higher mortality, lower decannulation rate, higher hospitalization rate, and longer length of stay than that for children who receive tracheostomy for other indications. Tracheostomy is often a life-prolonging measure for children with NI. Shared decision-making should be the preferred communication process and include defining goals of care, as well as anticipated prognosis with balanced information about risks and benefits. Further research about the decision-making process and communication would be beneficial.
DISCLOSURE
Dr Shaw has nothing to disclose.
1. Children’s Hospital Association. Spend for children with dominant chronic diseases – The CARE award. Historical spending: 2012-2014. https://www.childrenshospitals.org/Care/Children-With-Medical-Complexity 2018
2. Russel CJ, Mack WJ, Schrager SM, Wu S. Care variations, length of stay and readmissions in children hospitalized for bacterial tracheostomy-associated respiratory infections. Hosp Pediatr. 2017;7(1):16-23. https://doi.org/10.1542/hpeds.2016-0104
3. McPherson ML, Shekerdemian L, Goldsworthy M, et al. A decade of pediatric tracheostomies: indications, outcomes, and long-term prognosis. Pediatr Pulmonol. 2017;52(7):946-953. https://doi.org/10.1002/ppul.23657
4. Gergin O, Adil EA, Kawai K, Watters K, Moritz E, Rahbar R. Indications of pediatric tracheostomy over the last 30 years: has anything changed? Int J Pediatr Otorhinolaryngol. 2016;87:144-147. https://doi.org/10.1016/j.ijporl.2016.06.018
5. Edwards J, Houtrow A, Lucas A, et al. Children and young adults who receive tracheostomies or were initiated on long-term ventilation in PICUs. Pediatr Crit Care Med. 2016;17(8):e324-334. https://doi.org/10.1097/pcc.0000000000000844
6. Berry JG, Graham DA, Graham RJ, et al. Predictors of clinical outcomes and hospital resource use of children after tracheotomy. Pediatrics. 2009;124(2):563-572. https://doi.org/10.1542/peds.2008-3491
7. Tsuboi N, Ide K, Nishimura N, Nakagawa S, Morimoto N. Pediatric tracheostomy: survival and long-term outcomes. Int J Pediatr Otorhinolaryngol. 2016;89:81-85. https://doi.org/10.1016/j.ijporl.2016.07.033
8. Liberman DB, Pham PK, Nager AL. Pediatric advance directives: parents’ knowledge, experience, and preferences. Pediatrics. 2014;134(2):e436-e443. https://doi.org/10.1542/peds.2013-3124
9. Lotz JD, Daxer M, Jox RJ, Borasio GD, Führer M. “Hope for the best, prepare for the worst”: a qualitative interview study on parents’ needs and fears in pediatric advance care planning. Palliat Med. 2017;31(8):764-771. https://doi.org/10.1177/0269216316679913
10. Nelson KE, Mahant S. Shared decision-making about assistive technology for the child with severe neurologic impairment. Pediatr Clin North Am. 2014;61(4):641-652. https://doi.org/10.1016/j.pcl.2014.04.001
11. Nageswaran S, Golden SL, Gower WA, King NMP. Caregiver perceptions about their decision to pursue tracheostomy for children with medical complexity. J Pediatr. 2018;203:354-360.e1. https://doi.org/10.1016/j.jpeds.2018.07.045
12. Hebert LM, Watson AC, Madrigal V, October TW. Discussing benefits and risks of tracheostomy: what physicians actually say. Pediatr Crit Care Med. 2017;18(12):e592-e597. https://doi.org/10.1097/PCC.0000000000001341
13. October T, Jones A, Michals H, Hebert L, Jiang J, Wang J. Parental conflict, regret, and short-term impact on quality of life in tracheostomy decision making. Pediatr Crit Care Med. 2020;21(2):136-142. https://doi.org/10.1097/PCC.0000000000002109
14. Winnipeg Regional Health Authority. Childhood Tracheostomy Decision Guide. Accessed August 15, 2019. https://www.wrha.mb.ca/extranet/eipt/files/EIPT-023-001.pdf
15. Courageous Parents Network. Tracheostomy Decision Making Videos. Accessed August 20, 2019. https://courageousparentsnetwork.org/video-library/decision-making/tracheostomy
© 2020 Society of Hospital Medicine
Masks, Seat Belts, and the Politicization of Public Health
At the time this piece was written, 54 Florida hospitals reported no available intensive care unit (ICU) beds1; hospitals in Miami-Dade County even started sending patients to neighboring Broward County for care despite Broward County also reporting a hospital bed shortage. Patients might even have needed to be transferred further north to Palm Beach County.2 Miami-Dade County was diagnosing over 100 cases with SARS-CoV-2 per 100,000 residents per day at one point, with a test positivity rate of over 25% that suggests testing is inadequate and many more would-be positive tests are being missed.3 While certain parts of the United States seem to have gained some semblance of control over the novel coronavirus, Florida appears to be in a downward spiral of high infection rates and increasing hospitalizations.
It didn’t have to go this way.
According to Robert Redfield, MD, Director of the Centers for Disease Control and Prevention, wearing a mask significantly reduces SARS-CoV-2 transmission. If community masking were increased only modestly, disease transmission could be curtailed enough to prevent many stay-at-home orders and reduce losses of an estimated $1 trillion in gross domestic product4 while also providing incalculable improvements in morbidity and mortality. Some experts believe that, while wearing a mask can protect others, it can also protect the wearer.5
That masking should be universal has become the accepted public health sentiment during this pandemic. Yet at the time of writing this article, there was still no law mandating masks in Florida, perhaps due to a significant but vocal minority—those who have personal concerns about wearing a mask and little concern about transmitting the virus to other, more vulnerable populations. This was the reason that one of the authors (M.B.) campaigned tirelessly for mandatory masking at Palm Beach County Commission meetings, one of which made the international news because of the outrageous and seemingly heart-felt statements made by several antimask advocates.6
AN ORGANIZED AND OUTSPOKEN MINORITY
At the Palm Beach County Commission, organized antimask advocates arrived hours before the start of the meeting, coming in two buses. Because of social distancing guidelines and seating limitations, they were able to fill many of the open seats at the meeting, making it appear that the antimask advocates far outnumbered those in favor of mask laws. Despite their tactics of screaming and intimidation, a law mandating masks in the county passed unanimously, though medical exemptions for those with chronic obstructive pulmonary disease, asthma, or “other conditions that reduce breathing” and religious exemptions for “persons for whom wearing a facial covering conflicts with their religious beliefs or practices” were included.7 After the meeting, police escorts were required by those in favor of masks, while the county commissioners had to lock themselves behind chamber doors.
The antimask campaigners were already known to M.B., a teacher, from previous gatherings she had attended in support of firearm legislation aimed at reducing gun violence. The same antimask advocates at the County Commission meeting had previously gathered as counter-protesters at this prior event, heckling and threatening those advocating for improving gun safety through legislation such as background checks. While it should not be, mask wearing and the laws mandating it have become a question of politics rather than one based in scientific evidence.
POLITICIZATION OF PUBLIC HEALTH IN FLORIDA AND ITS CONSEQUENCES
The absence of mandatory masking laws in populations hesitant to wear them, combined with the rush to reopen businesses, resulted in increasing death rates in Florida, with 7-day averages continuing in an upward trajectory and over 7,000 deaths being reported as of August 3, 2020.8 A small glimmer of hope was raised on that day, when fewer than 100 deaths for the previous day were reported, although one wonders if the weekend’s Hurricane Isaias preparations may have delayed some reporting.
In the face of mounting death counts and increasingly stressed hospitals, Florida’s governor, Ron DeSantis, has not heeded calls to institute new regulations, instead deferring to localities. This is perhaps good news considering Georgia’s governor, Brian Kemp, has spoken out against local mask laws and has said that mandating wearing them, even at the local level, would be a “bridge too far.”9 Several Georgia municipalities defied the governor, passing mandatory masking for their populations anyway, prompting Governor Kemp to file a lawsuit against the city of Atlanta, which he subsequently dropped after a judge ordered the state and city into mediation.10
The idea that the state should create laws to regulate the health and safety of the population has been met with resistance in the past where there is a greater degree of libertarian and antipaternalistic thinking.11 Campaigning against public health laws is not a new phenomenon. In the 1970s and 1980s, mandatory seat belt laws were met with significant resistance by a vocal minority, with the most common predictors for opposing these laws noted as holding beliefs that seat belts were ineffective, inconvenient, or uncomfortable12—the same arguments that have been made against masks. Additionally, having lower educational attainment, less income, and younger age were predictors of being against mandatory seat belt laws.12
THE IMPORTANCE OF COMMUNITY ENGAGEMENT
In response to a vociferous and somewhat organized minority, which has, in many cases, intimidated state and local politicians into inaction, community organizers have put out the call for many more citizens to make their voices heard. This seemed to have had an impact on the Palm Beach County commissioners, one of whom tried to demonstrate that there was broad support for passing a mandatory masking law during the commission meeting by bringing a stack of printed-out communications he had received in favor of it. Community organizers and public health advocates generally have an easier time reaching local officials, whereas it can be more difficult to engage other government officials farther away in state capitals, especially in larger states such as Florida. The organizers can also appeal to the fact that the local officials must live in the communities they represent and do not want to suffer from the spread of SARS-CoV-2 and overflowing hospitals. While local officials may be ill equipped to handle a global pandemic, appealing to the community has been somewhat effective in putting pressure on these officials to get a patchwork of local laws, which hopefully will have an impact on Florida’s surge numbers.
In the absence of a statewide mandatory masking law in Florida, several municipalities have instituted their own restrictions. Counties with some of the largest cities, such as Miami, Fort Lauderdale, Tampa, and Orlando, have required that masks be worn in public since June or early July.13 These restrictions, however, were implemented later than states in the northeastern United States, which have required masks since April or May and before significant reopening of businesses took place, in contrast to the sequence observed in Florida.
In the absence of political leadership, Florida businesses are increasingly taking up the charge and mandating that employees work from home, while others are requiring that employees and customers wear masks. Following New York–based grocer Key Foods and national chains like Whole Foods, both of which have long required that Florida customers wear masks, Florida’s ubiquitous Publix Supermarkets mandated masks in over 800 of their stores beginning July 21.14
While individual businesses and localities should be commended for their efforts, unfortunately, this may not be enough to dampen the surge. A tool developed by Harvard-based researchers, has labeled Florida and several other neighboring states as having severe spread, necessitating the need for stay-at-home orders to be reinstated.15
CONCLUSION
Florida is currently a global epicenter for COVID-19 diagnoses, with the state reporting nearly 600,000 cases as of August 17,8 more than most countries with larger populations. Florida faces many barriers to gaining control over the virus, including a vocal and organized minority which has opposed public health measures, an unwilling state government and ill-equipped local officials, and an underfunded safety net if stay-at-home orders were to be issued. Appealing to the public and elected officials with science, sanity, and support for those who want to prevent the spread of COVID-19 may provide one solution for gaining some control over the pandemic.
Disclosures
The authors have nothing to disclose.
1. Hospital ICU Beds Census and Staffed Availability as Reported in ESS. My Florida. Accessed July 30, 2020. https://bi.ahca.myflorida.com/t/ABICC/views/Public/ICUBedsHospital
2. Goodman CK. Broward hospitals nearing capacity with overflow patients from Miami-Dade. South Florida Sun Sentinel. July 28, 2020. Accessed August 3, 2020. https://www.sun-sentinel.com/coronavirus/fl-ne-broward-hospitals-getting-overflow-20200728-akz7k5wmubb2billpnofsqtqdy-story.html
3. Miami-Dade County, FL. Covid Act Now. Accessed August 3, 2020. https://covidactnow.org/us/fl/county/miami_dade_county?s=790144
4. Brooks JT, Butler JC, Redfield RR. Universal masking to prevent SARS-CoV-2 transmission—the time is now. JAMA. Published online July 14, 2020. https://doi.org/10.1001/jama.2020.13107
5. Gandhi M, Beyrer C, Goosby E. Masks do more than protect others during COVID-19: reducing the inoculum of SARS-CoV-2 to protect the wearer. J Gen Intern Med. 2020;1-4. https://doi.org/10.1007/s11606-020-06067-8
6. ‘They want to throw God’s wonderful breathing system out.’ BBC News. June 25, 2020. Accessed August 3, 2020. https://www.bbc.com/news/av/world-us-canada-53174415/they-want-to-throw-god-s-wonderful-breathing-system-out
7. Palm Beach County Facial Coverings Frequently Asked Questions. Palm Beach County: Discover the Palm Beaches…the Best of Everything. Updated June 26, 2020. Accessed July 30, 2020. https://discover.pbcgov.org/PDF/COVID19/PBC-Facial-Coverings-FAQs.pdf
8. Florida COVID-19 Response. Accessed August 17, 2020. https://floridahealthcovid19.gov/
9. Flynn M, Iati M. Georgia Gov. Brian Kemp sues Atlanta over mask requirement as coronavirus surges in the state. Washington Post. July 16, 2020. Accessed August 3, 2020. https://www.washingtonpost.com/nation/2020/07/16/kemp-georgia-mask-mandates/
10. Jamerson J. Georgia Gov. Kemp drops lawsuit against Atlanta mayor over coronavirus restrictions. Wall Street Journal. August 13, 2020. Accessed August 17, 2020. https://www.wsj.com/articles/georgia-gov-kemp-drops-lawsuit-against-atlanta-mayor-over-coronavirus-restrictions-11597347685
11. Giubilini A, Savulescu J. Vaccination, risks, and freedom: the seat belt analogy. Public Health Ethics. 2019;12(3):237-249. https://doi.org/10.1093/phe/phz014
12. Morelock S, Hingson RW, Smith RA, Lederman RI. Mandatory seatbelt law support and opposition in New England—a survey. Public Health Rep. 1985;100(4):357-363.
13. Muller B. Most major Florida cities now require wearing face masks in public. News4Jax. June 19, 2020. Updated June 19, 2020. Accessed August 3, 2020. https://www.news4jax.com/news/local/2020/06/19/major-florida-cities-now-require-use-of-face-mask-in-public-places/
14. Ward B. Publix to mandate face masks for all stores starting next week. Tampa Bay Business Journal. July 16, 2020. Updated July 16, 2020. Accessed August 3, 2020. https://www.bizjournals.com/tampabay/news/2020/07/16/publix-to-mandate-face-masks-for-all-stores-starti.html
15. COVID Risk Levels Dashboard. Pandemics explained: unlocking evidence for better decision making. Accessed August 3, 2020. https://globalepidemics.org/key-metrics-for-covid-suppression/
At the time this piece was written, 54 Florida hospitals reported no available intensive care unit (ICU) beds1; hospitals in Miami-Dade County even started sending patients to neighboring Broward County for care despite Broward County also reporting a hospital bed shortage. Patients might even have needed to be transferred further north to Palm Beach County.2 Miami-Dade County was diagnosing over 100 cases with SARS-CoV-2 per 100,000 residents per day at one point, with a test positivity rate of over 25% that suggests testing is inadequate and many more would-be positive tests are being missed.3 While certain parts of the United States seem to have gained some semblance of control over the novel coronavirus, Florida appears to be in a downward spiral of high infection rates and increasing hospitalizations.
It didn’t have to go this way.
According to Robert Redfield, MD, Director of the Centers for Disease Control and Prevention, wearing a mask significantly reduces SARS-CoV-2 transmission. If community masking were increased only modestly, disease transmission could be curtailed enough to prevent many stay-at-home orders and reduce losses of an estimated $1 trillion in gross domestic product4 while also providing incalculable improvements in morbidity and mortality. Some experts believe that, while wearing a mask can protect others, it can also protect the wearer.5
That masking should be universal has become the accepted public health sentiment during this pandemic. Yet at the time of writing this article, there was still no law mandating masks in Florida, perhaps due to a significant but vocal minority—those who have personal concerns about wearing a mask and little concern about transmitting the virus to other, more vulnerable populations. This was the reason that one of the authors (M.B.) campaigned tirelessly for mandatory masking at Palm Beach County Commission meetings, one of which made the international news because of the outrageous and seemingly heart-felt statements made by several antimask advocates.6
AN ORGANIZED AND OUTSPOKEN MINORITY
At the Palm Beach County Commission, organized antimask advocates arrived hours before the start of the meeting, coming in two buses. Because of social distancing guidelines and seating limitations, they were able to fill many of the open seats at the meeting, making it appear that the antimask advocates far outnumbered those in favor of mask laws. Despite their tactics of screaming and intimidation, a law mandating masks in the county passed unanimously, though medical exemptions for those with chronic obstructive pulmonary disease, asthma, or “other conditions that reduce breathing” and religious exemptions for “persons for whom wearing a facial covering conflicts with their religious beliefs or practices” were included.7 After the meeting, police escorts were required by those in favor of masks, while the county commissioners had to lock themselves behind chamber doors.
The antimask campaigners were already known to M.B., a teacher, from previous gatherings she had attended in support of firearm legislation aimed at reducing gun violence. The same antimask advocates at the County Commission meeting had previously gathered as counter-protesters at this prior event, heckling and threatening those advocating for improving gun safety through legislation such as background checks. While it should not be, mask wearing and the laws mandating it have become a question of politics rather than one based in scientific evidence.
POLITICIZATION OF PUBLIC HEALTH IN FLORIDA AND ITS CONSEQUENCES
The absence of mandatory masking laws in populations hesitant to wear them, combined with the rush to reopen businesses, resulted in increasing death rates in Florida, with 7-day averages continuing in an upward trajectory and over 7,000 deaths being reported as of August 3, 2020.8 A small glimmer of hope was raised on that day, when fewer than 100 deaths for the previous day were reported, although one wonders if the weekend’s Hurricane Isaias preparations may have delayed some reporting.
In the face of mounting death counts and increasingly stressed hospitals, Florida’s governor, Ron DeSantis, has not heeded calls to institute new regulations, instead deferring to localities. This is perhaps good news considering Georgia’s governor, Brian Kemp, has spoken out against local mask laws and has said that mandating wearing them, even at the local level, would be a “bridge too far.”9 Several Georgia municipalities defied the governor, passing mandatory masking for their populations anyway, prompting Governor Kemp to file a lawsuit against the city of Atlanta, which he subsequently dropped after a judge ordered the state and city into mediation.10
The idea that the state should create laws to regulate the health and safety of the population has been met with resistance in the past where there is a greater degree of libertarian and antipaternalistic thinking.11 Campaigning against public health laws is not a new phenomenon. In the 1970s and 1980s, mandatory seat belt laws were met with significant resistance by a vocal minority, with the most common predictors for opposing these laws noted as holding beliefs that seat belts were ineffective, inconvenient, or uncomfortable12—the same arguments that have been made against masks. Additionally, having lower educational attainment, less income, and younger age were predictors of being against mandatory seat belt laws.12
THE IMPORTANCE OF COMMUNITY ENGAGEMENT
In response to a vociferous and somewhat organized minority, which has, in many cases, intimidated state and local politicians into inaction, community organizers have put out the call for many more citizens to make their voices heard. This seemed to have had an impact on the Palm Beach County commissioners, one of whom tried to demonstrate that there was broad support for passing a mandatory masking law during the commission meeting by bringing a stack of printed-out communications he had received in favor of it. Community organizers and public health advocates generally have an easier time reaching local officials, whereas it can be more difficult to engage other government officials farther away in state capitals, especially in larger states such as Florida. The organizers can also appeal to the fact that the local officials must live in the communities they represent and do not want to suffer from the spread of SARS-CoV-2 and overflowing hospitals. While local officials may be ill equipped to handle a global pandemic, appealing to the community has been somewhat effective in putting pressure on these officials to get a patchwork of local laws, which hopefully will have an impact on Florida’s surge numbers.
In the absence of a statewide mandatory masking law in Florida, several municipalities have instituted their own restrictions. Counties with some of the largest cities, such as Miami, Fort Lauderdale, Tampa, and Orlando, have required that masks be worn in public since June or early July.13 These restrictions, however, were implemented later than states in the northeastern United States, which have required masks since April or May and before significant reopening of businesses took place, in contrast to the sequence observed in Florida.
In the absence of political leadership, Florida businesses are increasingly taking up the charge and mandating that employees work from home, while others are requiring that employees and customers wear masks. Following New York–based grocer Key Foods and national chains like Whole Foods, both of which have long required that Florida customers wear masks, Florida’s ubiquitous Publix Supermarkets mandated masks in over 800 of their stores beginning July 21.14
While individual businesses and localities should be commended for their efforts, unfortunately, this may not be enough to dampen the surge. A tool developed by Harvard-based researchers, has labeled Florida and several other neighboring states as having severe spread, necessitating the need for stay-at-home orders to be reinstated.15
CONCLUSION
Florida is currently a global epicenter for COVID-19 diagnoses, with the state reporting nearly 600,000 cases as of August 17,8 more than most countries with larger populations. Florida faces many barriers to gaining control over the virus, including a vocal and organized minority which has opposed public health measures, an unwilling state government and ill-equipped local officials, and an underfunded safety net if stay-at-home orders were to be issued. Appealing to the public and elected officials with science, sanity, and support for those who want to prevent the spread of COVID-19 may provide one solution for gaining some control over the pandemic.
Disclosures
The authors have nothing to disclose.
1. Hospital ICU Beds Census and Staffed Availability as Reported in ESS. My Florida. Accessed July 30, 2020. https://bi.ahca.myflorida.com/t/ABICC/views/Public/ICUBedsHospital
2. Goodman CK. Broward hospitals nearing capacity with overflow patients from Miami-Dade. South Florida Sun Sentinel. July 28, 2020. Accessed August 3, 2020. https://www.sun-sentinel.com/coronavirus/fl-ne-broward-hospitals-getting-overflow-20200728-akz7k5wmubb2billpnofsqtqdy-story.html
3. Miami-Dade County, FL. Covid Act Now. Accessed August 3, 2020. https://covidactnow.org/us/fl/county/miami_dade_county?s=790144
4. Brooks JT, Butler JC, Redfield RR. Universal masking to prevent SARS-CoV-2 transmission—the time is now. JAMA. Published online July 14, 2020. https://doi.org/10.1001/jama.2020.13107
5. Gandhi M, Beyrer C, Goosby E. Masks do more than protect others during COVID-19: reducing the inoculum of SARS-CoV-2 to protect the wearer. J Gen Intern Med. 2020;1-4. https://doi.org/10.1007/s11606-020-06067-8
6. ‘They want to throw God’s wonderful breathing system out.’ BBC News. June 25, 2020. Accessed August 3, 2020. https://www.bbc.com/news/av/world-us-canada-53174415/they-want-to-throw-god-s-wonderful-breathing-system-out
7. Palm Beach County Facial Coverings Frequently Asked Questions. Palm Beach County: Discover the Palm Beaches…the Best of Everything. Updated June 26, 2020. Accessed July 30, 2020. https://discover.pbcgov.org/PDF/COVID19/PBC-Facial-Coverings-FAQs.pdf
8. Florida COVID-19 Response. Accessed August 17, 2020. https://floridahealthcovid19.gov/
9. Flynn M, Iati M. Georgia Gov. Brian Kemp sues Atlanta over mask requirement as coronavirus surges in the state. Washington Post. July 16, 2020. Accessed August 3, 2020. https://www.washingtonpost.com/nation/2020/07/16/kemp-georgia-mask-mandates/
10. Jamerson J. Georgia Gov. Kemp drops lawsuit against Atlanta mayor over coronavirus restrictions. Wall Street Journal. August 13, 2020. Accessed August 17, 2020. https://www.wsj.com/articles/georgia-gov-kemp-drops-lawsuit-against-atlanta-mayor-over-coronavirus-restrictions-11597347685
11. Giubilini A, Savulescu J. Vaccination, risks, and freedom: the seat belt analogy. Public Health Ethics. 2019;12(3):237-249. https://doi.org/10.1093/phe/phz014
12. Morelock S, Hingson RW, Smith RA, Lederman RI. Mandatory seatbelt law support and opposition in New England—a survey. Public Health Rep. 1985;100(4):357-363.
13. Muller B. Most major Florida cities now require wearing face masks in public. News4Jax. June 19, 2020. Updated June 19, 2020. Accessed August 3, 2020. https://www.news4jax.com/news/local/2020/06/19/major-florida-cities-now-require-use-of-face-mask-in-public-places/
14. Ward B. Publix to mandate face masks for all stores starting next week. Tampa Bay Business Journal. July 16, 2020. Updated July 16, 2020. Accessed August 3, 2020. https://www.bizjournals.com/tampabay/news/2020/07/16/publix-to-mandate-face-masks-for-all-stores-starti.html
15. COVID Risk Levels Dashboard. Pandemics explained: unlocking evidence for better decision making. Accessed August 3, 2020. https://globalepidemics.org/key-metrics-for-covid-suppression/
© 2020 Society of Hospital Medicine
Grieving and Hospital-Based Bereavement Care During the COVID-19 Pandemic
As of July 25, 2020, there had been 146,073 deaths from COVID-19 in the United States and 641,273 worldwide, with a disproportionate number of deaths occurring in historically disadvantaged minority groups, specifically African Americans.1,2 The number of decedents will continue to increase over the coming months, even as the number of new COVID-19 cases decreases. Given that, for each death, five persons are believed to be significantly affected,3 the number of bereaved individuals whose loved ones died during the pandemic in the United States alone is likely to be in the millions.
COVID-19–related mortality has become a pressing public health issue, and as a result, support for bereaved family members, especially for minority populations, is also an important public health issue.4 It is likely that bereaved individuals are at greater risk of poor bereavement outcomes during the pandemic—irrespective of whether the death was a result of COVID-19—because of social isolation. This is particularly true if loved ones died in the hospital and, due to visitor restrictions, faced limited or no visitation. For many, bereavement will be affected by stay-at-home orders and social distancing restrictions that reduce access to emotional support and rituals, such as funerals, that usually provide comfort.5
Urgent attention is needed to support bereaved individuals, to flatten the curve of mental health disorders associated with the death of loved ones during the pandemic. Within a preventive model of care, we offer guidelines for how hospitals, longitudinal providers, and mental health clinicians can provide bereavement outreach to all individuals whose loved ones died during the COVID-19 pandemic.
PUBLIC HEALTH MODEL OF BEREAVEMENT SUPPORT
The provision of bereavement care, including the assessment of risk for poor bereavement outcomes, is an essential component of high-quality end-of-life care endorsed by the hospice and palliative care movement.6 However, the development of standardized bereavement services has lagged behind that of other components of palliative care, varying greatly by institution and provider.7 Approximately 10% to 20% of bereaved individuals experience psychiatric difficulties following the death of a loved one, including prolonged grief disorder, posttraumatic stress disorder, and major depressive disorder.8 Risk factors include a hospital-based death, death in an intensive care unit (ICU), sudden death, not being able to say goodbye, and a history of psychiatric disorders.8,9
One of the biggest barriers in providing standardized bereavement services is the lack of a systematic process to identify individuals at risk of poor bereavement outcomes.10 Aoun et al developed a public health model of bereavement support that comprises a three-tiered approach to risk and the corresponding need for support.11 They propose that the low-risk group, approximately 60% of bereaved individuals, would primarily need support from family and friends, the moderate-risk group (30%) would need support from the wider community, and the high-risk group (10%) would need support from mental health providers.
It is reasonable to assume that many individuals whose loved ones died during the pandemic will fall into a high-risk group for poor bereavement outcomes, as identified by Aoun et al.11 Given a higher than usual inpatient mortality due to COVID-19 for certain populations and that bereavement care is already underrecognized within healthcare systems, hospitals and other healthcare facilities and their providers need to fill this void.
EDUCATION, GUIDANCE, AND SUPPORT MODEL
We adopted an education, guidance, and support model of bereavement support in 2019.7 This model has been shown to positively affect the experience of bereaved individuals, especially because of condolences from providers and psycho-educational information about coping with grief.7 Each month, a list of deceased patients and family contacts is generated from a mortality review database,12 and bereavement packets are mailed to family members; the packet includes a condolence letter from senior management, a psycho-educational grief guide, and a list of community-based resources. A social worker is also available to provide telephone support and to assist with mental health referrals. For patients who died in the COVID-19–specific units, social work also provides support and outreach to families.
Psycho-Education
During the early weeks of the pandemic, a tip sheet—”Grieving during a pandemic”13— was created to include in the bereavement packet and for distribution to community organizations within the hospital’s geographical area. This tip sheet offers strategies to facilitate coping based on the psychological model of cognitive-behavioral therapy (CBT).14 Topics addressed include understanding the nature of grief, self-care, adapting bereavement rituals in light of social distancing, challenging unhelpful thinking patterns that might lead to feelings of guilt especially regarding the death of the patient, and ways to obtain support during the pandemic. The tip sheet was made available in Spanish, French, Chinese, Haitian Creole, Portuguese, Arabic, and Russian given that our mortality data, consistent with preliminary findings from New York State, suggested higher death rates among Black/African American and Hispanic/Latino groups, compared with historical mortality statistics.15
Virtual Support
As part of our bereavement response during the COVID-19 crisis, we have launched virtual bereavement support for families impacted by the pandemic. It is challenging to identify the optimal type of support and timing, given the reliance on virtual outreach without in-person screening. With the increased distress and trauma associated with deaths during the pandemic, one clinical challenge is managing emotions in a virtual group without access to the usual tools that clinicians rely on, such as reading body language. Following a graded exposure approach, a form of behavioral therapy,14 we recommend offering a psycho-educational seminar first in which facilitators can control the content and limit exposure of sharing stories from participants. For support groups (eg, 6 to 8 sessions), we recommend that participants be screened prior to assess their risk factors and readiness and provide individual therapist referrals as needed.10
Community Outreach
Many diverse communities have been affected significantly by COVID-19 and faced high mortality rates.16 We recognized that proactive bereavement outreach to these communities was essential. Grief guides and tip sheets in various languages were made available as part of our community outreach programs, which included vans traveling to severely affected communities and providing testing, masks, alcohol-based hand sanitizer, and written materials.
Education About Bereavement
Many clinicians and staff express feelings of inadequacy about providing bereavement outreach. Such feelings are not uncommon, especially because clinicians tend to receive little training in dealing with the emotional toll of patient deaths and bereavement care.17,18 These feelings are likely to be heightened during this pandemic given the increased exposure to patient deaths, concern for personal safety, and changed practices in providing care, including the need to socially distance. Providing support for clinicians to process their feelings about the death of patients is crucial.19 In addition to our Employee Assistance Program, psychosocial clinicians are facilitating weekly virtual support groups for providers to discuss the effects of the pandemic on their personal and professional lives.

Bereaved family members report they benefit from hearing from the clinical team and receiving condolences, which is seen as humanizing the physician-family relationship. This personal outreach is likely more important during this time because many providers will have interacted with family members virtually.7,20,21 To help facilitate offers of condolences, we developed the TEARS acronym to describe the components of a condolence call that can also be adapted for writing condolence cards (Table).
GUIDELINES
We recommend that hospitals and other healthcare facilities that might not have well-established bereavement programs consider adopting a building block approach to provide basic outreach to families of their deceased patients.7 Tapping into existing resources, the major components are as follows: (1) a letter of condolence from leadership, (2) psycho-educational information about grief, (3) a list of community/online resources, including information about local hospice bereavement programs and bereavement camps or programs for children, (4) offers of condolences from individual providers/teams, and (5) mental health outreach as indicated.
CONCLUSION
The COVID-19–related mortality, particularly among already vulnerable populations, coupled with the existing underrecognition of bereavement has created an urgent public health issue that needs to be addressed. Given that few institutions offer standardized bereavement follow-up, we believe that hospital providers and mental health clinicians need to take a proactive approach to providing bereavement outreach to families affected by death during the pandemic.
Acknowledgments
The authors would like to acknowledge the Brigham Health Bereavement Committee and the staff of Care Continuum Management and the Department of Community Outreach at Brigham and Women’s Hospital.
Disclosures
No competing financial interests relevant to this article exist for Dr Morris, Ms Paterson, and Dr Mendu. Dr Morris receives royalties for two self-help books about grief published by Robinson and Dr Mendu provides consulting services for Bayer AG unrelated to the content of this article.
1. Coronavirus Resource Center Covid-19: Case Tracker. Johns Hopkins University. Accessed July 25, 2020. https://coronavirus.jhu.edu/
2. Tappe A. America’s black and Hispanic communities are bearing the brunt of the coronavirus. CNN. April 21, 2020. Accessed June 7, 2020. https://www.cnn.com/2020/04/21/economy/coronavirus-burden-black-hispanic-workers/index.html
3. Shear K, Frank E, Houck PR, Reynolds CF 3rd. Treatment of complicated grief: a randomized controlled trial. JAMA. 2005;293(21):2601-2608. https://doi.org/10.1001/jama.293.21.2601
4. Price-Haywood EG, Burton J, Fort D, Seoane L. Hospitalization and mortality among Black patients and White patients with Covid-19. N Engl J Med. 2020;382(26):2534-2543. https://doi.org/10.1056/nejmsa2011686
5. Morris SE, Moment A, Thomas JD. Caring for bereaved family members during the COVID-19 pandemic: before and after the death of a patient. J Pain Symptom Manage. Published online May 7, 2020. https://doi.org/10.1016/j.jpainsymman.2020.05.002
6. National Consensus Project for Quality Palliative Care. Clinical Practice Guidelines for Quality Palliative Care. 4th ed. National Coalition for Hospice and Palliative Care; 2018. Accessed June 7, 2020. https://www.nationalcoalitionhpc.org/ncp
7. Morris SE, Block SD. Adding value to palliative care services: the development of an institutional bereavement program. J Palliat Med. 2015;18(11):915-922. https://doi.org/10.1089/jpm.2015.0080
8. Stroebe M, Schut H, Stroebe W. Health outcomes of bereavement. Lancet. 2007;370(9603):1960-1973. https://doi.org/10.1016/s0140-6736(07)61816-9
9. Kentish-Barnes N, Chaize M, Seegers V, et al. Complicated grief after death of a relative in the intensive care unit. Eur Respir J. 2015;45(5):1341-1352. https://doi.org/10.1183/09031936.00160014
10. Morris SE, Anderson CM, Tarquini SJ, Block SD. A standardized approach to bereavement risk-screening: a quality improvement project. J Psychosoc Oncol. 2020;38(4):406-417. https://doi.org/10.1080/07347332.2019.1703065
11. Aoun SM, Breen LJ, Howting DA, Rumbold B, McNamara B, Hegney D. Who needs bereavement support? a population based survey of bereavement risk and support need. PLoS One. 2015;10(3):e0121101. https://doi.org/10.1371/journal.pone.0121101
12. Mendu ML, Lu Y, Petersen A, et al. Reflections on implementing a hospital-wide provider-based electronic inpatient mortality review system: lessons learnt. BMJ Qual Saf. 2020;29(4):304‐312. https://doi.org/10.1136/bmjqs-2019-009864
13. Morris SE. Grieving during a pandemic. Brigham and Women’s Hospital. Accessed July 25, 2020. https://www.brighamandwomens.org/covid-19/grieving-during-a-pandemic
14. Beck JS. Cognitive Behavior Therapy: Basics and Beyond. 2nd ed. Guilford Press; 2011.
15. Coronavirus Disease 2019 (COVID-19). Health Equity Considerations and Racial and Ethnic Minority Groups. Centers for Disease Control and Prevention. Updated July 24, 2020. Accessed July 25, 2020. https://www.cdc.gov/coronavirus/2019-ncov/need-extra-precautions/racial-ethnic-minorities.html
16. Death rates in Mass. surged in areas already hard hit. Boston Globe. May 17, 2020. Accessed June 8, 2020. https://www.bostonglobe.com/2020/05/17/opinion/death-rate-mass-surged-areas-already-hard-hit/
17. Jackson VA, Sullivan AM, Gadmer NM, et al. “It was haunting…”: physicians’ descriptions of emotionally powerful patient deaths. Acad Med. 2005;80(7):648-656. https://doi.org/10.1097/00001888-200507000-00007
18. Morris S, Schaefer K, Rosowsky E. Primary care for the elderly bereaved: recommendations for medical education. J Clin Psychol Med Settings. 2018;25(4):463‐470. https://doi.org/10.1007/s10880-018-9556-9
19. Morris SE, Kearns JP, Moment A, Lee KA, deLima Thomas J. “Remembrance”: a self-care tool for clinicians. J Palliat Med. 2019;22(3):316-318. https://doi.org/10.1089/jpm.2018.0395
20. Morris SE, Nayak MM, Block SD. Insights from bereaved family members about end-of-life care and bereavement. J Palliat Med. Published online February 10, 2020. https://doi.org/10.1089/jpm.2019.0467
21. Kentish-Barnes N, Cohen-Solal Z, Souppart V, et al. “It was the only thing I could hold onto, but…”: receiving a letter of condolence after loss of a loved one in the ICU: a qualitative study of bereaved relatives’ experience. Crit Care Med. 2017;45(12):1965-1971. https://doi.org/10.1097/ccm.0000000000002687
As of July 25, 2020, there had been 146,073 deaths from COVID-19 in the United States and 641,273 worldwide, with a disproportionate number of deaths occurring in historically disadvantaged minority groups, specifically African Americans.1,2 The number of decedents will continue to increase over the coming months, even as the number of new COVID-19 cases decreases. Given that, for each death, five persons are believed to be significantly affected,3 the number of bereaved individuals whose loved ones died during the pandemic in the United States alone is likely to be in the millions.
COVID-19–related mortality has become a pressing public health issue, and as a result, support for bereaved family members, especially for minority populations, is also an important public health issue.4 It is likely that bereaved individuals are at greater risk of poor bereavement outcomes during the pandemic—irrespective of whether the death was a result of COVID-19—because of social isolation. This is particularly true if loved ones died in the hospital and, due to visitor restrictions, faced limited or no visitation. For many, bereavement will be affected by stay-at-home orders and social distancing restrictions that reduce access to emotional support and rituals, such as funerals, that usually provide comfort.5
Urgent attention is needed to support bereaved individuals, to flatten the curve of mental health disorders associated with the death of loved ones during the pandemic. Within a preventive model of care, we offer guidelines for how hospitals, longitudinal providers, and mental health clinicians can provide bereavement outreach to all individuals whose loved ones died during the COVID-19 pandemic.
PUBLIC HEALTH MODEL OF BEREAVEMENT SUPPORT
The provision of bereavement care, including the assessment of risk for poor bereavement outcomes, is an essential component of high-quality end-of-life care endorsed by the hospice and palliative care movement.6 However, the development of standardized bereavement services has lagged behind that of other components of palliative care, varying greatly by institution and provider.7 Approximately 10% to 20% of bereaved individuals experience psychiatric difficulties following the death of a loved one, including prolonged grief disorder, posttraumatic stress disorder, and major depressive disorder.8 Risk factors include a hospital-based death, death in an intensive care unit (ICU), sudden death, not being able to say goodbye, and a history of psychiatric disorders.8,9
One of the biggest barriers in providing standardized bereavement services is the lack of a systematic process to identify individuals at risk of poor bereavement outcomes.10 Aoun et al developed a public health model of bereavement support that comprises a three-tiered approach to risk and the corresponding need for support.11 They propose that the low-risk group, approximately 60% of bereaved individuals, would primarily need support from family and friends, the moderate-risk group (30%) would need support from the wider community, and the high-risk group (10%) would need support from mental health providers.
It is reasonable to assume that many individuals whose loved ones died during the pandemic will fall into a high-risk group for poor bereavement outcomes, as identified by Aoun et al.11 Given a higher than usual inpatient mortality due to COVID-19 for certain populations and that bereavement care is already underrecognized within healthcare systems, hospitals and other healthcare facilities and their providers need to fill this void.
EDUCATION, GUIDANCE, AND SUPPORT MODEL
We adopted an education, guidance, and support model of bereavement support in 2019.7 This model has been shown to positively affect the experience of bereaved individuals, especially because of condolences from providers and psycho-educational information about coping with grief.7 Each month, a list of deceased patients and family contacts is generated from a mortality review database,12 and bereavement packets are mailed to family members; the packet includes a condolence letter from senior management, a psycho-educational grief guide, and a list of community-based resources. A social worker is also available to provide telephone support and to assist with mental health referrals. For patients who died in the COVID-19–specific units, social work also provides support and outreach to families.
Psycho-Education
During the early weeks of the pandemic, a tip sheet—”Grieving during a pandemic”13— was created to include in the bereavement packet and for distribution to community organizations within the hospital’s geographical area. This tip sheet offers strategies to facilitate coping based on the psychological model of cognitive-behavioral therapy (CBT).14 Topics addressed include understanding the nature of grief, self-care, adapting bereavement rituals in light of social distancing, challenging unhelpful thinking patterns that might lead to feelings of guilt especially regarding the death of the patient, and ways to obtain support during the pandemic. The tip sheet was made available in Spanish, French, Chinese, Haitian Creole, Portuguese, Arabic, and Russian given that our mortality data, consistent with preliminary findings from New York State, suggested higher death rates among Black/African American and Hispanic/Latino groups, compared with historical mortality statistics.15
Virtual Support
As part of our bereavement response during the COVID-19 crisis, we have launched virtual bereavement support for families impacted by the pandemic. It is challenging to identify the optimal type of support and timing, given the reliance on virtual outreach without in-person screening. With the increased distress and trauma associated with deaths during the pandemic, one clinical challenge is managing emotions in a virtual group without access to the usual tools that clinicians rely on, such as reading body language. Following a graded exposure approach, a form of behavioral therapy,14 we recommend offering a psycho-educational seminar first in which facilitators can control the content and limit exposure of sharing stories from participants. For support groups (eg, 6 to 8 sessions), we recommend that participants be screened prior to assess their risk factors and readiness and provide individual therapist referrals as needed.10
Community Outreach
Many diverse communities have been affected significantly by COVID-19 and faced high mortality rates.16 We recognized that proactive bereavement outreach to these communities was essential. Grief guides and tip sheets in various languages were made available as part of our community outreach programs, which included vans traveling to severely affected communities and providing testing, masks, alcohol-based hand sanitizer, and written materials.
Education About Bereavement
Many clinicians and staff express feelings of inadequacy about providing bereavement outreach. Such feelings are not uncommon, especially because clinicians tend to receive little training in dealing with the emotional toll of patient deaths and bereavement care.17,18 These feelings are likely to be heightened during this pandemic given the increased exposure to patient deaths, concern for personal safety, and changed practices in providing care, including the need to socially distance. Providing support for clinicians to process their feelings about the death of patients is crucial.19 In addition to our Employee Assistance Program, psychosocial clinicians are facilitating weekly virtual support groups for providers to discuss the effects of the pandemic on their personal and professional lives.
Bereaved family members report they benefit from hearing from the clinical team and receiving condolences, which is seen as humanizing the physician-family relationship. This personal outreach is likely more important during this time because many providers will have interacted with family members virtually.7,20,21 To help facilitate offers of condolences, we developed the TEARS acronym to describe the components of a condolence call that can also be adapted for writing condolence cards (Table).
GUIDELINES
We recommend that hospitals and other healthcare facilities that might not have well-established bereavement programs consider adopting a building block approach to provide basic outreach to families of their deceased patients.7 Tapping into existing resources, the major components are as follows: (1) a letter of condolence from leadership, (2) psycho-educational information about grief, (3) a list of community/online resources, including information about local hospice bereavement programs and bereavement camps or programs for children, (4) offers of condolences from individual providers/teams, and (5) mental health outreach as indicated.
CONCLUSION
The COVID-19–related mortality, particularly among already vulnerable populations, coupled with the existing underrecognition of bereavement has created an urgent public health issue that needs to be addressed. Given that few institutions offer standardized bereavement follow-up, we believe that hospital providers and mental health clinicians need to take a proactive approach to providing bereavement outreach to families affected by death during the pandemic.
Acknowledgments
The authors would like to acknowledge the Brigham Health Bereavement Committee and the staff of Care Continuum Management and the Department of Community Outreach at Brigham and Women’s Hospital.
Disclosures
No competing financial interests relevant to this article exist for Dr Morris, Ms Paterson, and Dr Mendu. Dr Morris receives royalties for two self-help books about grief published by Robinson and Dr Mendu provides consulting services for Bayer AG unrelated to the content of this article.
1. Coronavirus Resource Center Covid-19: Case Tracker. Johns Hopkins University. Accessed July 25, 2020. https://coronavirus.jhu.edu/
2. Tappe A. America’s black and Hispanic communities are bearing the brunt of the coronavirus. CNN. April 21, 2020. Accessed June 7, 2020. https://www.cnn.com/2020/04/21/economy/coronavirus-burden-black-hispanic-workers/index.html
3. Shear K, Frank E, Houck PR, Reynolds CF 3rd. Treatment of complicated grief: a randomized controlled trial. JAMA. 2005;293(21):2601-2608. https://doi.org/10.1001/jama.293.21.2601
4. Price-Haywood EG, Burton J, Fort D, Seoane L. Hospitalization and mortality among Black patients and White patients with Covid-19. N Engl J Med. 2020;382(26):2534-2543. https://doi.org/10.1056/nejmsa2011686
5. Morris SE, Moment A, Thomas JD. Caring for bereaved family members during the COVID-19 pandemic: before and after the death of a patient. J Pain Symptom Manage. Published online May 7, 2020. https://doi.org/10.1016/j.jpainsymman.2020.05.002
6. National Consensus Project for Quality Palliative Care. Clinical Practice Guidelines for Quality Palliative Care. 4th ed. National Coalition for Hospice and Palliative Care; 2018. Accessed June 7, 2020. https://www.nationalcoalitionhpc.org/ncp
7. Morris SE, Block SD. Adding value to palliative care services: the development of an institutional bereavement program. J Palliat Med. 2015;18(11):915-922. https://doi.org/10.1089/jpm.2015.0080
8. Stroebe M, Schut H, Stroebe W. Health outcomes of bereavement. Lancet. 2007;370(9603):1960-1973. https://doi.org/10.1016/s0140-6736(07)61816-9
9. Kentish-Barnes N, Chaize M, Seegers V, et al. Complicated grief after death of a relative in the intensive care unit. Eur Respir J. 2015;45(5):1341-1352. https://doi.org/10.1183/09031936.00160014
10. Morris SE, Anderson CM, Tarquini SJ, Block SD. A standardized approach to bereavement risk-screening: a quality improvement project. J Psychosoc Oncol. 2020;38(4):406-417. https://doi.org/10.1080/07347332.2019.1703065
11. Aoun SM, Breen LJ, Howting DA, Rumbold B, McNamara B, Hegney D. Who needs bereavement support? a population based survey of bereavement risk and support need. PLoS One. 2015;10(3):e0121101. https://doi.org/10.1371/journal.pone.0121101
12. Mendu ML, Lu Y, Petersen A, et al. Reflections on implementing a hospital-wide provider-based electronic inpatient mortality review system: lessons learnt. BMJ Qual Saf. 2020;29(4):304‐312. https://doi.org/10.1136/bmjqs-2019-009864
13. Morris SE. Grieving during a pandemic. Brigham and Women’s Hospital. Accessed July 25, 2020. https://www.brighamandwomens.org/covid-19/grieving-during-a-pandemic
14. Beck JS. Cognitive Behavior Therapy: Basics and Beyond. 2nd ed. Guilford Press; 2011.
15. Coronavirus Disease 2019 (COVID-19). Health Equity Considerations and Racial and Ethnic Minority Groups. Centers for Disease Control and Prevention. Updated July 24, 2020. Accessed July 25, 2020. https://www.cdc.gov/coronavirus/2019-ncov/need-extra-precautions/racial-ethnic-minorities.html
16. Death rates in Mass. surged in areas already hard hit. Boston Globe. May 17, 2020. Accessed June 8, 2020. https://www.bostonglobe.com/2020/05/17/opinion/death-rate-mass-surged-areas-already-hard-hit/
17. Jackson VA, Sullivan AM, Gadmer NM, et al. “It was haunting…”: physicians’ descriptions of emotionally powerful patient deaths. Acad Med. 2005;80(7):648-656. https://doi.org/10.1097/00001888-200507000-00007
18. Morris S, Schaefer K, Rosowsky E. Primary care for the elderly bereaved: recommendations for medical education. J Clin Psychol Med Settings. 2018;25(4):463‐470. https://doi.org/10.1007/s10880-018-9556-9
19. Morris SE, Kearns JP, Moment A, Lee KA, deLima Thomas J. “Remembrance”: a self-care tool for clinicians. J Palliat Med. 2019;22(3):316-318. https://doi.org/10.1089/jpm.2018.0395
20. Morris SE, Nayak MM, Block SD. Insights from bereaved family members about end-of-life care and bereavement. J Palliat Med. Published online February 10, 2020. https://doi.org/10.1089/jpm.2019.0467
21. Kentish-Barnes N, Cohen-Solal Z, Souppart V, et al. “It was the only thing I could hold onto, but…”: receiving a letter of condolence after loss of a loved one in the ICU: a qualitative study of bereaved relatives’ experience. Crit Care Med. 2017;45(12):1965-1971. https://doi.org/10.1097/ccm.0000000000002687
© 2020 Society of Hospital Medicine
Clinical Progress Note: Procalcitonin in the Identification of Invasive Bacterial Infections in Febrile Young Infants
Febrile infants 60 days of age or younger pose a significant diagnostic challenge for clinicians. Most of these infants are well appearing and do not have localizing signs or symptoms of infection, yet they may have serious bacterial infections (SBI) such as urinary tract infection (UTI), bacteremia, and meningitis. While urinalysis is highly sensitive for predicting UTI,1 older clinical decision rules and biomarkers such as white blood cell (WBC) count, absolute neutrophil count (ANC), and C-reactive protein (CRP) lack both appropriate sensitivity and specificity for identifying bacteremia and meningitis (ie, invasive bacterial infection [IBI]),2,3 which affect approximately 2.4% and 0.9% of febrile infants during the first 2 months of life, respectively.4 The lack of accurate diagnostic markers can drive overuse of laboratory testing, antibiotics, and hospitalization despite the low rates of these infections. As a result, procalcitonin (PCT) has generated interest because of its potential to serve as a more accurate biomarker for bacterial infections. This review summarizes recent literature on the diagnostic utility of PCT in the identification of IBI in febrile young infants 60 days or younger.
MECHANISM OF PROCALCITONIN
Procalcitonin is undetectable in noninflammatory states but can be detected in the blood within 4 to 6 hours after initial bacterial infection.5 Its production is stimulated throughout various tissues of the body by cytokines such as interleukin-6 and tumor necrosis factor, which are produced in response to bacterial infections. Interferon-γ, which is produced in response to viral infections, attenuates PCT production. While these characteristics suggest promise for PCT as a more specific screening test for underlying bacterial infection, there are caveats. PCT levels are physiologically elevated in the first 48 hours of life and vary with gestational age, factors that should be considered when interpreting results.6 Additionally, PCT levels can rise in other inflammatory states such as autoimmune conditions and certain malignancies,5 though these states are unlikely to confound the evaluation of febrile young infants.
DIAGNOSTIC ACCURACY OF PROCALCITONIN
Because of PCT’s potential to be more specific than other commonly used biomarkers, multiple studies have evaluated its performance characteristics in febrile young infants. Gomez et al retrospectively evaluated 1,112 well-appearing infants younger than 3 months with fever without a source in seven European emergency departments (EDs).7 Overall, 23 infants (2.1%) had IBI (1 with meningitis). A PCT level of 0.5 ng/mL or greater was the only independent risk factor for IBI (adjusted odds ratio, 21.69; 95% CI, 7.93-59.28). Four infants with IBI had a PCT level less than 0.5 ng/mL, and none of these four had meningitis. PCT was superior to CRP, ANC, and WBC in detecting IBI (area under the curve [AUC], 0.825; 95% CI, 0.698-0.952). PCT was the also the best marker for identifying IBI among 451 infants with a normal urine dipstick and fever detected ≤6 hours before presentation (AUC, 0.819; 95% CI, 0.551-1.087).
In the largest prospective study to date evaluating the diagnostic accuracy of PCT in febrile young infants, Milcent et al studied 2,047 previously healthy infants aged 7-91 days admitted for fever from 15 French EDs.8 In total, 21 (1%) had an IBI (8 with meningitis). PCT performed better than CRP, ANC, and WBC for the detection of IBI with an AUC of 0.91 (95% CI, 0.83-0.99). In a multivariable model, a PCT level of 0.3 ng/mL or greater was the only independent risk factor for IBI with an adjusted odds ratio of 40.3 (95% CI, 5.0-332). Only one infant with IBI had a PCT level less than 0.3 ng/mL. This infant was 83 days old, had 4 hours of fever, and became afebrile spontaneously prior to the blood culture revealing Streptococcus pneumoniae. PCT also performed better than CRP in the detection of IBI in infants 7-30 days of age and those with fever for less than 6 hours, though both subgroups had small numbers of infants with IBI. The authors determined that a PCT level of 0.3 ng/mL was the optimal cutoff for ruling out IBI; this cutoff had a sensitivity of 90% and negative likelihood ratio (LR) of 0.1 (Table). In contrast, the more commonly studied PCT cutoff of 0.5 ng/mL increased the negative LR to 0.2. The authors suggested that PCT, when used in the context of history, exam, and tests such as urinalysis, could identify infants at low risk of IBI.
 and Clinical Decision Rules in the Detection of Invasive Bacterial Infection in Febrile Young Infants")
Gomez et al conducted a prospective, single-center study of well-appearing infants with fever without a source and negative urine dipsticks.9 They identified IBI in 9 of 196 infants (4.5%) 21 days or younger and 13 of 1,331 infants (1.0%) 22-90 days old. PCT was superior to CRP and ANC for IBI detection in both age groups. However, in infants 21 days or younger, both the positive and negative LRs for PCT levels of 0.5 ng/mL or greater were poor (Table). Differences in results from the prior two studies7,8 may be related to smaller sample size and differences in patient population because this study included infants younger than 7 days and a higher proportion of infants presenting within 6 hours of fever.
CLINICAL DECISION RULES
PCT has also been incorporated into clinical decision rules for febrile young infants, primarily to identify those at low risk of either IBI or SBI. The Step-by-Step approach10 classified well-appearing febrile infants 90 days or younger as having a high risk of IBI if they were ill appearing, younger than 21 days old, had a positive urine dipstick or a PCT level of 0.5 ng/mL or greater, and classified them as intermediate risk if they had a CRP level greater than 20 mg/L or ANC level greater than 10,000/µL. The remaining infants were classified as low risk and could be managed as outpatients without lumbar puncture or empiric antibiotics. Of note, derivation of this rule excluded patients with respiratory signs or symptoms. In a prospective validation study with 2,185 infants from 11 European EDs, 87 (4.0%) had an IBI (10 with bacterial meningitis). Sequentially identifying patients as high risk using general appearance, age, and urine dipstick alone identified 80% of infants with IBI and 90% of those with bacterial meningitis. The remaining case of meningitis would have been detected by an elevated PCT. A total of 7 of 991 infants (0.7%) classified as low risk had an IBI and none had meningitis. Six of these infants had a fever duration of less than 2 hours, which would not be enough time for PCT to rise. The Step-by-Step approach, with a sensitivity of 92% and negative LR of 0.17, performed well in the ability to rule out IBI.
A clinical prediction rule developed by the Pediatric Emergency Care Applied Research Network (PECARN) found that urinalysis, ANC, and PCT performed well in identifying infants 60 days or younger at low risk for SBI and IBI.11 This prospective observational study of 1,821 infants 60 days or younger in 26 US EDs found 170 (9.3%) with SBI and 30 (1.6%) with IBI; 10 had bacterial meningitis. Only one patient with IBI was classified as low risk, a 30-day-old whose blood culture grew Enterobacter cloacae and who had a negative repeat blood culture prior to antibiotic treatment. Together, a negative urinalysis, ANC of 4,090/µL or less, and PCT level of 1.71 ng/mL or less were excellent in predicting infants at low risk for both SBI and IBI, with a sensitivity of 97% and negative LR of 0.05 for the outcome of IBI. When applying these variables with “rounded cutoffs” of PCT levels less than 0.5 ng/mL (chosen by the authors because it is a more commonly used cutoff) and ANC of 4,000/µL or less to identify infants at low risk for SBI, their performance was similar to nonrounded cutoffs. Data for the rule with rounded cutoffs in identifying infants at low risk for IBI were not presented. The PECARN study was limited by the small numbers of infants with IBIs, and the authors recommended caution when applying the rule to infants 28 days or younger.
Older clinical decision rules without PCT, such as the Rochester and modified Philadelphia criteria, use clinical and laboratory features to assess risk of IBI.3 Recent studies have evaluated these criteria in cohorts with larger numbers of infants with IBI since the derivation studies included mostly infants with SBI and small numbers with IBI.3 Gomez et al demonstrated that the Rochester criteria had lower sensitivity and higher negative LR than the Step-by-Step approach in IBI detection.10 In a case-control study of 135 cases of IBI with 249 matched controls, Aronson et al reported that the modified Philadelphia criteria had higher sensitivity but lower specificity than the Rochester criteria for IBI detection.12 The ability of the Rochester and modified Philadelphia criteria to rule out IBI, as demonstrated by the negative LR (range 0.2-0.4), was inferior to the negative LRs documented by Milcent et al8 (PCT cutoff value of 0.3 ng/mL), the Step-by-Step approach,10 and the PECARN rule11 (range 0.05-0.17; Table). However, clinical decision rules with and without PCT suffer similar limitations in having poor specificity in identifying infants likely to have IBI.
GAPS IN THE LITERATURE
Several key knowledge gaps around PCT use for diagnosing neonatal infections exist. First, the optimal use of PCT in context with other biomarkers and clinical decision rules remains uncertain. A meta-analysis of 28 studies involving over 2,600 infants that compared PCT level (with and without CRP) with isolated CRP and presepsin levels found that PCT in combination with CRP had greater diagnostic accuracy than either PCT or CRP alone, which highlights a potential opportunity for prospective study.13 Second, more data are needed on the use of PCT in the ≤ 28-day age group given the increased risk of both IBI and neonatal herpes simplex virus infection (HSV), compared with that in the second month of life. Neonatal HSV poses diagnostic challenges because half of infants will initially present as afebrile,14 and delays in initiating antiviral treatment dramatically increase the risk of permanent disability or death.15 There have been no prospective studies evaluating PCT use as part of neonatal HSV evaluations.
CLINICAL APPLICATIONS AND CONCLUSIONS
In summary, PCT can play an important adjunctive diagnostic role in the evaluation of febrile young infants, especially during the second month of life when outpatient management is more likely to be considered. PCT is superior to other inflammatory markers in identifying IBI, though the optimal cutoffs to maximize sensitivity and specificity are uncertain. Its performance characteristics, both alone and within clinical decision rules, can help clinicians better identify children at low risk for IBI when compared with clinical decision rules without PCT. PCT measurement can help clinicians miss fewer infants with IBI and identify infants for whom safely doing less is an appropriate option, which can ultimately reduce costs and hospitalizations. PCT may be particularly helpful when the clinical history is difficult to assess or when other diagnostic test results are missing or give conflicting results. Centers that use PCT will need to ensure that results are available within a short turnaround time (a few hours) in order to meaningfully affect care. Future studies of PCT in febrile infant evaluations should focus on identifying optimal strategies for incorporating this biomarker into risk assessments that present information to parents in a way that enables them to understand their child’s risk of a serious infection.
1. Tzimenatos L, Mahajan P, Dayan PS, et al. Accuracy of the urinalysis for urinary tract infections in febrile infants 60 days and younger. Pediatrics. 2018;141(2):e20173068. https://doi.org/10.1542/peds.2017-3068
2. Cruz AT, Mahajan P, Bonsu BK, et al. Accuracy of complete blood cell counts to identify febrile infants 60 days or younger with invasive bacterial infections. JAMA Pediatr. 2017;171(11):e172927. https://doi.org/10.1001/jamapediatrics.2017.2927
3. Hui C, Neto G, Tsertsvadze A, et al. Diagnosis and management of febrile infants (0-3 months). Evid Rep Technol Assess (Full Rep). 2012;(205):1-297.
4. Biondi EA, Lee B, Ralston SL, et al. Prevalence of bacteremia and bacterial meningitis in febrile neonates and infants in the second month of life: a systematic review and meta-analysis. JAMA Netw Open. 2019;2(3):e190874. https://doi.org/10.1001/jamanetworkopen.2019.0874
5. Fontela PS, Lacroix J. Procalcitonin: is this the promised biomarker for critically ill patients? J Pediatr Intensive Care. 2016;5(4):162-171. https://doi.org/10.1055/s-0036-1583279
6. Chiesa C, Natale F, Pascone R, et al. C reactive protein and procalcitonin: reference intervals for preterm and term newborns during the early neonatal period. Clin Chim Acta. 2011;412(11-12):1053-1059. https://doi.org/10.1016/j.cca.2011.02.020
7. Gomez B, Bressan S, Mintegi S, et al. Diagnostic value of procalcitonin in well-appearing young febrile infants. Pediatrics. 2012;130(5):815-822. https://doi.org/10.1542/peds.2011-3575
8. Milcent K, Faesch S, Gras-Le Guen C, et al. Use of procalcitonin assays to predict serious bacterial infection in young febrile infants. JAMA Pediatr. 2016;170(1):62-69. https://doi.org/10.1001/jamapediatrics.2015.3210
9. Gomez B, Diaz H, Carro A, Benito J, Mintegi S. Performance of blood biomarkers to rule out invasive bacterial infection in febrile infants under 21 days old. Arch Dis Child. 2019;104(6):547-551. https://doi.org/10.1136/archdischild-2018-315397
10. Gomez B, Mintegi S, Bressan S, et al. Validation of the “step-by-step” approach in the management of young febrile infants. Pediatrics. 2016;138(2):e20154381. https://doi.org/10.1542/peds.2015-4381
11. Kuppermann N, Dayan PS, Levine DA, et al. A clinical prediction rule to identify febrile infants 60 days and younger at low risk for serious bacterial infections. JAMA Pediatr. 2019;173(4):342-351. https://doi.org/10.1001/jamapediatrics.2018.5501
12. Aronson PL, Wang ME, Shapiro ED, et al. Risk stratification of febrile infants ≤60 days old without routine lumbar puncture. Pediatrics. 2018;142(6):e20181879. https://doi.org/10.1542/peds.2018-1879
13. Ruan L, Chen GY, Liu Z, et al. The combination of procalcitonin and C-reactive protein or presepsin alone improves the accuracy of diagnosis of neonatal sepsis: a meta-analysis and systematic review. Crit Care. 2018;22(1):316. https://doi.org/10.1186/s13054-018-2236-1
14. Brower L, Schondelmeyer A, Wilson P, Shah SS. Testing and empiric treatment for neonatal herpes simplex virus: challenges and opportunities for improving the value of care. Hosp Pediatr. 2016;6(2):108-111. https://doi.org/10.1542/hpeds.2015-0166
15. Long SS. Delayed acyclovir therapy in neonates with herpes simplex virus infection is associated with an increased odds of death compared with early therapy. Evid Based Med. 2013;18(2):e20. https://doi.org/10.1136/eb-2012-100674
Febrile infants 60 days of age or younger pose a significant diagnostic challenge for clinicians. Most of these infants are well appearing and do not have localizing signs or symptoms of infection, yet they may have serious bacterial infections (SBI) such as urinary tract infection (UTI), bacteremia, and meningitis. While urinalysis is highly sensitive for predicting UTI,1 older clinical decision rules and biomarkers such as white blood cell (WBC) count, absolute neutrophil count (ANC), and C-reactive protein (CRP) lack both appropriate sensitivity and specificity for identifying bacteremia and meningitis (ie, invasive bacterial infection [IBI]),2,3 which affect approximately 2.4% and 0.9% of febrile infants during the first 2 months of life, respectively.4 The lack of accurate diagnostic markers can drive overuse of laboratory testing, antibiotics, and hospitalization despite the low rates of these infections. As a result, procalcitonin (PCT) has generated interest because of its potential to serve as a more accurate biomarker for bacterial infections. This review summarizes recent literature on the diagnostic utility of PCT in the identification of IBI in febrile young infants 60 days or younger.
MECHANISM OF PROCALCITONIN
Procalcitonin is undetectable in noninflammatory states but can be detected in the blood within 4 to 6 hours after initial bacterial infection.5 Its production is stimulated throughout various tissues of the body by cytokines such as interleukin-6 and tumor necrosis factor, which are produced in response to bacterial infections. Interferon-γ, which is produced in response to viral infections, attenuates PCT production. While these characteristics suggest promise for PCT as a more specific screening test for underlying bacterial infection, there are caveats. PCT levels are physiologically elevated in the first 48 hours of life and vary with gestational age, factors that should be considered when interpreting results.6 Additionally, PCT levels can rise in other inflammatory states such as autoimmune conditions and certain malignancies,5 though these states are unlikely to confound the evaluation of febrile young infants.
DIAGNOSTIC ACCURACY OF PROCALCITONIN
Because of PCT’s potential to be more specific than other commonly used biomarkers, multiple studies have evaluated its performance characteristics in febrile young infants. Gomez et al retrospectively evaluated 1,112 well-appearing infants younger than 3 months with fever without a source in seven European emergency departments (EDs).7 Overall, 23 infants (2.1%) had IBI (1 with meningitis). A PCT level of 0.5 ng/mL or greater was the only independent risk factor for IBI (adjusted odds ratio, 21.69; 95% CI, 7.93-59.28). Four infants with IBI had a PCT level less than 0.5 ng/mL, and none of these four had meningitis. PCT was superior to CRP, ANC, and WBC in detecting IBI (area under the curve [AUC], 0.825; 95% CI, 0.698-0.952). PCT was the also the best marker for identifying IBI among 451 infants with a normal urine dipstick and fever detected ≤6 hours before presentation (AUC, 0.819; 95% CI, 0.551-1.087).
In the largest prospective study to date evaluating the diagnostic accuracy of PCT in febrile young infants, Milcent et al studied 2,047 previously healthy infants aged 7-91 days admitted for fever from 15 French EDs.8 In total, 21 (1%) had an IBI (8 with meningitis). PCT performed better than CRP, ANC, and WBC for the detection of IBI with an AUC of 0.91 (95% CI, 0.83-0.99). In a multivariable model, a PCT level of 0.3 ng/mL or greater was the only independent risk factor for IBI with an adjusted odds ratio of 40.3 (95% CI, 5.0-332). Only one infant with IBI had a PCT level less than 0.3 ng/mL. This infant was 83 days old, had 4 hours of fever, and became afebrile spontaneously prior to the blood culture revealing Streptococcus pneumoniae. PCT also performed better than CRP in the detection of IBI in infants 7-30 days of age and those with fever for less than 6 hours, though both subgroups had small numbers of infants with IBI. The authors determined that a PCT level of 0.3 ng/mL was the optimal cutoff for ruling out IBI; this cutoff had a sensitivity of 90% and negative likelihood ratio (LR) of 0.1 (Table). In contrast, the more commonly studied PCT cutoff of 0.5 ng/mL increased the negative LR to 0.2. The authors suggested that PCT, when used in the context of history, exam, and tests such as urinalysis, could identify infants at low risk of IBI.
Gomez et al conducted a prospective, single-center study of well-appearing infants with fever without a source and negative urine dipsticks.9 They identified IBI in 9 of 196 infants (4.5%) 21 days or younger and 13 of 1,331 infants (1.0%) 22-90 days old. PCT was superior to CRP and ANC for IBI detection in both age groups. However, in infants 21 days or younger, both the positive and negative LRs for PCT levels of 0.5 ng/mL or greater were poor (Table). Differences in results from the prior two studies7,8 may be related to smaller sample size and differences in patient population because this study included infants younger than 7 days and a higher proportion of infants presenting within 6 hours of fever.
CLINICAL DECISION RULES
PCT has also been incorporated into clinical decision rules for febrile young infants, primarily to identify those at low risk of either IBI or SBI. The Step-by-Step approach10 classified well-appearing febrile infants 90 days or younger as having a high risk of IBI if they were ill appearing, younger than 21 days old, had a positive urine dipstick or a PCT level of 0.5 ng/mL or greater, and classified them as intermediate risk if they had a CRP level greater than 20 mg/L or ANC level greater than 10,000/µL. The remaining infants were classified as low risk and could be managed as outpatients without lumbar puncture or empiric antibiotics. Of note, derivation of this rule excluded patients with respiratory signs or symptoms. In a prospective validation study with 2,185 infants from 11 European EDs, 87 (4.0%) had an IBI (10 with bacterial meningitis). Sequentially identifying patients as high risk using general appearance, age, and urine dipstick alone identified 80% of infants with IBI and 90% of those with bacterial meningitis. The remaining case of meningitis would have been detected by an elevated PCT. A total of 7 of 991 infants (0.7%) classified as low risk had an IBI and none had meningitis. Six of these infants had a fever duration of less than 2 hours, which would not be enough time for PCT to rise. The Step-by-Step approach, with a sensitivity of 92% and negative LR of 0.17, performed well in the ability to rule out IBI.
A clinical prediction rule developed by the Pediatric Emergency Care Applied Research Network (PECARN) found that urinalysis, ANC, and PCT performed well in identifying infants 60 days or younger at low risk for SBI and IBI.11 This prospective observational study of 1,821 infants 60 days or younger in 26 US EDs found 170 (9.3%) with SBI and 30 (1.6%) with IBI; 10 had bacterial meningitis. Only one patient with IBI was classified as low risk, a 30-day-old whose blood culture grew Enterobacter cloacae and who had a negative repeat blood culture prior to antibiotic treatment. Together, a negative urinalysis, ANC of 4,090/µL or less, and PCT level of 1.71 ng/mL or less were excellent in predicting infants at low risk for both SBI and IBI, with a sensitivity of 97% and negative LR of 0.05 for the outcome of IBI. When applying these variables with “rounded cutoffs” of PCT levels less than 0.5 ng/mL (chosen by the authors because it is a more commonly used cutoff) and ANC of 4,000/µL or less to identify infants at low risk for SBI, their performance was similar to nonrounded cutoffs. Data for the rule with rounded cutoffs in identifying infants at low risk for IBI were not presented. The PECARN study was limited by the small numbers of infants with IBIs, and the authors recommended caution when applying the rule to infants 28 days or younger.
Older clinical decision rules without PCT, such as the Rochester and modified Philadelphia criteria, use clinical and laboratory features to assess risk of IBI.3 Recent studies have evaluated these criteria in cohorts with larger numbers of infants with IBI since the derivation studies included mostly infants with SBI and small numbers with IBI.3 Gomez et al demonstrated that the Rochester criteria had lower sensitivity and higher negative LR than the Step-by-Step approach in IBI detection.10 In a case-control study of 135 cases of IBI with 249 matched controls, Aronson et al reported that the modified Philadelphia criteria had higher sensitivity but lower specificity than the Rochester criteria for IBI detection.12 The ability of the Rochester and modified Philadelphia criteria to rule out IBI, as demonstrated by the negative LR (range 0.2-0.4), was inferior to the negative LRs documented by Milcent et al8 (PCT cutoff value of 0.3 ng/mL), the Step-by-Step approach,10 and the PECARN rule11 (range 0.05-0.17; Table). However, clinical decision rules with and without PCT suffer similar limitations in having poor specificity in identifying infants likely to have IBI.
GAPS IN THE LITERATURE
Several key knowledge gaps around PCT use for diagnosing neonatal infections exist. First, the optimal use of PCT in context with other biomarkers and clinical decision rules remains uncertain. A meta-analysis of 28 studies involving over 2,600 infants that compared PCT level (with and without CRP) with isolated CRP and presepsin levels found that PCT in combination with CRP had greater diagnostic accuracy than either PCT or CRP alone, which highlights a potential opportunity for prospective study.13 Second, more data are needed on the use of PCT in the ≤ 28-day age group given the increased risk of both IBI and neonatal herpes simplex virus infection (HSV), compared with that in the second month of life. Neonatal HSV poses diagnostic challenges because half of infants will initially present as afebrile,14 and delays in initiating antiviral treatment dramatically increase the risk of permanent disability or death.15 There have been no prospective studies evaluating PCT use as part of neonatal HSV evaluations.
CLINICAL APPLICATIONS AND CONCLUSIONS
In summary, PCT can play an important adjunctive diagnostic role in the evaluation of febrile young infants, especially during the second month of life when outpatient management is more likely to be considered. PCT is superior to other inflammatory markers in identifying IBI, though the optimal cutoffs to maximize sensitivity and specificity are uncertain. Its performance characteristics, both alone and within clinical decision rules, can help clinicians better identify children at low risk for IBI when compared with clinical decision rules without PCT. PCT measurement can help clinicians miss fewer infants with IBI and identify infants for whom safely doing less is an appropriate option, which can ultimately reduce costs and hospitalizations. PCT may be particularly helpful when the clinical history is difficult to assess or when other diagnostic test results are missing or give conflicting results. Centers that use PCT will need to ensure that results are available within a short turnaround time (a few hours) in order to meaningfully affect care. Future studies of PCT in febrile infant evaluations should focus on identifying optimal strategies for incorporating this biomarker into risk assessments that present information to parents in a way that enables them to understand their child’s risk of a serious infection.
1. Tzimenatos L, Mahajan P, Dayan PS, et al. Accuracy of the urinalysis for urinary tract infections in febrile infants 60 days and younger. Pediatrics. 2018;141(2):e20173068. https://doi.org/10.1542/peds.2017-3068
2. Cruz AT, Mahajan P, Bonsu BK, et al. Accuracy of complete blood cell counts to identify febrile infants 60 days or younger with invasive bacterial infections. JAMA Pediatr. 2017;171(11):e172927. https://doi.org/10.1001/jamapediatrics.2017.2927
3. Hui C, Neto G, Tsertsvadze A, et al. Diagnosis and management of febrile infants (0-3 months). Evid Rep Technol Assess (Full Rep). 2012;(205):1-297.
4. Biondi EA, Lee B, Ralston SL, et al. Prevalence of bacteremia and bacterial meningitis in febrile neonates and infants in the second month of life: a systematic review and meta-analysis. JAMA Netw Open. 2019;2(3):e190874. https://doi.org/10.1001/jamanetworkopen.2019.0874
5. Fontela PS, Lacroix J. Procalcitonin: is this the promised biomarker for critically ill patients? J Pediatr Intensive Care. 2016;5(4):162-171. https://doi.org/10.1055/s-0036-1583279
6. Chiesa C, Natale F, Pascone R, et al. C reactive protein and procalcitonin: reference intervals for preterm and term newborns during the early neonatal period. Clin Chim Acta. 2011;412(11-12):1053-1059. https://doi.org/10.1016/j.cca.2011.02.020
7. Gomez B, Bressan S, Mintegi S, et al. Diagnostic value of procalcitonin in well-appearing young febrile infants. Pediatrics. 2012;130(5):815-822. https://doi.org/10.1542/peds.2011-3575
8. Milcent K, Faesch S, Gras-Le Guen C, et al. Use of procalcitonin assays to predict serious bacterial infection in young febrile infants. JAMA Pediatr. 2016;170(1):62-69. https://doi.org/10.1001/jamapediatrics.2015.3210
9. Gomez B, Diaz H, Carro A, Benito J, Mintegi S. Performance of blood biomarkers to rule out invasive bacterial infection in febrile infants under 21 days old. Arch Dis Child. 2019;104(6):547-551. https://doi.org/10.1136/archdischild-2018-315397
10. Gomez B, Mintegi S, Bressan S, et al. Validation of the “step-by-step” approach in the management of young febrile infants. Pediatrics. 2016;138(2):e20154381. https://doi.org/10.1542/peds.2015-4381
11. Kuppermann N, Dayan PS, Levine DA, et al. A clinical prediction rule to identify febrile infants 60 days and younger at low risk for serious bacterial infections. JAMA Pediatr. 2019;173(4):342-351. https://doi.org/10.1001/jamapediatrics.2018.5501
12. Aronson PL, Wang ME, Shapiro ED, et al. Risk stratification of febrile infants ≤60 days old without routine lumbar puncture. Pediatrics. 2018;142(6):e20181879. https://doi.org/10.1542/peds.2018-1879
13. Ruan L, Chen GY, Liu Z, et al. The combination of procalcitonin and C-reactive protein or presepsin alone improves the accuracy of diagnosis of neonatal sepsis: a meta-analysis and systematic review. Crit Care. 2018;22(1):316. https://doi.org/10.1186/s13054-018-2236-1
14. Brower L, Schondelmeyer A, Wilson P, Shah SS. Testing and empiric treatment for neonatal herpes simplex virus: challenges and opportunities for improving the value of care. Hosp Pediatr. 2016;6(2):108-111. https://doi.org/10.1542/hpeds.2015-0166
15. Long SS. Delayed acyclovir therapy in neonates with herpes simplex virus infection is associated with an increased odds of death compared with early therapy. Evid Based Med. 2013;18(2):e20. https://doi.org/10.1136/eb-2012-100674
© 2020 Society of Hospital Medicine
Association Between Bronchiolitis Patient Volume and Continuous Pulse Oximetry Monitoring in 25 Hospitals
Continuous pulse oximetry monitoring in children with bronchiolitis who don’t require supplemental oxygen is discouraged by practice guidelines and is recognized as a form of medical overuse.1-3 This practice can be associated with negative outcomes, including prolonged length of stay,4-6 increased cost of hospitalization,7 and alarm fatigue among nurses.8 Despite initiatives to reduce continuous pulse oximetry monitoring in stable patients with bronchiolitis,1,2 wide practice variation exists between hospitals.9,10 Previous studies have shown that higher prevalence of inpatient bronchiolitis admissions is associated with decreased utilization of unnecessary interventions.11 However, the relationship between pulse oximetry use and bronchiolitis prevalence has not been studied. The objective of this study is to test the hypothesis that hospital units with lower proportions of patients admitted for bronchiolitis and those with fewer general pediatrics patients relative to subspecialty patients would have higher rates of pulse oximetry overuse.
METHODS
Study Design
We conducted a substudy of the Pediatric Research in Inpatient Settings (PRIS) Network’s Eliminating Monitoring Overuse (EMO) pulse oximetry study,10,12 a 56-hospital cross-sectional study that used direct observation to measure the prevalence of continuous pulse oximetry monitoring in hospitalized infants with bronchiolitis who did not require supplemental oxygen between December 1, 2018, through March 31, 2019. This substudy was not included as part of the original aims of the project and was proposed as a separate analysis during data collection. For US sites, the Institutional Review Board (IRB) at Children’s Hospital of Philadelphia approved the study and served as the central IRB. The Research Ethics Board at University of Calgary also approved the study.
Site Selection
Hospitals with at least 60 observations were eligible for inclusion. Of the 32 hospitals that conducted the minimum observations, 25 agreed to participate (21 free-standing children’s hospitals, 3 children’s hospitals within general hospitals, and 1 community hospital).
Patient Population
The parent study included patients aged 8 weeks through 23 months with a primary diagnosis of bronchiolitis. Patients were included only if they were not receiving supplemental oxygen or nasal cannula flow at the time of data collection. The inclusion and exclusion criteria were for both the parent study and the substudy. Further inclusion and exclusion criteria have been described previously.10,12
Data Collection
In order to ascertain continuous pulse oximetry monitoring status, staff at each hospital performed observational rounds by walking to the bedside of each patient who met inclusion criteria. Additional methodology for the parent study has been published elsewhere.10,12
Bronchiolitis Admission Volume by Unit
Collaborators at each hospital gathered bronchiolitis census data from each unit that admitted patients with bronchiolitis. Units were identified prior to data collection and were characterized at the institution level based on previous local definitions. Each site was responsible for using institution-specific data collection methods for determining bronchiolitis and total admissions on each unit (eg, departmental reports or directly querying admissions data using International Classification of Diseases, Tenth Revision, diagnosis codes for bronchiolitis) over the same period as the parent study. Following data analysis, bronchiolitis admission burden was classified into five categories, based on less than 10%, 10% to less than 20%, 20% to less than 30%, 30% to less than 40%, or 40% or more of total admissions having a primary discharge diagnosis of bronchiolitis during the study period. This categorization allowed investigators to determine whether there was a dose-dependent response among categories.
Unit Composition
Site investigators also completed a survey identifying which patients were admitted to each unit (eg, general pediatrics only, medical subspecialty, surgical). Based on these results, units were further classified into seven types (Appendix Table). For the final analysis, units caring exclusively for general pediatrics patients were compared to all other unit types.
Analysis
Bronchiolitis admission burden and unit composition data were combined with observations of pulse oximetry monitoring use of patients not requiring supplemental oxygen from the parent study. We determined unadjusted observed monitoring proportions for each unit’s bronchiolitis admission burden category across all 25 hospitals. This was calculated as a simple proportion of the total number of observations during which patients were continuously monitored divided by the total number of observations performed within each unit’s admission category. We then calculated unadjusted odds ratios using the 40% and higher bronchiolitis admission burden category as a reference. We calculated similar proportions and odds ratios for the dichotomous unit composition variable. Next, we used mixed-effects logistic regression with a random intercept for each hospital to allow for differences in baseline monitoring rates, which varied widely between hospitals (2% to 92%),10 to calculate adjusted odds ratios for the unit’s admission category and unit’s composition. We also adjusted for the same covariates used in the primary study’s analysis (Table).10

RESULTS
We analyzed 2,366 observations of bronchiolitis patients from 25 hospitals. Most observations were concentrated in freestanding children’s hospitals (89%), and 50% were from hospitals with more than 250 pediatric beds. Observations were well distributed among the five categories of admit burden (Table).
In unadjusted regression, the relationship between admission burden and rate of pulse oximetry use did not appear to be dose-dependent, and 95% CIs were wide. We then analyzed the data accounting for baseline differences in hospital monitoring rates and adjusted for the covariates significantly associated with continuous pulse oximetry monitoring in the primary study’s analysis with use of a mixed-effects model. As shown in the Table, low-burden units in which bronchiolitis constituted less than 10% of total admissions had a 2.16-fold increased odds of unnecessary pulse oximetry monitoring compared to high-burden units in which bronchiolitis constituted 40% or more of total admissions (95% CI, 1.27-3.69; P = .01).
In examining the subspecialty unit composition, 596 observations (25.2%) were conducted on units exclusively caring for general pediatrics patients. In the mixed-effects model adjusted for bronchiolitis admission burden and the covariates used in the study’s primary analysis, units exclusively caring for general pediatrics patients did not have significantly different independent odds of pulse oximetry monitoring use compared to units with a mixed patient population (OR 1.01; 95% CI, 0.71-1.45; P = .95) (Appendix Table).
DISCUSSION
In this multicenter observational study of children hospitalized with bronchiolitis not concurrently receiving supplemental oxygen, units that only occasionally cared for bronchiolitis patients appeared to be more likely to overuse continuous pulse oximetry during bronchiolitis hospitalizations.
This finding was not immediately apparent when examining the raw data because of wide hospital-level variation in continuous pulse oximetry monitoring use. However, when the high degree of hospital-level variation in baseline overuse was accounted for with use of a random intercept for each hospital in the mixed-effects model, units that cared for higher proportions of bronchiolitis patients had significantly lower odds of continuous pulse oximetry monitoring use compared to units that cared for these infants infrequently.
As many institutions have subspecialized units to cultivate nursing expertise for care of certain diseases and patient populations, we hypothesized that units caring primarily for children on general pediatrics units would also have lower rates of monitoring overuse compared to mixed units. Interestingly, these units did not perform better, likely because potential cultural factors that might contribute to differences in monitoring are accounted for by bronchiolitis admission burden.
Our findings build on prior literature by demonstrating that unit-level, as well as hospital-level, factors appear to drive overuse in healthcare. A prior single-site retrospective cohort study demonstrated an association between higher prevalence of inpatient bronchiolitis and decreased use of unnecessary interventions such as laboratory and radiographic testing, as well as steroid and antibiotic administration.11 Although study of the relationship between volume and quality is not new to healthcare, to our knowledge, this study is the first to examine the relationship between pulse oximetry overuse in bronchiolitis and unit-level factors like admission burden and subspecialty composition.
There are several limitations. First, because the study population included only children not receiving supplemental oxygen, both the parent study and this substudy assumed that all observed use of pulse oximetry monitoring was overuse. In some cases, however, there may have been other compelling clinical reasons, institutional policies, or differences in pulse oximetry availability that were not captured during data collection or in our adjusted model. Second, hospitals used convenience sampling. It is possible this resulted in samples that were not representative of each unit’s underlying patient population or monitoring practice. In addition, not all of the 32 eligible sites were able to provide data related to hospital admissions at the unit level and thus are not included in our analysis. This remains a potential source of hospital-level selection bias.
CONCLUSION
These findings demonstrate that high bronchiolitis admission burden correlates with lower rates of unnecessary pulse oximetry monitoring in bronchiolitis. We speculate that these outcomes might reflect differing degrees of nursing comfort, expertise, and unit-level norms in caring for bronchiolitis patients, although our study was not designed to establish underlying causes. Identification of operating principles that underpin low pulse oximetry monitoring on high-burden units will provide guidance for decreasing unnecessary monitoring and will inform future studies seeking ways to discourage continuous pulse oximetry monitoring in low-risk infants. Given the institutional variation in monitoring rates, future studies examining both institution-wide and unit-level interventions will be necessary to decrease unnecessary pulse oximetry monitoring in bronchiolitis. Furthermore, these findings may be relevant to studying care quality in other disease processes, with bronchiolitis serving as a model illness for overuse.
Acknowledgments
The authors acknowledge the National Heart, Lung, and Blood Institute of the National Institutes of Health scientists who contributed their expertise to this project as part of the U01 Cooperative Agreement funding mechanism as federal employees conducting their official job duties: Lora Reineck, MD, MS, Karen Bienstock, MS, and Cheryl Boyce, PhD. The authors thank the executive council of the Pediatric Research in Inpatient Settings Network for their contributions to the early scientific development of this project. The network assessed a Collaborative Support Fee for access to the hospitals and support of this project.
The authors thank the PRIS Network collaborators for their major contributions to data collection (see Appendix).
1. Ralston SL, Lieberthal AS, Meissner HC, et al. Clinical practice guideline: the diagnosis, management, and prevention of bronchiolitis. Pediatrics. 2014;134(5):e1474-e1502. https://doi.org/10.1542/peds.2014-2742
2. Quinonez RA, Garber MD, Schroeder AR, et al. Choosing wisely in pediatric hospital medicine: Five opportunities for improved healthcare value. J Hosp Med. 2013;8(9):479-485. https://doi.org/10.1002/jhm.2064
3. Quinonez RA, Coon ER, Schroeder AR, Moyer VA. When technology creates uncertainty: pulse oximetry and overdiagnosis of hypoxaemia in bronchiolitis. BMJ. 2017;358:j3850. https://doi.org/10.1136/bmj.j3850
4. Cunningham S, Rodriguez A, Adams T, et al; Bronchiolitis of Infancy Discharge Study (BIDS) group. Oxygen saturation targets in infants with bronchiolitis (BIDS): a double-blind, randomised, equivalence trial. Lancet. 2015;386(9998):1041-1048. https://doi.org/10.1016/s0140-6736(15)00163-4
5. Schroeder AR, Marmor AK, Pantell RH, Newman TB. Impact of pulse oximetry and oxygen therapy on length of stay in bronchiolitis hospitalizations. Arch Pediatr Adolesc Med. 2004;158(6):527-530. https://doi.org/10.1001/archpedi.158.6.527
6. Cunningham S, McMurray A. Observational study of two oxygen saturation targets for discharge in bronchiolitis. Arch Dis Child. 2012;97(4):361-363. https://doi.org/10.1136/adc.2010.205211
7. Cunningham S, Rodriguez A, Boyd KA, McIntosh E, Lewis SC; BIDS Collaborators Group. Bronchiolitis of Infancy Discharge Study (BIDS): a multicentre, parallel-group, double-blind, randomised controlled, equivalence trial with economic evaluation. Health Technol Assess. 2015;19(71):i-172. https://doi.org/10.3310/hta19710
8. Bonafide CP, Lin R, Zander M, et al. Association between exposure to nonactionable physiologic monitor alarms and response time in a children’s hospital. J Hosp Med. 2015;10(6):345-351. https://doi.org/10.1002/jhm.2331
9. Ralston SL, Garber MD, Rice-Conboy E, et al. A multicenter collaborative to reduce unnecessary care in inpatient bronchiolitis. Pediatrics. 2016;137(1):e20150851. https://doi.org/10.1542/peds.2015-0851
10. Bonafide CP, Xiao R, Brady PW, et al; for the Pediatric Research in Inpatient Settings (PRIS) Network. Prevalence of continuous pulse oximetry monitoring in hospitalized children with bronchiolitis not requiring supplemental oxygen. JAMA. 2020;323(15):1467-1477. https://doi.org/10.1001/jama.2020.2998
11. Van Cleve WC, Christakis DA. Unnecessary care for bronchiolitis decreases with increasing inpatient prevalence of bronchiolitis. Pediatrics. 2011;128(5):e1106-e1112. https://doi.org/10.1542/peds.2011-0655
12. Rasooly IR, Beidas RS, Wolk CB, et al. Measuring overuse of continuous pulse oximetry in bronchiolitis and developing strategies for large-scale deimplementation: study protocol for a feasibility trial. Pilot Feasibility Stud. 2019;5(1):68. https://doi.org/10.1186/s40814-019-0453-2
Continuous pulse oximetry monitoring in children with bronchiolitis who don’t require supplemental oxygen is discouraged by practice guidelines and is recognized as a form of medical overuse.1-3 This practice can be associated with negative outcomes, including prolonged length of stay,4-6 increased cost of hospitalization,7 and alarm fatigue among nurses.8 Despite initiatives to reduce continuous pulse oximetry monitoring in stable patients with bronchiolitis,1,2 wide practice variation exists between hospitals.9,10 Previous studies have shown that higher prevalence of inpatient bronchiolitis admissions is associated with decreased utilization of unnecessary interventions.11 However, the relationship between pulse oximetry use and bronchiolitis prevalence has not been studied. The objective of this study is to test the hypothesis that hospital units with lower proportions of patients admitted for bronchiolitis and those with fewer general pediatrics patients relative to subspecialty patients would have higher rates of pulse oximetry overuse.
METHODS
Study Design
We conducted a substudy of the Pediatric Research in Inpatient Settings (PRIS) Network’s Eliminating Monitoring Overuse (EMO) pulse oximetry study,10,12 a 56-hospital cross-sectional study that used direct observation to measure the prevalence of continuous pulse oximetry monitoring in hospitalized infants with bronchiolitis who did not require supplemental oxygen between December 1, 2018, through March 31, 2019. This substudy was not included as part of the original aims of the project and was proposed as a separate analysis during data collection. For US sites, the Institutional Review Board (IRB) at Children’s Hospital of Philadelphia approved the study and served as the central IRB. The Research Ethics Board at University of Calgary also approved the study.
Site Selection
Hospitals with at least 60 observations were eligible for inclusion. Of the 32 hospitals that conducted the minimum observations, 25 agreed to participate (21 free-standing children’s hospitals, 3 children’s hospitals within general hospitals, and 1 community hospital).
Patient Population
The parent study included patients aged 8 weeks through 23 months with a primary diagnosis of bronchiolitis. Patients were included only if they were not receiving supplemental oxygen or nasal cannula flow at the time of data collection. The inclusion and exclusion criteria were for both the parent study and the substudy. Further inclusion and exclusion criteria have been described previously.10,12
Data Collection
In order to ascertain continuous pulse oximetry monitoring status, staff at each hospital performed observational rounds by walking to the bedside of each patient who met inclusion criteria. Additional methodology for the parent study has been published elsewhere.10,12
Bronchiolitis Admission Volume by Unit
Collaborators at each hospital gathered bronchiolitis census data from each unit that admitted patients with bronchiolitis. Units were identified prior to data collection and were characterized at the institution level based on previous local definitions. Each site was responsible for using institution-specific data collection methods for determining bronchiolitis and total admissions on each unit (eg, departmental reports or directly querying admissions data using International Classification of Diseases, Tenth Revision, diagnosis codes for bronchiolitis) over the same period as the parent study. Following data analysis, bronchiolitis admission burden was classified into five categories, based on less than 10%, 10% to less than 20%, 20% to less than 30%, 30% to less than 40%, or 40% or more of total admissions having a primary discharge diagnosis of bronchiolitis during the study period. This categorization allowed investigators to determine whether there was a dose-dependent response among categories.
Unit Composition
Site investigators also completed a survey identifying which patients were admitted to each unit (eg, general pediatrics only, medical subspecialty, surgical). Based on these results, units were further classified into seven types (Appendix Table). For the final analysis, units caring exclusively for general pediatrics patients were compared to all other unit types.
Analysis
Bronchiolitis admission burden and unit composition data were combined with observations of pulse oximetry monitoring use of patients not requiring supplemental oxygen from the parent study. We determined unadjusted observed monitoring proportions for each unit’s bronchiolitis admission burden category across all 25 hospitals. This was calculated as a simple proportion of the total number of observations during which patients were continuously monitored divided by the total number of observations performed within each unit’s admission category. We then calculated unadjusted odds ratios using the 40% and higher bronchiolitis admission burden category as a reference. We calculated similar proportions and odds ratios for the dichotomous unit composition variable. Next, we used mixed-effects logistic regression with a random intercept for each hospital to allow for differences in baseline monitoring rates, which varied widely between hospitals (2% to 92%),10 to calculate adjusted odds ratios for the unit’s admission category and unit’s composition. We also adjusted for the same covariates used in the primary study’s analysis (Table).10
RESULTS
We analyzed 2,366 observations of bronchiolitis patients from 25 hospitals. Most observations were concentrated in freestanding children’s hospitals (89%), and 50% were from hospitals with more than 250 pediatric beds. Observations were well distributed among the five categories of admit burden (Table).
In unadjusted regression, the relationship between admission burden and rate of pulse oximetry use did not appear to be dose-dependent, and 95% CIs were wide. We then analyzed the data accounting for baseline differences in hospital monitoring rates and adjusted for the covariates significantly associated with continuous pulse oximetry monitoring in the primary study’s analysis with use of a mixed-effects model. As shown in the Table, low-burden units in which bronchiolitis constituted less than 10% of total admissions had a 2.16-fold increased odds of unnecessary pulse oximetry monitoring compared to high-burden units in which bronchiolitis constituted 40% or more of total admissions (95% CI, 1.27-3.69; P = .01).
In examining the subspecialty unit composition, 596 observations (25.2%) were conducted on units exclusively caring for general pediatrics patients. In the mixed-effects model adjusted for bronchiolitis admission burden and the covariates used in the study’s primary analysis, units exclusively caring for general pediatrics patients did not have significantly different independent odds of pulse oximetry monitoring use compared to units with a mixed patient population (OR 1.01; 95% CI, 0.71-1.45; P = .95) (Appendix Table).
DISCUSSION
In this multicenter observational study of children hospitalized with bronchiolitis not concurrently receiving supplemental oxygen, units that only occasionally cared for bronchiolitis patients appeared to be more likely to overuse continuous pulse oximetry during bronchiolitis hospitalizations.
This finding was not immediately apparent when examining the raw data because of wide hospital-level variation in continuous pulse oximetry monitoring use. However, when the high degree of hospital-level variation in baseline overuse was accounted for with use of a random intercept for each hospital in the mixed-effects model, units that cared for higher proportions of bronchiolitis patients had significantly lower odds of continuous pulse oximetry monitoring use compared to units that cared for these infants infrequently.
As many institutions have subspecialized units to cultivate nursing expertise for care of certain diseases and patient populations, we hypothesized that units caring primarily for children on general pediatrics units would also have lower rates of monitoring overuse compared to mixed units. Interestingly, these units did not perform better, likely because potential cultural factors that might contribute to differences in monitoring are accounted for by bronchiolitis admission burden.
Our findings build on prior literature by demonstrating that unit-level, as well as hospital-level, factors appear to drive overuse in healthcare. A prior single-site retrospective cohort study demonstrated an association between higher prevalence of inpatient bronchiolitis and decreased use of unnecessary interventions such as laboratory and radiographic testing, as well as steroid and antibiotic administration.11 Although study of the relationship between volume and quality is not new to healthcare, to our knowledge, this study is the first to examine the relationship between pulse oximetry overuse in bronchiolitis and unit-level factors like admission burden and subspecialty composition.
There are several limitations. First, because the study population included only children not receiving supplemental oxygen, both the parent study and this substudy assumed that all observed use of pulse oximetry monitoring was overuse. In some cases, however, there may have been other compelling clinical reasons, institutional policies, or differences in pulse oximetry availability that were not captured during data collection or in our adjusted model. Second, hospitals used convenience sampling. It is possible this resulted in samples that were not representative of each unit’s underlying patient population or monitoring practice. In addition, not all of the 32 eligible sites were able to provide data related to hospital admissions at the unit level and thus are not included in our analysis. This remains a potential source of hospital-level selection bias.
CONCLUSION
These findings demonstrate that high bronchiolitis admission burden correlates with lower rates of unnecessary pulse oximetry monitoring in bronchiolitis. We speculate that these outcomes might reflect differing degrees of nursing comfort, expertise, and unit-level norms in caring for bronchiolitis patients, although our study was not designed to establish underlying causes. Identification of operating principles that underpin low pulse oximetry monitoring on high-burden units will provide guidance for decreasing unnecessary monitoring and will inform future studies seeking ways to discourage continuous pulse oximetry monitoring in low-risk infants. Given the institutional variation in monitoring rates, future studies examining both institution-wide and unit-level interventions will be necessary to decrease unnecessary pulse oximetry monitoring in bronchiolitis. Furthermore, these findings may be relevant to studying care quality in other disease processes, with bronchiolitis serving as a model illness for overuse.
Acknowledgments
The authors acknowledge the National Heart, Lung, and Blood Institute of the National Institutes of Health scientists who contributed their expertise to this project as part of the U01 Cooperative Agreement funding mechanism as federal employees conducting their official job duties: Lora Reineck, MD, MS, Karen Bienstock, MS, and Cheryl Boyce, PhD. The authors thank the executive council of the Pediatric Research in Inpatient Settings Network for their contributions to the early scientific development of this project. The network assessed a Collaborative Support Fee for access to the hospitals and support of this project.
The authors thank the PRIS Network collaborators for their major contributions to data collection (see Appendix).
1. Ralston SL, Lieberthal AS, Meissner HC, et al. Clinical practice guideline: the diagnosis, management, and prevention of bronchiolitis. Pediatrics. 2014;134(5):e1474-e1502. https://doi.org/10.1542/peds.2014-2742
2. Quinonez RA, Garber MD, Schroeder AR, et al. Choosing wisely in pediatric hospital medicine: Five opportunities for improved healthcare value. J Hosp Med. 2013;8(9):479-485. https://doi.org/10.1002/jhm.2064
3. Quinonez RA, Coon ER, Schroeder AR, Moyer VA. When technology creates uncertainty: pulse oximetry and overdiagnosis of hypoxaemia in bronchiolitis. BMJ. 2017;358:j3850. https://doi.org/10.1136/bmj.j3850
4. Cunningham S, Rodriguez A, Adams T, et al; Bronchiolitis of Infancy Discharge Study (BIDS) group. Oxygen saturation targets in infants with bronchiolitis (BIDS): a double-blind, randomised, equivalence trial. Lancet. 2015;386(9998):1041-1048. https://doi.org/10.1016/s0140-6736(15)00163-4
5. Schroeder AR, Marmor AK, Pantell RH, Newman TB. Impact of pulse oximetry and oxygen therapy on length of stay in bronchiolitis hospitalizations. Arch Pediatr Adolesc Med. 2004;158(6):527-530. https://doi.org/10.1001/archpedi.158.6.527
6. Cunningham S, McMurray A. Observational study of two oxygen saturation targets for discharge in bronchiolitis. Arch Dis Child. 2012;97(4):361-363. https://doi.org/10.1136/adc.2010.205211
7. Cunningham S, Rodriguez A, Boyd KA, McIntosh E, Lewis SC; BIDS Collaborators Group. Bronchiolitis of Infancy Discharge Study (BIDS): a multicentre, parallel-group, double-blind, randomised controlled, equivalence trial with economic evaluation. Health Technol Assess. 2015;19(71):i-172. https://doi.org/10.3310/hta19710
8. Bonafide CP, Lin R, Zander M, et al. Association between exposure to nonactionable physiologic monitor alarms and response time in a children’s hospital. J Hosp Med. 2015;10(6):345-351. https://doi.org/10.1002/jhm.2331
9. Ralston SL, Garber MD, Rice-Conboy E, et al. A multicenter collaborative to reduce unnecessary care in inpatient bronchiolitis. Pediatrics. 2016;137(1):e20150851. https://doi.org/10.1542/peds.2015-0851
10. Bonafide CP, Xiao R, Brady PW, et al; for the Pediatric Research in Inpatient Settings (PRIS) Network. Prevalence of continuous pulse oximetry monitoring in hospitalized children with bronchiolitis not requiring supplemental oxygen. JAMA. 2020;323(15):1467-1477. https://doi.org/10.1001/jama.2020.2998
11. Van Cleve WC, Christakis DA. Unnecessary care for bronchiolitis decreases with increasing inpatient prevalence of bronchiolitis. Pediatrics. 2011;128(5):e1106-e1112. https://doi.org/10.1542/peds.2011-0655
12. Rasooly IR, Beidas RS, Wolk CB, et al. Measuring overuse of continuous pulse oximetry in bronchiolitis and developing strategies for large-scale deimplementation: study protocol for a feasibility trial. Pilot Feasibility Stud. 2019;5(1):68. https://doi.org/10.1186/s40814-019-0453-2
© 2020 Society of Hospital Medicine