User login
The Effect of Hospital Safety Net Status on the Association Between Bundled Payment Participation and Changes in Medical Episode Outcomes
Bundled payments represent one of the most prominent value-based payment arrangements nationwide. Under this payment approach, hospitals assume responsibility for quality and costs across discrete episodes of care. Hospitals that maintain quality while achieving cost reductions are eligible for financial incentives, whereas those that do not are subject to financial penalties.
To date, the largest completed bundled payment program nationwide is Medicare’s Bundled Payments for Care Improvement (BPCI) initiative. Among four different participation models in BPCI, hospital enrollment was greatest in Model 2, in which episodes spanned from hospitalization through 90 days of post–acute care. The overall results from BPCI Model 2 have been positive: hospitals participating in both common surgical episodes, such as joint replacement surgery, and medical episodes, such as acute myocardial infarction (AMI) and congestive heart failure (CHF), have demonstrated long-term financial savings with stable quality performance.1,2
Safety net hospitals that disproportionately serve low-income patients may fare differently than other hospitals under bundled payment models. At baseline, these hospitals typically have fewer financial resources, which may limit their ability to implement measures to standardize care during hospitalization (eg, clinical pathways) or after discharge (eg, postdischarge programs and other strategies to reduce readmissions).3 Efforts to redesign care may be further complicated by greater clinical complexity and social and structural determinants of health among patients seeking care at safety net hospitals. Given the well-known interactions between social determinants and health conditions, these factors are highly relevant for patients hospitalized at safety net hospitals for acute medical events or exacerbations of chronic conditions.
Existing evidence has shown that safety net hospitals have not performed as well as other hospitals in other value-based reforms.4-8 In the context of bundled payments for joint replacement surgery, safety net hospitals have been less likely to achieve financial savings but more likely to receive penalties.9-11 Moreover, the savings achieved by safety net hospitals have been smaller than those achieved by non–safety net hospitals.12
Despite these concerning findings, there are few data about how safety net hospitals have fared under bundled payments for common medical conditions. To address this critical knowledge gap, we evaluated the effect of hospital safety net status on the association between BPCI Model 2 participation and changes in outcomes for medical condition episodes.
METHODS
This study was approved by the University of Pennsylvania Institutional Review Board with a waiver of informed consent.
Data
We used 100% Medicare claims data from 2011 to 2016 for patients receiving care at hospitals participating in BPCI Model 2 for one of four common medical condition episodes: AMI, pneumonia, CHF, and chronic obstructive pulmonary disease (COPD). A 20% random national sample was used for patients hospitalized at nonparticipant hospitals. Publicly available data from the Centers for Medicare & Medicaid Services (CMS) were used to identify hospital enrollment in BPCI Model 2, while data from the 2017 CMS Impact File were used to quantify each hospital’s disproportionate patient percentage (DPP), which reflects the proportion of Medicaid and low-income Medicare beneficiaries served and determines a hospital’s eligibility to earn disproportionate share hospital payments.
Data from the 2011 American Hospital Association Annual Survey were used to capture hospital characteristics, such as number of beds, teaching status, and profit status, while data from the Medicare provider of service, beneficiary summary, and accountable care organization files were used to capture additional hospital characteristics and market characteristics, such as population size and Medicare Advantage penetration. The Medicare Provider Enrollment, Chain, and Ownership System file was used to identify and remove BPCI episodes from physician group practices. State-level data about area deprivation index—a census tract–based measure that incorporates factors such as income, education, employment, and housing quality to describe socioeconomic disadvantage among neighborhoods—were used to define socioeconomically disadvantaged areas as those in the top 20% of area deprivation index statewide.13 Markets were defined using hospital referral regions.14
Study Periods and Hospital Groups
Our analysis spanned the period between January 1, 2011, and December 31, 2016. We separated this period into a baseline period (January 2011–September 2013) prior to the start of BPCI and a subsequent BPCI period (October 2013–December 2016).
We defined any hospitals participating in BPCI Model 2 across this period for any of the four included medical condition episodes as BPCI hospitals. Because hospitals were able to enter or exit BPCI over time, and enrollment data were provided by CMS as quarterly participation files, we were able to identify dates of entry into or exit from BPCI over time by hospital-condition pairs. Hospitals were considered BPCI hospitals until the end of the study period, regardless of subsequent exit.
We defined non-BPCI hospitals as those that never participated in the program and had 10 or more admissions in the BPCI period for the included medical condition episodes. We used this approach to minimize potential bias arising from BPCI entry and exit over time.
Across both BPCI and non-BPCI hospital groups, we followed prior methods and defined safety net hospitals based on a hospital’s DPP.15 Specifically, safety net hospitals were those in the top quartile of DPP among all hospitals nationwide, and hospitals in the other three quartiles were defined as non–safety net hospitals.9,12
Study Sample and Episode Construction
Our study sample included Medicare fee-for-service beneficiaries admitted to BPCI and non-BPCI hospitals for any of the four medical conditions of interest. We adhered to BPCI program rules, which defined each episode type based on a set of Medicare Severity Diagnosis Related Group (MS-DRG) codes (eg, myocardial infarction episodes were defined as MS-DRGs 280-282). From this sample, we excluded beneficiaries with end-stage renal disease or insurance coverage through Medicare Advantage, as well as beneficiaries who died during the index hospital admission, had any non–Inpatient Prospective Payment System claims, or lacked continuous primary Medicare fee-for-service coverage either during the episode or in the 12 months preceding it.
We constructed 90-day medical condition episodes that began with hospital admission and spanned 90 days after hospital discharge. To avoid bias arising from CMS rules related to precedence (rules for handling how overlapping episodes are assigned to hospitals), we followed prior methods and constructed naturally occurring episodes by assigning overlapping ones to the earlier hospital admission.2,16 From this set of episodes, we identified those for AMI, CHF, COPD, and pneumonia.
Exposure and Covariate Variables
Our study exposure was the interaction between hospital safety net status and hospital BPCI participation, which captured whether the association between BPCI participation and outcomes varied by safety net status (eg, whether differential changes in an outcome related to BPCI participation were different for safety net and non–safety net hospitals in the program). BPCI participation was defined using a time-varying indicator of BPCI participation to distinguish between episodes occurring under the program (ie, after a hospital began participating) or before participation in it. Covariates were chosen based on prior studies and included patient variables such as age, sex, Elixhauser comorbidities, frailty, and Medicare/Medicaid dual-eligibility status.17-23 Additionally, our analysis included market variables such as population size and Medicare Advantage penetration.
Outcome Variables
The prespecified primary study outcome was standardized 90-day postdischarge spending. This outcome was chosen owing to the lack of variation in standardized index hospitalization spending given the MS-DRG system and prior work suggesting that bundled payment participants instead targeted changes to postdischarge utilization and spending.2 Secondary outcomes included 90-day unplanned readmission rates, 90-day postdischarge mortality rates, discharge to institutional post–acute care providers (defined as either skilled nursing facilities [SNFs] or inpatient rehabilitation facilities), discharge home with home health agency services, and—among patients discharged to SNFs—SNF length of stay (LOS), measured in number of days.
Statistical Analysis
We described the characteristics of patients and hospitals in our samples. In adjusted analyses, we used a series of difference-in-differences (DID) generalized linear models to conduct a heterogeneity analysis evaluating whether the relationship between hospital BPCI participation and medical condition episode outcomes varied based on hospital safety net status.
In these models, the DID estimator was a time-varying indicator of hospital BPCI participation (equal to 1 for episodes occurring during the BPCI period at BPCI hospitals after they initiated participation; 0 otherwise) together with hospital and quarter-time fixed effects. To examine differences in the association between BPCI and episode outcomes by hospital safety net status—that is, whether there was heterogeneity in the outcome changes between safety net and non–safety net hospitals participating in BPCI—our models also included an interaction term between hospital safety net status and the time-varying BPCI participation term (Appendix Methods). In this approach, BPCI safety net and BPCI non–safety net hospitals were compared with non-BPCI hospitals as the comparison group. The comparisons were chosen to yield the most policy-salient findings, since Medicare evaluated hospitals in BPCI, whether safety net or not, by comparing their performance to nonparticipating hospitals, whether safety net or not.
All models controlled for patient and time-varying market characteristics and included hospital fixed effects (to account for time-invariant hospital market characteristics) and MS-DRG fixed effects. All outcomes were evaluated using models with identity links and normal distributions (ie, ordinary least squares). These variables and models were applied to data from the baseline period to examine consistency with the parallel trends assumption. Overall, Wald tests did not indicate divergent baseline period trends in outcomes between BPCI and non-BPCI hospitals (Appendix Figure 1) or BPCI safety net versus BPCI non–safety net hospitals (Appendix Figure 2).
We conducted sensitivity analyses to evaluate the robustness of our results. First, instead of comparing differential changes at BPCI safety net vs BPCI non–safety net hospitals (ie, evaluating safety net status among BPCI hospitals), we evaluated changes at BPCI safety net vs non-BPCI safety net hospitals compared with changes at BPCI non–safety net vs non-BPCI non–safety net hospitals (ie, marginal differences in the changes associated with BPCI participation among safety net vs non–safety net hospitals). Because safety net hospitals in BPCI were compared with nonparticipating safety net hospitals, and non–safety net hospitals in BPCI were compared with nonparticipating non–safety net hospitals, this set of analyses helped address potential concerns about unobservable differences between safety net and non–safety net organizations and their potential impact on our findings.
Second, we used an alternative, BPCI-specific definition for safety net hospitals: instead of defining safety net status based on all hospitals nationwide, we defined it only among BPCI hospitals (safety net hospitals defined as those in the top quartile of DPP among all BPCI hospitals) and non-BPCI hospitals (safety net hospitals defined as those in the top quartile of DPP among all non-BPCI hospitals). Third, we repeated our main analyses using models with standard errors clustered at the hospital level and without hospital fixed effects. Fourth, we repeated analysis using models with alternative nonlinear link functions and outcome distributions and without hospital fixed effects.
Statistical tests were two-tailed and considered significant at α = .05 for the primary outcome. Statistical analyses were conducted using SAS 9.4 (SAS Institute, Inc.).
RESULTS
Our sample consisted of 3066 hospitals nationwide that collectively provided medical condition episode care to a total of 1,611,848 Medicare fee-for-service beneficiaries. This sample included 238 BPCI hospitals and 2769 non-BPCI hospitals (Table 1, Appendix Table 1).
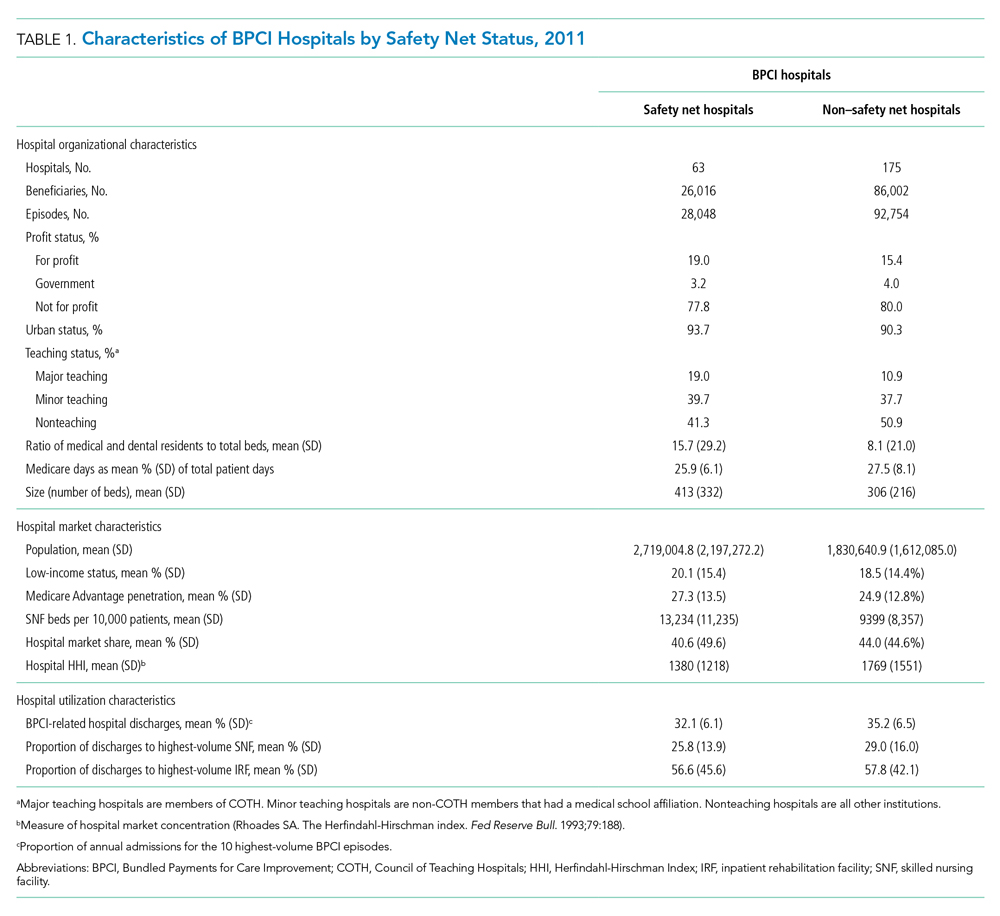
Among BPCI hospitals, 63 were safety net and 175 were non–safety net hospitals. Compared with non–safety net hospitals, safety net hospitals tended to be larger and were more likely to be urban teaching hospitals. Safety net hospitals also tended to be located in areas with larger populations, more low-income individuals, and greater Medicare Advantage penetration.
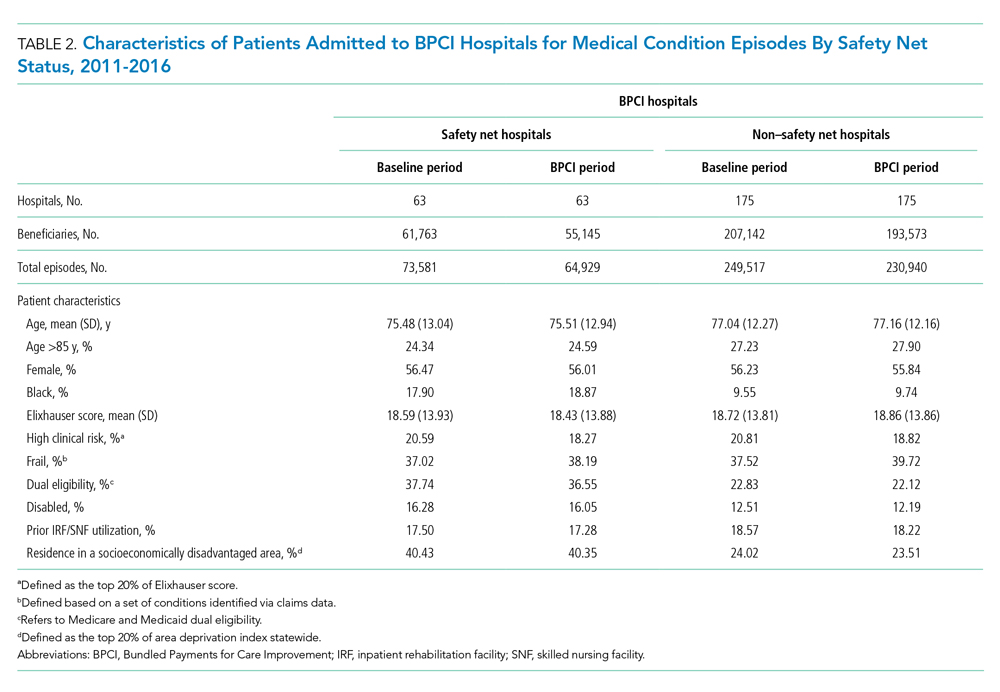
In both the baseline and BPCI periods, there were differences in several characteristics for patients admitted to safety net vs non–safety net hospitals (Table 2; Appendix Table 2). Among BPCI hospitals, in both periods, patients admitted at safety net hospitals were younger and more likely to be Black, be Medicare/Medicaid dual eligible, and report having a disability than patients admitted to non–safety net hospitals. Patients admitted to safety net hospitals were also more likely to reside in socioeconomically disadvantaged areas.
Safety Net Status Among BPCI Hospitals
In the baseline period (Appendix Table 3), postdischarge spending was slightly greater among patients admitted to BPCI safety net hospitals ($18,817) than those admitted to BPCI non–safety net hospitals ($18,335). There were also small differences in secondary outcomes between the BPCI safety net and non−safety net groups.
In adjusted analyses evaluating heterogeneity in the effect of BPCI participation between safety net and non–safety net hospitals (Figure 1), differential changes in postdischarge spending between baseline and BPCI participation periods did not differ between safety net and non–safety net hospitals participating in BPCI (aDID, $40; 95% CI, –$254 to $335; P = .79). 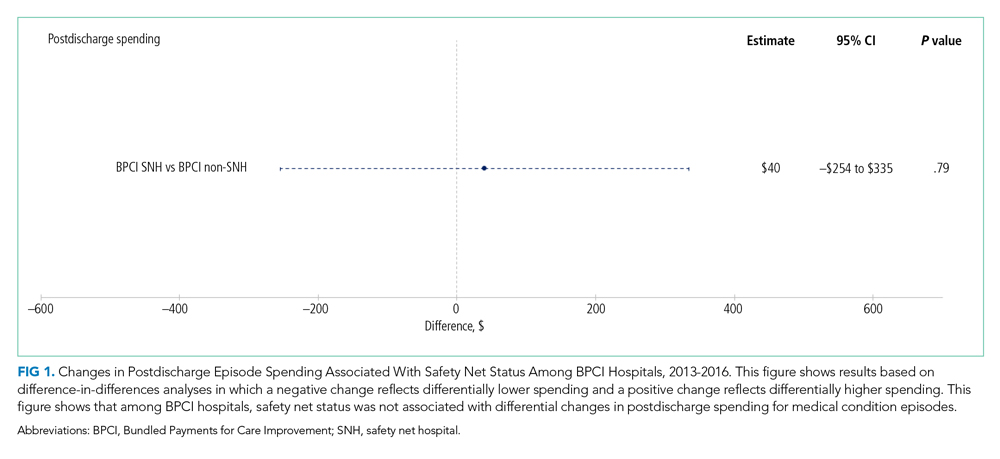

Sensitivity Analysis
Analyses of BPCI participation among safety net vs non–safety net hospitals nationwide yielded results that were similar to those from our main analyses (Appendix Figures 4, 5, and 6). Compared with BPCI participation among non–safety net hospitals, participation among safety net hospitals was associated with a differential increase from baseline to BPCI periods in discharge to institutional post–acute care providers (aDID, 1.07 percentage points; 95% CI, 0.47-1.67 percentage points; P < .001), but no differential changes between baseline and BPCI periods in postdischarge spending (aDID, –$199;95% CI, –$461 to $63; P = .14), SNF LOS (aDID, –0.22 days; 95% CI, –0.54 to 0.09 days; P = .16), or other secondary outcomes.
Replicating our main analyses using an alternative, BPCI-specific definition of safety net hospitals yielded similar results overall (Appendix Table 4; Appendix Figures 7, 8, and 9). There were no differential changes between baseline and BPCI periods in postdischarge spending between BPCI safety net and BPCI non–safety net hospitals (aDID, $111; 95% CI, –$189 to $411; P = .47). Results for secondary outcomes were also qualitatively similar to results from main analyses, with the exception that among BPCI hospitals, safety net hospitals had a differentially higher SNF LOS than non–safety net hospitals between baseline and BPCI periods (aDID, 0.38 days; 95% CI, 0.02-0.74 days; P = .04).
Compared with results from our main analysis, findings were qualitatively similar overall in analyses using models with hospital-clustered standard errors and without hospital fixed effects (Appendix Figures 10, 11, and 12) as well as models with alternative link functions and outcome distributions and without hospital fixed effects (Appendix Figures 13, 14, and 15).
Discussion
This analysis builds on prior work by evaluating how hospital safety net status affected the known association between bundled payment participation and decreased spending and stable quality for medical condition episodes. Although safety net status did not appear to affect those relationships, it did affect the relationship between participation and post–acute care utilization. These results have three main implications.
First, our results suggest that policymakers should continue engaging safety net hospitals in medical condition bundled payments while monitoring for unintended consequences. Our findings with regard to spending provide some reassurance that safety net hospitals can potentially achieve savings while maintaining quality under bundled payments, similar to other types of hospitals. However, the differences in patient populations and post–acute care utilization patterns suggest that policymakers should continue to carefully monitor for disparities based on hospital safety net status and consider implementing measures that have been used in other payment reforms to support safety net organizations. Such measures could involve providing customized technical assistance or evaluating performance using “peer groups” that compare performance among safety net hospitals alone rather than among all hospitals.24,25
Second, our findings underscore potential challenges that safety net hospitals may face when attempting to redesign care. For instance, among hospitals accepting bundled payments for medical conditions, successful strategies in BPCI have often included maintaining the proportion of patients discharged to institutional post–acute care providers while reducing SNF LOS.2 However, in our study, discharge to institutional post–acute care providers actually increased among safety net hospitals relative to other hospitals while SNF LOS did not decrease. Additionally, while other hospitals in bundled payments have exhibited differentially greater discharge home with home health services, we found that safety net hospitals did not. These represent areas for future work, particularly because little is known about how safety net hospitals coordinate post–acute care (eg, the extent to which safety net hospitals integrate with post–acute care providers or coordinate home-based care for vulnerable patient populations).
Third, study results offer insight into potential challenges to practice changes. Compared with other hospitals, safety net hospitals in our analysis provided medical condition episode care to more Black, Medicare/Medicaid dual-eligible, and disabled patients, as well as individuals living in socioeconomically disadvantaged areas. Collectively, these groups may face more challenging socioeconomic circumstances or existing disparities. The combination of these factors and limited financial resources at safety net hospitals could complicate their ability to manage transitions of care after hospitalization by shifting discharge away from high-intensity institutional post–acute care facilities.
Our analysis has limitations. First, given the observational study design, findings are subject to residual confounding and selection bias. For instance, findings related to post–acute care utilization could have been influenced by unobservable changes in market supply and other factors. However, we mitigated these risks using a quasi-experimental methodology that also directly accounted for multiple patient, hospital, and market characteristics and also used fixed effects to account for unobserved heterogeneity. Second, in studying BPCI Model 2, we evaluated one model within one bundled payment program. However, BPCI Model 2 encompassed a wide range of medical conditions, and both this scope and program design have served as the direct basis for subsequent bundled payment models, such as the ongoing BPCI Advanced and other forthcoming programs.26 Third, while our analysis evaluated multiple aspects of patient complexity, individuals may be “high risk” owing to several clinical and social determinants. Future work should evaluate different features of patient risk and how they affect outcomes under payment models such as bundled payments.
CONCLUSION
Safety net status appeared to affect the relationship between bundled payment participation and post–acute care utilization, but not episode spending. These findings suggest that policymakers could support safety net hospitals within bundled payment programs and consider safety net status when evaluating them.
1. Navathe AS, Emanuel EJ, Venkataramani AS, et al. Spending and quality after three years of Medicare’s voluntary bundled payment for joint replacement surgery. Health Aff (Millwood). 2020;39(1):58-66. https://doi.org/10.1377/hlthaff.2019.00466
2. Rolnick JA, Liao JM, Emanuel EJ, et al. Spending and quality after three years of Medicare’s bundled payments for medical conditions: quasi-experimental difference-in-differences study. BMJ. 2020;369:m1780. https://doi.org/10.1136/bmj.m1780
3. Figueroa JF, Joynt KE, Zhou X, Orav EJ, Jha AK. Safety-net hospitals face more barriers yet use fewer strategies to reduce readmissions. Med Care. 2017;55(3):229-235. https://doi.org/10.1097/MLR.0000000000000687
4. Werner RM, Goldman LE, Dudley RA. Comparison of change in quality of care between safety-net and non–safety-net hospitals. JAMA. 2008;299(18):2180-2187. https://doi/org/10.1001/jama.299.18.2180
5. Ross JS, Bernheim SM, Lin Z, et al. Based on key measures, care quality for Medicare enrollees at safety-net and non–safety-net hospitals was almost equal. Health Aff (Millwood). 2012;31(8):1739-1748. https://doi.org/10.1377/hlthaff.2011.1028
6. Gilman M, Adams EK, Hockenberry JM, Milstein AS, Wilson IB, Becker ER. Safety-net hospitals more likely than other hospitals to fare poorly under Medicare’s value-based purchasing. Health Aff (Millwood). 2015;34(3):398-405. https://doi.org/10.1377/hlthaff.2014.1059
7. Joynt KE, Jha AK. Characteristics of hospitals receiving penalties under the Hospital Readmissions Reduction Program. JAMA. 2013;309(4):342-343. https://doi.org/10.1001/jama.2012.94856
8. Rajaram R, Chung JW, Kinnier CV, et al. Hospital characteristics associated with penalties in the Centers for Medicare & Medicaid Services Hospital-Acquired Condition Reduction Program. JAMA. 2015;314(4):375-383. https://doi.org/10.1001/jama.2015.8609
9. Navathe AS, Liao JM, Shah Y, et al. Characteristics of hospitals earning savings in the first year of mandatory bundled payment for hip and knee surgery. JAMA. 2018;319(9):930-932. https://doi.org/10.1001/jama.2018.0678
10. Thirukumaran CP, Glance LG, Cai X, Balkissoon R, Mesfin A, Li Y. Performance of safety-net hospitals in year 1 of the Comprehensive Care for Joint Replacement Model. Health Aff (Millwood). 2019;38(2):190-196. https://doi.org/10.1377/hlthaff.2018.05264
11. Thirukumaran CP, Glance LG, Cai X, Kim Y, Li Y. Penalties and rewards for safety net vs non–safety net hospitals in the first 2 years of the Comprehensive Care for Joint Replacement Model. JAMA. 2019;321(20):2027-2030. https://doi.org/10.1001/jama.2019.5118
12. Kim H, Grunditz JI, Meath THA, Quiñones AR, Ibrahim SA, McConnell KJ. Level of reconciliation payments by safety-net hospital status under the first year of the Comprehensive Care for Joint Replacement Program. JAMA Surg. 2019;154(2):178-179. https://doi.org/10.1001/jamasurg.2018.3098
13. Department of Medicine, University of Wisconsin School of Medicine and Public Health. Neighborhood Atlas. Accessed March 1, 2021. https://www.neighborhoodatlas.medicine.wisc.edu/
14. Dartmouth Atlas Project. The Dartmouth Atlas of Health Care. Accessed March 1, 2021. https://www.dartmouthatlas.org/
15. Chatterjee P, Joynt KE, Orav EJ, Jha AK. Patient experience in safety-net hospitals: implications for improving care and value-based purchasing. Arch Intern Med. 2012;172(16):1204-1210. https://doi.org/10.1001/archinternmed.2012.3158
16. Rolnick JA, Liao JM, Navathe AS. Programme design matters—lessons from bundled payments in the US. June 17, 2020. Accessed March 1, 2021. https://blogs.bmj.com/bmj/2020/06/17/programme-design-matters-lessons-from-bundled-payments-in-the-us
17. Dummit LA, Kahvecioglu D, Marrufo G, et al. Association between hospital participation in a Medicare bundled payment initiative and payments and quality outcomes for lower extremity joint replacement episodes. JAMA. 2016;316(12):1267-1278. https://doi.org/10.1001/jama.2016.12717
18. Navathe AS, Liao JM, Dykstra SE, et al. Association of hospital participation in a Medicare bundled payment program with volume and case mix of lower extremity joint replacement episodes. JAMA. 2018;320(9):901-910. https://doi.org/10.1001/jama.2018.12345
19. Joynt Maddox KE, Orav EJ, Zheng J, Epstein AM. Evaluation of Medicare’s bundled payments initiative for medical conditions. N Engl J Med. 2018;379(3):260-269. https://doi.org/10.1056/NEJMsa1801569
20. Navathe AS, Emanuel EJ, Venkataramani AS, et al. Spending and quality after three years of Medicare’s voluntary bundled payment for joint replacement surgery. Health Aff (Millwood). 2020;39(1):58-66. https://doi.org/10.1377/hlthaff.2019.00466
21. Liao JM, Emanuel EJ, Venkataramani AS, et al. Association of bundled payments for joint replacement surgery and patient outcomes with simultaneous hospital participation in accountable care organizations. JAMA Netw Open. 2019;2(9):e1912270. https://doi.org/10.1001/jamanetworkopen.2019.12270
22. Kim DH, Schneeweiss S. Measuring frailty using claims data for pharmacoepidemiologic studies of mortality in older adults: evidence and recommendations. Pharmacoepidemiol Drug Saf. 2014;23(9):891-901. https://doi.org/10.1002/pds.3674
23. Joynt KE, Figueroa JF, Beaulieu N, Wild RC, Orav EJ, Jha AK. Segmenting high-cost Medicare patients into potentially actionable cohorts. Healthc (Amst). 2017;5(1-2):62-67. https://doi.org/10.1016/j.hjdsi.2016.11.002
24. Quality Payment Program. Small, underserved, and rural practices. Accessed March 1, 2021. https://qpp.cms.gov/about/small-underserved-rural-practices
25. McCarthy CP, Vaduganathan M, Patel KV, et al. Association of the new peer group–stratified method with the reclassification of penalty status in the Hospital Readmission Reduction Program. JAMA Netw Open. 2019;2(4):e192987. https://doi.org/10.1001/jamanetworkopen.2019.2987
26. Centers for Medicare & Medicaid Services. BPCI Advanced. Updated September 16, 2021. Accessed October 18, 2021. https://innovation.cms.gov/innovation-models/bpci-advanced
Bundled payments represent one of the most prominent value-based payment arrangements nationwide. Under this payment approach, hospitals assume responsibility for quality and costs across discrete episodes of care. Hospitals that maintain quality while achieving cost reductions are eligible for financial incentives, whereas those that do not are subject to financial penalties.
To date, the largest completed bundled payment program nationwide is Medicare’s Bundled Payments for Care Improvement (BPCI) initiative. Among four different participation models in BPCI, hospital enrollment was greatest in Model 2, in which episodes spanned from hospitalization through 90 days of post–acute care. The overall results from BPCI Model 2 have been positive: hospitals participating in both common surgical episodes, such as joint replacement surgery, and medical episodes, such as acute myocardial infarction (AMI) and congestive heart failure (CHF), have demonstrated long-term financial savings with stable quality performance.1,2
Safety net hospitals that disproportionately serve low-income patients may fare differently than other hospitals under bundled payment models. At baseline, these hospitals typically have fewer financial resources, which may limit their ability to implement measures to standardize care during hospitalization (eg, clinical pathways) or after discharge (eg, postdischarge programs and other strategies to reduce readmissions).3 Efforts to redesign care may be further complicated by greater clinical complexity and social and structural determinants of health among patients seeking care at safety net hospitals. Given the well-known interactions between social determinants and health conditions, these factors are highly relevant for patients hospitalized at safety net hospitals for acute medical events or exacerbations of chronic conditions.
Existing evidence has shown that safety net hospitals have not performed as well as other hospitals in other value-based reforms.4-8 In the context of bundled payments for joint replacement surgery, safety net hospitals have been less likely to achieve financial savings but more likely to receive penalties.9-11 Moreover, the savings achieved by safety net hospitals have been smaller than those achieved by non–safety net hospitals.12
Despite these concerning findings, there are few data about how safety net hospitals have fared under bundled payments for common medical conditions. To address this critical knowledge gap, we evaluated the effect of hospital safety net status on the association between BPCI Model 2 participation and changes in outcomes for medical condition episodes.
METHODS
This study was approved by the University of Pennsylvania Institutional Review Board with a waiver of informed consent.
Data
We used 100% Medicare claims data from 2011 to 2016 for patients receiving care at hospitals participating in BPCI Model 2 for one of four common medical condition episodes: AMI, pneumonia, CHF, and chronic obstructive pulmonary disease (COPD). A 20% random national sample was used for patients hospitalized at nonparticipant hospitals. Publicly available data from the Centers for Medicare & Medicaid Services (CMS) were used to identify hospital enrollment in BPCI Model 2, while data from the 2017 CMS Impact File were used to quantify each hospital’s disproportionate patient percentage (DPP), which reflects the proportion of Medicaid and low-income Medicare beneficiaries served and determines a hospital’s eligibility to earn disproportionate share hospital payments.
Data from the 2011 American Hospital Association Annual Survey were used to capture hospital characteristics, such as number of beds, teaching status, and profit status, while data from the Medicare provider of service, beneficiary summary, and accountable care organization files were used to capture additional hospital characteristics and market characteristics, such as population size and Medicare Advantage penetration. The Medicare Provider Enrollment, Chain, and Ownership System file was used to identify and remove BPCI episodes from physician group practices. State-level data about area deprivation index—a census tract–based measure that incorporates factors such as income, education, employment, and housing quality to describe socioeconomic disadvantage among neighborhoods—were used to define socioeconomically disadvantaged areas as those in the top 20% of area deprivation index statewide.13 Markets were defined using hospital referral regions.14
Study Periods and Hospital Groups
Our analysis spanned the period between January 1, 2011, and December 31, 2016. We separated this period into a baseline period (January 2011–September 2013) prior to the start of BPCI and a subsequent BPCI period (October 2013–December 2016).
We defined any hospitals participating in BPCI Model 2 across this period for any of the four included medical condition episodes as BPCI hospitals. Because hospitals were able to enter or exit BPCI over time, and enrollment data were provided by CMS as quarterly participation files, we were able to identify dates of entry into or exit from BPCI over time by hospital-condition pairs. Hospitals were considered BPCI hospitals until the end of the study period, regardless of subsequent exit.
We defined non-BPCI hospitals as those that never participated in the program and had 10 or more admissions in the BPCI period for the included medical condition episodes. We used this approach to minimize potential bias arising from BPCI entry and exit over time.
Across both BPCI and non-BPCI hospital groups, we followed prior methods and defined safety net hospitals based on a hospital’s DPP.15 Specifically, safety net hospitals were those in the top quartile of DPP among all hospitals nationwide, and hospitals in the other three quartiles were defined as non–safety net hospitals.9,12
Study Sample and Episode Construction
Our study sample included Medicare fee-for-service beneficiaries admitted to BPCI and non-BPCI hospitals for any of the four medical conditions of interest. We adhered to BPCI program rules, which defined each episode type based on a set of Medicare Severity Diagnosis Related Group (MS-DRG) codes (eg, myocardial infarction episodes were defined as MS-DRGs 280-282). From this sample, we excluded beneficiaries with end-stage renal disease or insurance coverage through Medicare Advantage, as well as beneficiaries who died during the index hospital admission, had any non–Inpatient Prospective Payment System claims, or lacked continuous primary Medicare fee-for-service coverage either during the episode or in the 12 months preceding it.
We constructed 90-day medical condition episodes that began with hospital admission and spanned 90 days after hospital discharge. To avoid bias arising from CMS rules related to precedence (rules for handling how overlapping episodes are assigned to hospitals), we followed prior methods and constructed naturally occurring episodes by assigning overlapping ones to the earlier hospital admission.2,16 From this set of episodes, we identified those for AMI, CHF, COPD, and pneumonia.
Exposure and Covariate Variables
Our study exposure was the interaction between hospital safety net status and hospital BPCI participation, which captured whether the association between BPCI participation and outcomes varied by safety net status (eg, whether differential changes in an outcome related to BPCI participation were different for safety net and non–safety net hospitals in the program). BPCI participation was defined using a time-varying indicator of BPCI participation to distinguish between episodes occurring under the program (ie, after a hospital began participating) or before participation in it. Covariates were chosen based on prior studies and included patient variables such as age, sex, Elixhauser comorbidities, frailty, and Medicare/Medicaid dual-eligibility status.17-23 Additionally, our analysis included market variables such as population size and Medicare Advantage penetration.
Outcome Variables
The prespecified primary study outcome was standardized 90-day postdischarge spending. This outcome was chosen owing to the lack of variation in standardized index hospitalization spending given the MS-DRG system and prior work suggesting that bundled payment participants instead targeted changes to postdischarge utilization and spending.2 Secondary outcomes included 90-day unplanned readmission rates, 90-day postdischarge mortality rates, discharge to institutional post–acute care providers (defined as either skilled nursing facilities [SNFs] or inpatient rehabilitation facilities), discharge home with home health agency services, and—among patients discharged to SNFs—SNF length of stay (LOS), measured in number of days.
Statistical Analysis
We described the characteristics of patients and hospitals in our samples. In adjusted analyses, we used a series of difference-in-differences (DID) generalized linear models to conduct a heterogeneity analysis evaluating whether the relationship between hospital BPCI participation and medical condition episode outcomes varied based on hospital safety net status.
In these models, the DID estimator was a time-varying indicator of hospital BPCI participation (equal to 1 for episodes occurring during the BPCI period at BPCI hospitals after they initiated participation; 0 otherwise) together with hospital and quarter-time fixed effects. To examine differences in the association between BPCI and episode outcomes by hospital safety net status—that is, whether there was heterogeneity in the outcome changes between safety net and non–safety net hospitals participating in BPCI—our models also included an interaction term between hospital safety net status and the time-varying BPCI participation term (Appendix Methods). In this approach, BPCI safety net and BPCI non–safety net hospitals were compared with non-BPCI hospitals as the comparison group. The comparisons were chosen to yield the most policy-salient findings, since Medicare evaluated hospitals in BPCI, whether safety net or not, by comparing their performance to nonparticipating hospitals, whether safety net or not.
All models controlled for patient and time-varying market characteristics and included hospital fixed effects (to account for time-invariant hospital market characteristics) and MS-DRG fixed effects. All outcomes were evaluated using models with identity links and normal distributions (ie, ordinary least squares). These variables and models were applied to data from the baseline period to examine consistency with the parallel trends assumption. Overall, Wald tests did not indicate divergent baseline period trends in outcomes between BPCI and non-BPCI hospitals (Appendix Figure 1) or BPCI safety net versus BPCI non–safety net hospitals (Appendix Figure 2).
We conducted sensitivity analyses to evaluate the robustness of our results. First, instead of comparing differential changes at BPCI safety net vs BPCI non–safety net hospitals (ie, evaluating safety net status among BPCI hospitals), we evaluated changes at BPCI safety net vs non-BPCI safety net hospitals compared with changes at BPCI non–safety net vs non-BPCI non–safety net hospitals (ie, marginal differences in the changes associated with BPCI participation among safety net vs non–safety net hospitals). Because safety net hospitals in BPCI were compared with nonparticipating safety net hospitals, and non–safety net hospitals in BPCI were compared with nonparticipating non–safety net hospitals, this set of analyses helped address potential concerns about unobservable differences between safety net and non–safety net organizations and their potential impact on our findings.
Second, we used an alternative, BPCI-specific definition for safety net hospitals: instead of defining safety net status based on all hospitals nationwide, we defined it only among BPCI hospitals (safety net hospitals defined as those in the top quartile of DPP among all BPCI hospitals) and non-BPCI hospitals (safety net hospitals defined as those in the top quartile of DPP among all non-BPCI hospitals). Third, we repeated our main analyses using models with standard errors clustered at the hospital level and without hospital fixed effects. Fourth, we repeated analysis using models with alternative nonlinear link functions and outcome distributions and without hospital fixed effects.
Statistical tests were two-tailed and considered significant at α = .05 for the primary outcome. Statistical analyses were conducted using SAS 9.4 (SAS Institute, Inc.).
RESULTS
Our sample consisted of 3066 hospitals nationwide that collectively provided medical condition episode care to a total of 1,611,848 Medicare fee-for-service beneficiaries. This sample included 238 BPCI hospitals and 2769 non-BPCI hospitals (Table 1, Appendix Table 1).
Among BPCI hospitals, 63 were safety net and 175 were non–safety net hospitals. Compared with non–safety net hospitals, safety net hospitals tended to be larger and were more likely to be urban teaching hospitals. Safety net hospitals also tended to be located in areas with larger populations, more low-income individuals, and greater Medicare Advantage penetration.
In both the baseline and BPCI periods, there were differences in several characteristics for patients admitted to safety net vs non–safety net hospitals (Table 2; Appendix Table 2). Among BPCI hospitals, in both periods, patients admitted at safety net hospitals were younger and more likely to be Black, be Medicare/Medicaid dual eligible, and report having a disability than patients admitted to non–safety net hospitals. Patients admitted to safety net hospitals were also more likely to reside in socioeconomically disadvantaged areas.
Safety Net Status Among BPCI Hospitals
In the baseline period (Appendix Table 3), postdischarge spending was slightly greater among patients admitted to BPCI safety net hospitals ($18,817) than those admitted to BPCI non–safety net hospitals ($18,335). There were also small differences in secondary outcomes between the BPCI safety net and non−safety net groups.
In adjusted analyses evaluating heterogeneity in the effect of BPCI participation between safety net and non–safety net hospitals (Figure 1), differential changes in postdischarge spending between baseline and BPCI participation periods did not differ between safety net and non–safety net hospitals participating in BPCI (aDID, $40; 95% CI, –$254 to $335; P = .79).
Sensitivity Analysis
Analyses of BPCI participation among safety net vs non–safety net hospitals nationwide yielded results that were similar to those from our main analyses (Appendix Figures 4, 5, and 6). Compared with BPCI participation among non–safety net hospitals, participation among safety net hospitals was associated with a differential increase from baseline to BPCI periods in discharge to institutional post–acute care providers (aDID, 1.07 percentage points; 95% CI, 0.47-1.67 percentage points; P < .001), but no differential changes between baseline and BPCI periods in postdischarge spending (aDID, –$199;95% CI, –$461 to $63; P = .14), SNF LOS (aDID, –0.22 days; 95% CI, –0.54 to 0.09 days; P = .16), or other secondary outcomes.
Replicating our main analyses using an alternative, BPCI-specific definition of safety net hospitals yielded similar results overall (Appendix Table 4; Appendix Figures 7, 8, and 9). There were no differential changes between baseline and BPCI periods in postdischarge spending between BPCI safety net and BPCI non–safety net hospitals (aDID, $111; 95% CI, –$189 to $411; P = .47). Results for secondary outcomes were also qualitatively similar to results from main analyses, with the exception that among BPCI hospitals, safety net hospitals had a differentially higher SNF LOS than non–safety net hospitals between baseline and BPCI periods (aDID, 0.38 days; 95% CI, 0.02-0.74 days; P = .04).
Compared with results from our main analysis, findings were qualitatively similar overall in analyses using models with hospital-clustered standard errors and without hospital fixed effects (Appendix Figures 10, 11, and 12) as well as models with alternative link functions and outcome distributions and without hospital fixed effects (Appendix Figures 13, 14, and 15).
Discussion
This analysis builds on prior work by evaluating how hospital safety net status affected the known association between bundled payment participation and decreased spending and stable quality for medical condition episodes. Although safety net status did not appear to affect those relationships, it did affect the relationship between participation and post–acute care utilization. These results have three main implications.
First, our results suggest that policymakers should continue engaging safety net hospitals in medical condition bundled payments while monitoring for unintended consequences. Our findings with regard to spending provide some reassurance that safety net hospitals can potentially achieve savings while maintaining quality under bundled payments, similar to other types of hospitals. However, the differences in patient populations and post–acute care utilization patterns suggest that policymakers should continue to carefully monitor for disparities based on hospital safety net status and consider implementing measures that have been used in other payment reforms to support safety net organizations. Such measures could involve providing customized technical assistance or evaluating performance using “peer groups” that compare performance among safety net hospitals alone rather than among all hospitals.24,25
Second, our findings underscore potential challenges that safety net hospitals may face when attempting to redesign care. For instance, among hospitals accepting bundled payments for medical conditions, successful strategies in BPCI have often included maintaining the proportion of patients discharged to institutional post–acute care providers while reducing SNF LOS.2 However, in our study, discharge to institutional post–acute care providers actually increased among safety net hospitals relative to other hospitals while SNF LOS did not decrease. Additionally, while other hospitals in bundled payments have exhibited differentially greater discharge home with home health services, we found that safety net hospitals did not. These represent areas for future work, particularly because little is known about how safety net hospitals coordinate post–acute care (eg, the extent to which safety net hospitals integrate with post–acute care providers or coordinate home-based care for vulnerable patient populations).
Third, study results offer insight into potential challenges to practice changes. Compared with other hospitals, safety net hospitals in our analysis provided medical condition episode care to more Black, Medicare/Medicaid dual-eligible, and disabled patients, as well as individuals living in socioeconomically disadvantaged areas. Collectively, these groups may face more challenging socioeconomic circumstances or existing disparities. The combination of these factors and limited financial resources at safety net hospitals could complicate their ability to manage transitions of care after hospitalization by shifting discharge away from high-intensity institutional post–acute care facilities.
Our analysis has limitations. First, given the observational study design, findings are subject to residual confounding and selection bias. For instance, findings related to post–acute care utilization could have been influenced by unobservable changes in market supply and other factors. However, we mitigated these risks using a quasi-experimental methodology that also directly accounted for multiple patient, hospital, and market characteristics and also used fixed effects to account for unobserved heterogeneity. Second, in studying BPCI Model 2, we evaluated one model within one bundled payment program. However, BPCI Model 2 encompassed a wide range of medical conditions, and both this scope and program design have served as the direct basis for subsequent bundled payment models, such as the ongoing BPCI Advanced and other forthcoming programs.26 Third, while our analysis evaluated multiple aspects of patient complexity, individuals may be “high risk” owing to several clinical and social determinants. Future work should evaluate different features of patient risk and how they affect outcomes under payment models such as bundled payments.
CONCLUSION
Safety net status appeared to affect the relationship between bundled payment participation and post–acute care utilization, but not episode spending. These findings suggest that policymakers could support safety net hospitals within bundled payment programs and consider safety net status when evaluating them.
1. Navathe AS, Emanuel EJ, Venkataramani AS, et al. Spending and quality after three years of Medicare’s voluntary bundled payment for joint replacement surgery. Health Aff (Millwood). 2020;39(1):58-66. https://doi.org/10.1377/hlthaff.2019.00466
2. Rolnick JA, Liao JM, Emanuel EJ, et al. Spending and quality after three years of Medicare’s bundled payments for medical conditions: quasi-experimental difference-in-differences study. BMJ. 2020;369:m1780. https://doi.org/10.1136/bmj.m1780
3. Figueroa JF, Joynt KE, Zhou X, Orav EJ, Jha AK. Safety-net hospitals face more barriers yet use fewer strategies to reduce readmissions. Med Care. 2017;55(3):229-235. https://doi.org/10.1097/MLR.0000000000000687
4. Werner RM, Goldman LE, Dudley RA. Comparison of change in quality of care between safety-net and non–safety-net hospitals. JAMA. 2008;299(18):2180-2187. https://doi/org/10.1001/jama.299.18.2180
5. Ross JS, Bernheim SM, Lin Z, et al. Based on key measures, care quality for Medicare enrollees at safety-net and non–safety-net hospitals was almost equal. Health Aff (Millwood). 2012;31(8):1739-1748. https://doi.org/10.1377/hlthaff.2011.1028
6. Gilman M, Adams EK, Hockenberry JM, Milstein AS, Wilson IB, Becker ER. Safety-net hospitals more likely than other hospitals to fare poorly under Medicare’s value-based purchasing. Health Aff (Millwood). 2015;34(3):398-405. https://doi.org/10.1377/hlthaff.2014.1059
7. Joynt KE, Jha AK. Characteristics of hospitals receiving penalties under the Hospital Readmissions Reduction Program. JAMA. 2013;309(4):342-343. https://doi.org/10.1001/jama.2012.94856
8. Rajaram R, Chung JW, Kinnier CV, et al. Hospital characteristics associated with penalties in the Centers for Medicare & Medicaid Services Hospital-Acquired Condition Reduction Program. JAMA. 2015;314(4):375-383. https://doi.org/10.1001/jama.2015.8609
9. Navathe AS, Liao JM, Shah Y, et al. Characteristics of hospitals earning savings in the first year of mandatory bundled payment for hip and knee surgery. JAMA. 2018;319(9):930-932. https://doi.org/10.1001/jama.2018.0678
10. Thirukumaran CP, Glance LG, Cai X, Balkissoon R, Mesfin A, Li Y. Performance of safety-net hospitals in year 1 of the Comprehensive Care for Joint Replacement Model. Health Aff (Millwood). 2019;38(2):190-196. https://doi.org/10.1377/hlthaff.2018.05264
11. Thirukumaran CP, Glance LG, Cai X, Kim Y, Li Y. Penalties and rewards for safety net vs non–safety net hospitals in the first 2 years of the Comprehensive Care for Joint Replacement Model. JAMA. 2019;321(20):2027-2030. https://doi.org/10.1001/jama.2019.5118
12. Kim H, Grunditz JI, Meath THA, Quiñones AR, Ibrahim SA, McConnell KJ. Level of reconciliation payments by safety-net hospital status under the first year of the Comprehensive Care for Joint Replacement Program. JAMA Surg. 2019;154(2):178-179. https://doi.org/10.1001/jamasurg.2018.3098
13. Department of Medicine, University of Wisconsin School of Medicine and Public Health. Neighborhood Atlas. Accessed March 1, 2021. https://www.neighborhoodatlas.medicine.wisc.edu/
14. Dartmouth Atlas Project. The Dartmouth Atlas of Health Care. Accessed March 1, 2021. https://www.dartmouthatlas.org/
15. Chatterjee P, Joynt KE, Orav EJ, Jha AK. Patient experience in safety-net hospitals: implications for improving care and value-based purchasing. Arch Intern Med. 2012;172(16):1204-1210. https://doi.org/10.1001/archinternmed.2012.3158
16. Rolnick JA, Liao JM, Navathe AS. Programme design matters—lessons from bundled payments in the US. June 17, 2020. Accessed March 1, 2021. https://blogs.bmj.com/bmj/2020/06/17/programme-design-matters-lessons-from-bundled-payments-in-the-us
17. Dummit LA, Kahvecioglu D, Marrufo G, et al. Association between hospital participation in a Medicare bundled payment initiative and payments and quality outcomes for lower extremity joint replacement episodes. JAMA. 2016;316(12):1267-1278. https://doi.org/10.1001/jama.2016.12717
18. Navathe AS, Liao JM, Dykstra SE, et al. Association of hospital participation in a Medicare bundled payment program with volume and case mix of lower extremity joint replacement episodes. JAMA. 2018;320(9):901-910. https://doi.org/10.1001/jama.2018.12345
19. Joynt Maddox KE, Orav EJ, Zheng J, Epstein AM. Evaluation of Medicare’s bundled payments initiative for medical conditions. N Engl J Med. 2018;379(3):260-269. https://doi.org/10.1056/NEJMsa1801569
20. Navathe AS, Emanuel EJ, Venkataramani AS, et al. Spending and quality after three years of Medicare’s voluntary bundled payment for joint replacement surgery. Health Aff (Millwood). 2020;39(1):58-66. https://doi.org/10.1377/hlthaff.2019.00466
21. Liao JM, Emanuel EJ, Venkataramani AS, et al. Association of bundled payments for joint replacement surgery and patient outcomes with simultaneous hospital participation in accountable care organizations. JAMA Netw Open. 2019;2(9):e1912270. https://doi.org/10.1001/jamanetworkopen.2019.12270
22. Kim DH, Schneeweiss S. Measuring frailty using claims data for pharmacoepidemiologic studies of mortality in older adults: evidence and recommendations. Pharmacoepidemiol Drug Saf. 2014;23(9):891-901. https://doi.org/10.1002/pds.3674
23. Joynt KE, Figueroa JF, Beaulieu N, Wild RC, Orav EJ, Jha AK. Segmenting high-cost Medicare patients into potentially actionable cohorts. Healthc (Amst). 2017;5(1-2):62-67. https://doi.org/10.1016/j.hjdsi.2016.11.002
24. Quality Payment Program. Small, underserved, and rural practices. Accessed March 1, 2021. https://qpp.cms.gov/about/small-underserved-rural-practices
25. McCarthy CP, Vaduganathan M, Patel KV, et al. Association of the new peer group–stratified method with the reclassification of penalty status in the Hospital Readmission Reduction Program. JAMA Netw Open. 2019;2(4):e192987. https://doi.org/10.1001/jamanetworkopen.2019.2987
26. Centers for Medicare & Medicaid Services. BPCI Advanced. Updated September 16, 2021. Accessed October 18, 2021. https://innovation.cms.gov/innovation-models/bpci-advanced
© 2021 Society of Hospital Medicine
Improving Healthcare Access for Patients With Limited English Proficiency
Patients whose primary language is not English and who have a limited ability to read, speak, write, or understand English experience worse healthcare access than their English-speaking counterparts, highlighted by fewer healthcare visits and filled prescription medications.1 These patients with limited English proficiency (LEP) face additional barriers to quality healthcare during the COVID-19 pandemic, including lower rates of telehealth use,2 lower rates of COVID-19 testing,3 and challenges with implementing high-quality interpretation.4 As a result of such long-standing disparities, healthcare policy has focused on improving access to language-concordant care.
The Civil Rights Act of 1964 and Department of Health and Human Services (HHS) regulations require recipients of federal financial assistance to provide reasonable access to programs, services, and activities to persons with LEP. Section 1557 of the Affordable Care Act extends Title VI nondiscrimination standards to the entire healthcare system, including insurers and health plans. In 2016, the Obama administration implemented Section 1557 through regulations that clarified and expanded language accessibility standards, although several years later the Trump administration sought to weaken the rule’s protections.
Although the requirement to make healthcare accessible to patients with LEP is unequivocal, “reasonable access” provides clinicians who accept federal funds with flexibility in how they deliver language access services. Differing interpretations of what is considered “reasonable” drives variation in how and when medical facilities provide interpreter services. This results in inconsistency of services provided across care settings and decreased availability of language-concordant care. For example, less than one-third of outpatient providers regularly use qualified interpreters when seeing patients with LEP.5 Furthermore, only about 69% of hospitals offer language access services.6 Clinician underutilization of interpreters for patients with LEP results in poor patient satisfaction and worse health outcomes.7 In light of the Biden administration’s commitment to civil rights and healthcare access, we outline a roadmap of actions that this administration must take to ensure access to basic communication needs and improve health equity.
IDENTIFY CURRENT OPPORTUNITIES FOR IMPROVING REGULATIONS
The Trump-era rules loosened the requirement that care providers notify patients with LEP of their rights to language services and provide instructions on how to access these services. These rules also allowed providers to replace video-based interpreter services with audio-based services, which disproportionately impacts patients in rural areas, who rely on high-quality video interpretation to facilitate telehealth visits, especially during the ongoing COVID-19 pandemic, which has increased patient reliance on telehealth infrastructure for primary healthcare access. The Trump administration weakened both the standards for ensuring adequate access to language assistance services and the compliance tests used to assess whether healthcare organizations have met those standards. The revised regulations deem certain healthcare services effectively exempt from interpreter standards if the projected number of encountered patients with LEP falls below preset minimums and a healthcare entity considers the cost of compliance onerous.8 The Trump administration justified these changes as a cost-savings matter, but the suboptimal care resulting from these changes will likely offset any savings.
RESTORE AND IMPROVE LANGUAGE ACCESS PROVISIONS
To restore a strong commitment to language access, the HHS Office for Civil Rights, which the Biden administration has targeted for new investments in fiscal year 2022, should reestablish the HHS Language Access Steering Committee. This committee maintains criteria that guide covered health entities in developing language access compliance plans. Maintaining such plans should become a basic element of the revised Section 1557 compliance rules and should also become a core feature of the standards applicable to Joint Commission–accredited healthcare organizations. In addition, the Center for Medicare and Medicaid Innovation, whose mission is to identify, test, and implement major improvements in healthcare quality and efficiency, could undertake a special project to identify and incentivize adoption of the most effective language access innovations for incorporation into language access plans.
RESTRUCTURE AND STRENGTHEN COMPLIANCE FOR LANGUAGE ACCESS
Section 1557, as well as federal standards governing the conditions of participation in federal healthcare programs, should ensure that covered entities report on interpreter use and associated patient health outcomes for patients with LEP. Overall compliance measurement and reporting in connection with language access is a matter of basic health equity. Currently, any individual who believes they have experienced discrimination based on language can report a potential violation for federal investigation. But an individual remedy is insufficient because it cannot ensure the types of systemic changes essential to overcome decades of structural exclusion and achieve broader health equity. Further, barriers from digital literacy gaps and fear of legal repercussions, such as deportation, hamper individual reporting efforts. Any policy focused on improving language access use should apply to all patients, regardless of immigration status.
INCENTIVIZE LANGUAGE-CONCORDANT CARE
Ultimately, there is little benefit to imposing standards without a concomitant assurance of the resources needed to achieve full adoption and ongoing compliance. For this reason, a commitment to language access must be accompanied by payment reforms that enable Medicare and Medicaid providers to embrace this vital feature of accessible healthcare by recognizing interpreter costs as part of the clinical encounter and care management. Covered entities could use these resources either to strengthen their own staffing or contract with third-party interpreter services organizations. Currently, the Centers for Medicare & Medicaid Services (CMS) allow states to claim federal matching funds for language assistance services provided to Medicaid enrollees, though rates are dependent on how service claims are categorized. State Medicaid programs can facilitate the provision of such services by optimizing reimbursements for provider organizations under CMS policy.
The Merit-based Incentive Payment System (MIPS) provides an opportunity to incorporate the provision of interpreter services into quality measure reporting. Such efforts could improve health equity and address long-standing needs for research into how language barriers affect healthcare outcomes. Given that analyses of inaugural MIPS data revealed that safety-net practices were more likely to receive lower composite scores, additional scoring flexibility under pay-for-performance schemes (rather than strict penalties) may be necessary to ensure the solvency of safety net practices that disproportionately care for patients with LEP.9 Here, CMMI can play a critical role in expanding the use of patient-facing resources by designing new alternative payment models that reward participants for providing high-quality language concordant care.
The COVID-19 pandemic has exacerbated disparities in care for patients with LEP and even starker disparities among immigrant communities and patients of color. These disparities will only worsen if regulations aimed at improving access to language access services are not reinstated and improved. Failing to focus on healthcare access for patients with LEP hurts individual patient health and public health, as we have seen through lower rates of testing and vaccination in communities of color during this pandemic. The Biden administration can put healthcare on a more equitable pathway by expanding and strengthening language access as a core feature of healthcare, as a matter of both civil rights and health care quality.
Acknowledgments
The authors thank Jocelyn Samuels, JD, and Sara Rosenbaum, JD, for comments and guidance on an earlier draft of this article.
1. Himmelstein J, Himmelstein DU, Woolhandler S, et al. Health care spending and use among Hispanic adults with and without limited English proficiency, 1999–2018. Health Aff (Millwood). 2021;40(7):1126-1134. https://doi.org/10.1377/hlthaff.2020.02510
2. Rodriguez JA, Saadi A, Schwamm LH, Bates DW, Samal L. Disparities in telehealth use among California patients with limited English proficiency. Health Aff (Millwood). 2021;40(3):487-495. https://doi.org/10.1377/hlthaff.2020.00823
3. Kim HN, Lan KF, Nkyekyer E, et al. Assessment of disparities in COVID-19 testing and infection across language groups in Seattle, Washington. JAMA Netw Open. 2020;3(9):e2021213. https://doi.org/10.1001/jamanetworkopen.2020.21213
4. Page KR, Flores-Miller A. Lessons we’ve learned - Covid-19 and the undocumented Latinx community. N Engl J Med. 2021;384(1):5-7. https://doi.org/10.1056/NEJMp2024897
5. Schulson LB, Anderson TS. National estimates of professional interpreter use in the ambulatory setting. J Gen Intern Med. Published online November 2, 2020. https://doi.org/10.1007/s11606-020-06336-6
6. Schiaffino MK, Nara A, Mao L. Language services in hospitals vary by ownership and location. Health Aff (Millwood). 2016;35(8):1399-1403. https://doi.org/10.1377/hlthaff.2015.0955
7. Taira BR, Kim K, Mody N. Hospital and health system–level interventions to improve care for limited English proficiency patients: a systematic review. Jt Comm J Qual Patient Saf. 2019;45(6):446-458. https://doi.org/10.1016/j.jcjq.2019.02.005
8. Musumeci M, Kates J, Dawson L, Salganicoff A, Sobel L, Artiga S. The Trump administration’s final rule on Section 1557 non-discrimination regulations under the ACA and current status. Kaiser Family Foundation. September 18, 2020. Accessed September 2, 2021. https://www.kff.org/racial-equity-and-health-policy/issue-brief/the-trump-administrations-final-rule-on-section-1557-non-discrimination-regulations-under-the-aca-and-current-status/
9. Liao JM, Navathe AS. Does the Merit-Based Incentive Payment System disproportionately affect safety-net practices? JAMA Health Forum. 2020;1(5):e200452. https://doi.org/10.1001/jamahealthforum.2020.0452
Patients whose primary language is not English and who have a limited ability to read, speak, write, or understand English experience worse healthcare access than their English-speaking counterparts, highlighted by fewer healthcare visits and filled prescription medications.1 These patients with limited English proficiency (LEP) face additional barriers to quality healthcare during the COVID-19 pandemic, including lower rates of telehealth use,2 lower rates of COVID-19 testing,3 and challenges with implementing high-quality interpretation.4 As a result of such long-standing disparities, healthcare policy has focused on improving access to language-concordant care.
The Civil Rights Act of 1964 and Department of Health and Human Services (HHS) regulations require recipients of federal financial assistance to provide reasonable access to programs, services, and activities to persons with LEP. Section 1557 of the Affordable Care Act extends Title VI nondiscrimination standards to the entire healthcare system, including insurers and health plans. In 2016, the Obama administration implemented Section 1557 through regulations that clarified and expanded language accessibility standards, although several years later the Trump administration sought to weaken the rule’s protections.
Although the requirement to make healthcare accessible to patients with LEP is unequivocal, “reasonable access” provides clinicians who accept federal funds with flexibility in how they deliver language access services. Differing interpretations of what is considered “reasonable” drives variation in how and when medical facilities provide interpreter services. This results in inconsistency of services provided across care settings and decreased availability of language-concordant care. For example, less than one-third of outpatient providers regularly use qualified interpreters when seeing patients with LEP.5 Furthermore, only about 69% of hospitals offer language access services.6 Clinician underutilization of interpreters for patients with LEP results in poor patient satisfaction and worse health outcomes.7 In light of the Biden administration’s commitment to civil rights and healthcare access, we outline a roadmap of actions that this administration must take to ensure access to basic communication needs and improve health equity.
IDENTIFY CURRENT OPPORTUNITIES FOR IMPROVING REGULATIONS
The Trump-era rules loosened the requirement that care providers notify patients with LEP of their rights to language services and provide instructions on how to access these services. These rules also allowed providers to replace video-based interpreter services with audio-based services, which disproportionately impacts patients in rural areas, who rely on high-quality video interpretation to facilitate telehealth visits, especially during the ongoing COVID-19 pandemic, which has increased patient reliance on telehealth infrastructure for primary healthcare access. The Trump administration weakened both the standards for ensuring adequate access to language assistance services and the compliance tests used to assess whether healthcare organizations have met those standards. The revised regulations deem certain healthcare services effectively exempt from interpreter standards if the projected number of encountered patients with LEP falls below preset minimums and a healthcare entity considers the cost of compliance onerous.8 The Trump administration justified these changes as a cost-savings matter, but the suboptimal care resulting from these changes will likely offset any savings.
RESTORE AND IMPROVE LANGUAGE ACCESS PROVISIONS
To restore a strong commitment to language access, the HHS Office for Civil Rights, which the Biden administration has targeted for new investments in fiscal year 2022, should reestablish the HHS Language Access Steering Committee. This committee maintains criteria that guide covered health entities in developing language access compliance plans. Maintaining such plans should become a basic element of the revised Section 1557 compliance rules and should also become a core feature of the standards applicable to Joint Commission–accredited healthcare organizations. In addition, the Center for Medicare and Medicaid Innovation, whose mission is to identify, test, and implement major improvements in healthcare quality and efficiency, could undertake a special project to identify and incentivize adoption of the most effective language access innovations for incorporation into language access plans.
RESTRUCTURE AND STRENGTHEN COMPLIANCE FOR LANGUAGE ACCESS
Section 1557, as well as federal standards governing the conditions of participation in federal healthcare programs, should ensure that covered entities report on interpreter use and associated patient health outcomes for patients with LEP. Overall compliance measurement and reporting in connection with language access is a matter of basic health equity. Currently, any individual who believes they have experienced discrimination based on language can report a potential violation for federal investigation. But an individual remedy is insufficient because it cannot ensure the types of systemic changes essential to overcome decades of structural exclusion and achieve broader health equity. Further, barriers from digital literacy gaps and fear of legal repercussions, such as deportation, hamper individual reporting efforts. Any policy focused on improving language access use should apply to all patients, regardless of immigration status.
INCENTIVIZE LANGUAGE-CONCORDANT CARE
Ultimately, there is little benefit to imposing standards without a concomitant assurance of the resources needed to achieve full adoption and ongoing compliance. For this reason, a commitment to language access must be accompanied by payment reforms that enable Medicare and Medicaid providers to embrace this vital feature of accessible healthcare by recognizing interpreter costs as part of the clinical encounter and care management. Covered entities could use these resources either to strengthen their own staffing or contract with third-party interpreter services organizations. Currently, the Centers for Medicare & Medicaid Services (CMS) allow states to claim federal matching funds for language assistance services provided to Medicaid enrollees, though rates are dependent on how service claims are categorized. State Medicaid programs can facilitate the provision of such services by optimizing reimbursements for provider organizations under CMS policy.
The Merit-based Incentive Payment System (MIPS) provides an opportunity to incorporate the provision of interpreter services into quality measure reporting. Such efforts could improve health equity and address long-standing needs for research into how language barriers affect healthcare outcomes. Given that analyses of inaugural MIPS data revealed that safety-net practices were more likely to receive lower composite scores, additional scoring flexibility under pay-for-performance schemes (rather than strict penalties) may be necessary to ensure the solvency of safety net practices that disproportionately care for patients with LEP.9 Here, CMMI can play a critical role in expanding the use of patient-facing resources by designing new alternative payment models that reward participants for providing high-quality language concordant care.
The COVID-19 pandemic has exacerbated disparities in care for patients with LEP and even starker disparities among immigrant communities and patients of color. These disparities will only worsen if regulations aimed at improving access to language access services are not reinstated and improved. Failing to focus on healthcare access for patients with LEP hurts individual patient health and public health, as we have seen through lower rates of testing and vaccination in communities of color during this pandemic. The Biden administration can put healthcare on a more equitable pathway by expanding and strengthening language access as a core feature of healthcare, as a matter of both civil rights and health care quality.
Acknowledgments
The authors thank Jocelyn Samuels, JD, and Sara Rosenbaum, JD, for comments and guidance on an earlier draft of this article.
1. Himmelstein J, Himmelstein DU, Woolhandler S, et al. Health care spending and use among Hispanic adults with and without limited English proficiency, 1999–2018. Health Aff (Millwood). 2021;40(7):1126-1134. https://doi.org/10.1377/hlthaff.2020.02510
2. Rodriguez JA, Saadi A, Schwamm LH, Bates DW, Samal L. Disparities in telehealth use among California patients with limited English proficiency. Health Aff (Millwood). 2021;40(3):487-495. https://doi.org/10.1377/hlthaff.2020.00823
3. Kim HN, Lan KF, Nkyekyer E, et al. Assessment of disparities in COVID-19 testing and infection across language groups in Seattle, Washington. JAMA Netw Open. 2020;3(9):e2021213. https://doi.org/10.1001/jamanetworkopen.2020.21213
4. Page KR, Flores-Miller A. Lessons we’ve learned - Covid-19 and the undocumented Latinx community. N Engl J Med. 2021;384(1):5-7. https://doi.org/10.1056/NEJMp2024897
5. Schulson LB, Anderson TS. National estimates of professional interpreter use in the ambulatory setting. J Gen Intern Med. Published online November 2, 2020. https://doi.org/10.1007/s11606-020-06336-6
6. Schiaffino MK, Nara A, Mao L. Language services in hospitals vary by ownership and location. Health Aff (Millwood). 2016;35(8):1399-1403. https://doi.org/10.1377/hlthaff.2015.0955
7. Taira BR, Kim K, Mody N. Hospital and health system–level interventions to improve care for limited English proficiency patients: a systematic review. Jt Comm J Qual Patient Saf. 2019;45(6):446-458. https://doi.org/10.1016/j.jcjq.2019.02.005
8. Musumeci M, Kates J, Dawson L, Salganicoff A, Sobel L, Artiga S. The Trump administration’s final rule on Section 1557 non-discrimination regulations under the ACA and current status. Kaiser Family Foundation. September 18, 2020. Accessed September 2, 2021. https://www.kff.org/racial-equity-and-health-policy/issue-brief/the-trump-administrations-final-rule-on-section-1557-non-discrimination-regulations-under-the-aca-and-current-status/
9. Liao JM, Navathe AS. Does the Merit-Based Incentive Payment System disproportionately affect safety-net practices? JAMA Health Forum. 2020;1(5):e200452. https://doi.org/10.1001/jamahealthforum.2020.0452
© 2021 Society of Hospital Medicine
The No Judgment Zone: Building Trust Through Trustworthiness
The collective struggle felt by healthcare workers simultaneously learning about and caring for patients impacted by SARS-CoV2 infections throughout 2020 was physically and emotionally exhausting. The majority of us had never experienced a global pandemic. Beyond our work in the professional arena of ambulatory practices and hospitals, we also felt the soul-crushing impact of the pandemic in every other aspect of our lives. Preexisting health disparities were amplified by COVID-19. Some of the most affected communities also bore the weight of an additional tsunami of ongoing racial injustice.1 And as healthcare workers, we did our best to process and navigate it all while trying to avoid burnout—as well as being infected with COVID-19 ourselves. When the news of the highly effective vaccines against SARS-CoV2 receiving emergency use authorization broke late in 2020, it felt like a light at the end of a very dark tunnel.
In the weeks preceding wide availability of the vaccines, it became apparent that significant numbers of people lacked confidence in the vaccines. Given the disproportionate impact of COVID-19 on racial minorities, much of the discussion centered around “vaccine hesitancy” in these communities. Reasons such as historical mistrust, belief in conspiracy theories, and misinformation emerged as the leading explanations.2 Campaigns and educational programs targeting Black Americans were quickly developed to counter this widely distributed narrative.
Vaccine uptake also became politicized, which created additional challenges. As schools and businesses reopened, the voices of those opposing pandemic mitigation mandates such as masking and vaccination were highlighted by media outlets. And though a large movement of individuals who had opted against vaccines existed well before the pandemic, with few exceptions, that number had never been great enough to impact public health to this extent.3 This primarily nonminority group of unvaccinated individuals also morphed into another monolithic identity: the “anti-vaxxer.”
The lion’s share of discussions around vaccine uptake centered on these two groups: the “vaccine hesitant” minority and the “anti-vaxxer.” The perspectives and frustration around these two stereotypical unvaccinated groups were underscored in journals and the lay press. But those working in communities and in direct care came into contact with countless COVID-19-positive patients who were unvaccinated and fell into neither of these categories. There was a large swath of vulnerable people who still had unanswered questions and mistrust in the medical system standing in their way. Awareness of health disparities among racial minorities is something that was discussed among providers, but it was something experienced and felt by patients daily in regard to so much more than just COVID-19.
With broader access to vaccines through retail, community-based, and clinical facilities, more patients who desired vaccination had the opportunity. After an initial rise in vaccine uptake, the numbers plateaued. But what remained was the repetitive messaging and sustained focus directed toward Black people and their “vaccine hesitancy.”
Grady Memorial Hospital, a public safety net hospital in Atlanta, serves a predominantly Black and uninsured patient population. We found that a “FAQ” approach with a narrow range of hypothetical ideas about unvaccinated minorities clashed with the reality of what we encountered in clinical environments and the community. While misinformation did appear to be prevalent, we appreciated that the context and level of conviction were heterogenous. We appreciated that each individual conversation could reveal something new to us about that unique patient and their personal concerns about vaccination. As time moved forward, it became clear that there was no playbook for any group, especially for historically disadvantaged communities. Importantly, it was recognized that attempts to anticipate what may be a person’s barrier to vaccination often worked to further erode trust. However, when we focused on creating a space for dialogue, we found we were able to move beyond information-sharing and instead were able to co-construct interpretations of information and co-create solutions that matched patients’ values and lived experiences.4 Through dialogue, we were better able to be transparent about our own experiences, which ultimately facilitated authentic conversations with patients.
In September 2021, we approached our hospital leadership with a patient-centered strategy aimed at providing our patients, staff, and visitors a psychologically safe place to discuss vaccine-related concerns without judgment. With their support, we set up a table in the busiest part of our hospital atrium between the information desk and vaccine-administration site. Beside it was a folding board sign with an image and these words:
“Still unsure about being vaccinated? Let’s talk about it.”
We aptly called the area the “No Judgment Zone.”
The No Judgment Zone is collaboratively staffed in 1- to 2-hour voluntary increments by physician faculty and resident physicians at Emory University School of Medicine and Morehouse School of Medicine. Our goal is to increase patient trust by honoring individual vaccine-related concerns without shame or ridicule. We also work to increase patient trust by being transparent around our own experiences with COVID-19; by sharing our own journeys, concerns, and challenges, we are better able to engage in meaningful dialogue. Also, recognizing the power of logistical barriers, in addition to answering questions, we offer physical assistance with check-in, forms, and escorts to our administration areas. The numbers of unique visits have varied from day to day, but the impact of each individual encounter cannot be overstated.
Here, we describe our approach to interactions at the No Judgment Zone. These are the instructions offered to our volunteers. Though we offer some explicit examples, each talking point is designed to open the door to a patient-centered individual dialogue. We believe that these strategies can be applied to clinical settings as well as any conversation surrounding vaccination with those who have not yet decided to be vaccinated.
THE GRADY “NO JUDGMENT ZONE” INTERACTION APPROACH
No Labels
Try to think of all who are not yet vaccinated as “on a spectrum of deliberation” about their decision—not “hesitant” or “anti-vaxxer.”
Step 1: Gratitude
- “Thank you for stopping to talk to us today.”
- “I appreciate you taking the time.”
- “Before we start—I’m glad you’re here. Thanks.”
Step 2: Determine Where They Are
- Has the person you’re speaking with been vaccinated yet?
- If no, ask: “On a scale of 0 to 10—zero being “I will never get vaccinated under any circumstances” and 10 being ‘I will definitely get vaccinated’—what number would you give yourself?”
- If the person is a firm zero: “Is there anything I might be able to share with you or tell you about that might move you away from that perspective?”
- If the answer is NO: “It sounds like you’ve thought a lot about this and are no longer deliberating about whether you will be vaccinated. If you find yourself considering it, come back to talk with us, okay?” We are not here to debate or argue. We also need to avail ourselves to those who are open to changing their mind.
- If they say anything other than zero, move to an open-ended question about #WhatsYourWhy.
Step 3: #WhatsYourWhy
- “What would you say has been your main reason for not getting vaccinated yet?”
- “Tell me what has stood in the way of you getting vaccinated.”
- Remember: Assume nothing. It may have nothing to do with misinformation, fear, or perceived threat. It could be logistics or many other things. You will not know unless you ask.
- Providers should feel encouraged to also share their why as well and the reasons they encouraged their parents/kids/loved ones to get vaccinated. Making it personal can help establish connection and be more compelling.
Step 4: Listen Completely
- Give full eye contact. Slow all body movements. Use facilitative gestures to let the person know you are listening.
- Do not plan what you wish to say next.
- Limit reactions to misinformation. Shame and judgment can be subtle. Be mindful.
- Repeat the concern back if you are not sure or want to confirm that you’ve heard correctly.
- Ask questions for clarity if you aren’t sure.
Step 5: Affirm All Concerns and Find Common Ground
- “I can only imagine how scary it must be to take a shot that you believe could cause you to not be able to have babies.”
- “You aren’t alone. That’s a concern that many of my patients have had, too. May I share some information about that with you?”
- “When I first heard about the vaccine, I worried it was too new, too. Can I share what I learned?”
Step 6: Provide Factual Information
- Without excessive medical jargon, offer factual information aimed at each concern or question. Probe to be certain your patient understands through a teach-back or question.
- If you are unsure about the answer to their question, admit that you don’t know. You can also ask a colleague or the attending with you. Another option is to call someone or say “Let’s pull this up together.” Then share your answer.
- It is okay to acknowledge that the healthcare system has not and does not always do right by minority populations, especially Black people. Use that as a pivot to why these truths make vaccination that much more important
- Have FAQ information sheets available. Confirm that the patient is comfortable with the information sheet by asking.
Step 7: Offer to Help Them Get Vaccinated Today
- “Would you like me to help you get vaccinated today?”
- “What can I do to assist you with getting vaccinated? Is today a good day?”
- Escort those who agree to the registration area.
- Affirm those plans to get vaccinated or those who feel closer to getting vaccinated after speaking with you.
Step 8: Gratitude
- Close with gratitude and an affirmation.
- “I’m so glad you took the time to talk with us today. You didn’t have to stop.”
- “Feel free to come back to talk to us if you think of any more questions. I’m grateful that you stopped.”
- We are planting seeds. Do not feel pressure to get a person to say yes. Our secret sauce is kindness, respect, and empathy.
- We do not think of our unvaccinated community members as “hesitant.” We approach all as if they are on a spectrum of deliberation.
Step 9: Reflect
- Understand the importance of your service and the potential impact each encounter has.
- Recognize the unique lived experiences of individual patients and how this may impact their deliberation process. While there is urgency and we may feel frustrated, the ultimate goal is to engender trust through respectful interactions.
- Pause for moments of quiet gratitude and self-check-ins.
Conclusion
Just as SARS-CoV2 spreads from one person to many, we recognize that information—factual and otherwise—has the potential to move quickly as well. It is important to realize that providing an opportunity for people to ask questions or receive clarification and confirmation in a safe space is critical. The No Judgement Zone, as the name indicates, offers this opportunity. The conversations that we have in this space are valuable to those who are still considering the vaccine as an option for themselves. The trust required for such conversations is less about the transmission of information and more about the social act of engaging in bidirectional dialogue. The foundation upon which trust is built is consistent trustworthy actions. One such action is respectful communication without shame or ridicule. Another is our willingness to be transparent about our own concerns, experiences, and journeys. Assumptions based upon single-story narratives of the unvaccinated—particularly those from historically marginalized groups—fracture an already fragile confidence in medical authorities.
While we understand that mitigating the ongoing spread of the virus and getting more people vaccinated will call for more than just individual conversations, we believe that respecting the unique perspectives of community members is an equally critical piece to moving forward. Throughout a healthcare worker’s typical day, we work to create personal moments of connection with patients among the immense bustle of other work that has to be done. Initiatives like this one have a focused intentionality behind creating space for patients to feel heard that is not only helpful for vaccine uptake and addressing mistrust, but can also be restorative for providers as well.
1. Manning KD. When grief and crises intersect: perspectives of a Black physician in the time of two pandemics. J Hosp Med. 2020;15(9):566-567. https://doi.org/10.12788/jhm.3481
2. Young S. Black vaccine hesitancy rooted in mistrust, doubts. WebMD. February 2, 2021. Accessed November 1, 2021. https://www.webmd.com/vaccines/covid-19-vaccine/news/20210202/black-vaccine-hesitancy-rooted-in-mistrust-doubts
3. Sanyaolu A, Okorie C, Marinkovic A, et al. Measles outbreak in unvaccinated and partially vaccinated children and adults in the United States and Canada (2018-2019): a narrative review of cases. Inquiry. 2019;56:46958019894098. https://doi.org/10.1177/0046958019894098
4. O’Brien BC. Do you see what I see? Reflections on the relationship between transparency and trust. Acad Med. 2019;94(6):757-759. https://doi.org/10.1097/ACM.0000000000002710
The collective struggle felt by healthcare workers simultaneously learning about and caring for patients impacted by SARS-CoV2 infections throughout 2020 was physically and emotionally exhausting. The majority of us had never experienced a global pandemic. Beyond our work in the professional arena of ambulatory practices and hospitals, we also felt the soul-crushing impact of the pandemic in every other aspect of our lives. Preexisting health disparities were amplified by COVID-19. Some of the most affected communities also bore the weight of an additional tsunami of ongoing racial injustice.1 And as healthcare workers, we did our best to process and navigate it all while trying to avoid burnout—as well as being infected with COVID-19 ourselves. When the news of the highly effective vaccines against SARS-CoV2 receiving emergency use authorization broke late in 2020, it felt like a light at the end of a very dark tunnel.
In the weeks preceding wide availability of the vaccines, it became apparent that significant numbers of people lacked confidence in the vaccines. Given the disproportionate impact of COVID-19 on racial minorities, much of the discussion centered around “vaccine hesitancy” in these communities. Reasons such as historical mistrust, belief in conspiracy theories, and misinformation emerged as the leading explanations.2 Campaigns and educational programs targeting Black Americans were quickly developed to counter this widely distributed narrative.
Vaccine uptake also became politicized, which created additional challenges. As schools and businesses reopened, the voices of those opposing pandemic mitigation mandates such as masking and vaccination were highlighted by media outlets. And though a large movement of individuals who had opted against vaccines existed well before the pandemic, with few exceptions, that number had never been great enough to impact public health to this extent.3 This primarily nonminority group of unvaccinated individuals also morphed into another monolithic identity: the “anti-vaxxer.”
The lion’s share of discussions around vaccine uptake centered on these two groups: the “vaccine hesitant” minority and the “anti-vaxxer.” The perspectives and frustration around these two stereotypical unvaccinated groups were underscored in journals and the lay press. But those working in communities and in direct care came into contact with countless COVID-19-positive patients who were unvaccinated and fell into neither of these categories. There was a large swath of vulnerable people who still had unanswered questions and mistrust in the medical system standing in their way. Awareness of health disparities among racial minorities is something that was discussed among providers, but it was something experienced and felt by patients daily in regard to so much more than just COVID-19.
With broader access to vaccines through retail, community-based, and clinical facilities, more patients who desired vaccination had the opportunity. After an initial rise in vaccine uptake, the numbers plateaued. But what remained was the repetitive messaging and sustained focus directed toward Black people and their “vaccine hesitancy.”
Grady Memorial Hospital, a public safety net hospital in Atlanta, serves a predominantly Black and uninsured patient population. We found that a “FAQ” approach with a narrow range of hypothetical ideas about unvaccinated minorities clashed with the reality of what we encountered in clinical environments and the community. While misinformation did appear to be prevalent, we appreciated that the context and level of conviction were heterogenous. We appreciated that each individual conversation could reveal something new to us about that unique patient and their personal concerns about vaccination. As time moved forward, it became clear that there was no playbook for any group, especially for historically disadvantaged communities. Importantly, it was recognized that attempts to anticipate what may be a person’s barrier to vaccination often worked to further erode trust. However, when we focused on creating a space for dialogue, we found we were able to move beyond information-sharing and instead were able to co-construct interpretations of information and co-create solutions that matched patients’ values and lived experiences.4 Through dialogue, we were better able to be transparent about our own experiences, which ultimately facilitated authentic conversations with patients.
In September 2021, we approached our hospital leadership with a patient-centered strategy aimed at providing our patients, staff, and visitors a psychologically safe place to discuss vaccine-related concerns without judgment. With their support, we set up a table in the busiest part of our hospital atrium between the information desk and vaccine-administration site. Beside it was a folding board sign with an image and these words:
“Still unsure about being vaccinated? Let’s talk about it.”
We aptly called the area the “No Judgment Zone.”
The No Judgment Zone is collaboratively staffed in 1- to 2-hour voluntary increments by physician faculty and resident physicians at Emory University School of Medicine and Morehouse School of Medicine. Our goal is to increase patient trust by honoring individual vaccine-related concerns without shame or ridicule. We also work to increase patient trust by being transparent around our own experiences with COVID-19; by sharing our own journeys, concerns, and challenges, we are better able to engage in meaningful dialogue. Also, recognizing the power of logistical barriers, in addition to answering questions, we offer physical assistance with check-in, forms, and escorts to our administration areas. The numbers of unique visits have varied from day to day, but the impact of each individual encounter cannot be overstated.
Here, we describe our approach to interactions at the No Judgment Zone. These are the instructions offered to our volunteers. Though we offer some explicit examples, each talking point is designed to open the door to a patient-centered individual dialogue. We believe that these strategies can be applied to clinical settings as well as any conversation surrounding vaccination with those who have not yet decided to be vaccinated.
THE GRADY “NO JUDGMENT ZONE” INTERACTION APPROACH
No Labels
Try to think of all who are not yet vaccinated as “on a spectrum of deliberation” about their decision—not “hesitant” or “anti-vaxxer.”
Step 1: Gratitude
- “Thank you for stopping to talk to us today.”
- “I appreciate you taking the time.”
- “Before we start—I’m glad you’re here. Thanks.”
Step 2: Determine Where They Are
- Has the person you’re speaking with been vaccinated yet?
- If no, ask: “On a scale of 0 to 10—zero being “I will never get vaccinated under any circumstances” and 10 being ‘I will definitely get vaccinated’—what number would you give yourself?”
- If the person is a firm zero: “Is there anything I might be able to share with you or tell you about that might move you away from that perspective?”
- If the answer is NO: “It sounds like you’ve thought a lot about this and are no longer deliberating about whether you will be vaccinated. If you find yourself considering it, come back to talk with us, okay?” We are not here to debate or argue. We also need to avail ourselves to those who are open to changing their mind.
- If they say anything other than zero, move to an open-ended question about #WhatsYourWhy.
Step 3: #WhatsYourWhy
- “What would you say has been your main reason for not getting vaccinated yet?”
- “Tell me what has stood in the way of you getting vaccinated.”
- Remember: Assume nothing. It may have nothing to do with misinformation, fear, or perceived threat. It could be logistics or many other things. You will not know unless you ask.
- Providers should feel encouraged to also share their why as well and the reasons they encouraged their parents/kids/loved ones to get vaccinated. Making it personal can help establish connection and be more compelling.
Step 4: Listen Completely
- Give full eye contact. Slow all body movements. Use facilitative gestures to let the person know you are listening.
- Do not plan what you wish to say next.
- Limit reactions to misinformation. Shame and judgment can be subtle. Be mindful.
- Repeat the concern back if you are not sure or want to confirm that you’ve heard correctly.
- Ask questions for clarity if you aren’t sure.
Step 5: Affirm All Concerns and Find Common Ground
- “I can only imagine how scary it must be to take a shot that you believe could cause you to not be able to have babies.”
- “You aren’t alone. That’s a concern that many of my patients have had, too. May I share some information about that with you?”
- “When I first heard about the vaccine, I worried it was too new, too. Can I share what I learned?”
Step 6: Provide Factual Information
- Without excessive medical jargon, offer factual information aimed at each concern or question. Probe to be certain your patient understands through a teach-back or question.
- If you are unsure about the answer to their question, admit that you don’t know. You can also ask a colleague or the attending with you. Another option is to call someone or say “Let’s pull this up together.” Then share your answer.
- It is okay to acknowledge that the healthcare system has not and does not always do right by minority populations, especially Black people. Use that as a pivot to why these truths make vaccination that much more important
- Have FAQ information sheets available. Confirm that the patient is comfortable with the information sheet by asking.
Step 7: Offer to Help Them Get Vaccinated Today
- “Would you like me to help you get vaccinated today?”
- “What can I do to assist you with getting vaccinated? Is today a good day?”
- Escort those who agree to the registration area.
- Affirm those plans to get vaccinated or those who feel closer to getting vaccinated after speaking with you.
Step 8: Gratitude
- Close with gratitude and an affirmation.
- “I’m so glad you took the time to talk with us today. You didn’t have to stop.”
- “Feel free to come back to talk to us if you think of any more questions. I’m grateful that you stopped.”
- We are planting seeds. Do not feel pressure to get a person to say yes. Our secret sauce is kindness, respect, and empathy.
- We do not think of our unvaccinated community members as “hesitant.” We approach all as if they are on a spectrum of deliberation.
Step 9: Reflect
- Understand the importance of your service and the potential impact each encounter has.
- Recognize the unique lived experiences of individual patients and how this may impact their deliberation process. While there is urgency and we may feel frustrated, the ultimate goal is to engender trust through respectful interactions.
- Pause for moments of quiet gratitude and self-check-ins.
Conclusion
Just as SARS-CoV2 spreads from one person to many, we recognize that information—factual and otherwise—has the potential to move quickly as well. It is important to realize that providing an opportunity for people to ask questions or receive clarification and confirmation in a safe space is critical. The No Judgement Zone, as the name indicates, offers this opportunity. The conversations that we have in this space are valuable to those who are still considering the vaccine as an option for themselves. The trust required for such conversations is less about the transmission of information and more about the social act of engaging in bidirectional dialogue. The foundation upon which trust is built is consistent trustworthy actions. One such action is respectful communication without shame or ridicule. Another is our willingness to be transparent about our own concerns, experiences, and journeys. Assumptions based upon single-story narratives of the unvaccinated—particularly those from historically marginalized groups—fracture an already fragile confidence in medical authorities.
While we understand that mitigating the ongoing spread of the virus and getting more people vaccinated will call for more than just individual conversations, we believe that respecting the unique perspectives of community members is an equally critical piece to moving forward. Throughout a healthcare worker’s typical day, we work to create personal moments of connection with patients among the immense bustle of other work that has to be done. Initiatives like this one have a focused intentionality behind creating space for patients to feel heard that is not only helpful for vaccine uptake and addressing mistrust, but can also be restorative for providers as well.
1. Manning KD. When grief and crises intersect: perspectives of a Black physician in the time of two pandemics. J Hosp Med. 2020;15(9):566-567. https://doi.org/10.12788/jhm.3481
2. Young S. Black vaccine hesitancy rooted in mistrust, doubts. WebMD. February 2, 2021. Accessed November 1, 2021. https://www.webmd.com/vaccines/covid-19-vaccine/news/20210202/black-vaccine-hesitancy-rooted-in-mistrust-doubts
3. Sanyaolu A, Okorie C, Marinkovic A, et al. Measles outbreak in unvaccinated and partially vaccinated children and adults in the United States and Canada (2018-2019): a narrative review of cases. Inquiry. 2019;56:46958019894098. https://doi.org/10.1177/0046958019894098
4. O’Brien BC. Do you see what I see? Reflections on the relationship between transparency and trust. Acad Med. 2019;94(6):757-759. https://doi.org/10.1097/ACM.0000000000002710
© 2021 Society of Hospital Medicine
The Meaning of Words and Why They Matter During End-of-Life Conversations
Effective communication during end-of-life is crucial for health care delivery, but misinterpretation can influence how the quality of the care is rendered and perceived.
When I was a new palliative care nurse practitioner (NP), I remember my mentor telling me that communication in our field is equivalent to surgical procedures in general surgery. Conversations need to be handled with accuracy and precision, conducted in a timely fashion, and require skills that take practice to sharpen. Over the years, I learned that unlike surgery, we do not have control over how the procedure will flow. We approach patients with a blank canvas, open to receive messages that will be shared and reacted to accordingly. The ability to communicate effectively also requires compassion, which is a trait that tends to be inherent in humans and typically is not learned from textbooks but can be cultivated with training and application.
Among the barriers identified to effective communication are avoiding emotional issues and focusing on technical topics due in part to the fear of lengthy encounters, not allowing patients or families enough time to speak, and reframing instead of validating emotions.1 Many years later, I had the chance to help care for a patient whose story reminds me of how our choice of words and how our interpretation of what we are told can influence the way we care for patients and their families.
Case Presentation
Mr. P, aged 86 years, was admitted to a teaching hospital for pneumonia and heart failure exacerbation. He was treated with diuretics and antibiotics and discharged home on room air after 3 days. He returned to the hospital after 8 days, reporting labored breathing. He was found to be hypoxic, and a further workup revealed acute hypoxic respiratory failure that was likely from severe pulmonary hypertension and exacerbation of his heart failure. Left heart disease is a common cause of pulmonary hypertension, which can lead to right ventricular failure and increased mortality.2
After meeting with his pulmonologist and cardiologist, Mr. P elected for a do-not-resuscitate code status and declined to be intubated. He also refused further diagnostics and life-prolonging treatments for his conditions, including a stress test, cardiac catheterization, and a right heart catheterization. He required bilevel positive airway pressure (BPAP) support at bedtime, which he also declined. He agreed to the use of supplemental oxygen through a nasal cannula and always needed 5 liters of oxygen.
Palliative care was consulted to assist with goals of care discussion. This visit took place during the COVID-19 pandemic, but Mr. P had tested negative for the COVID virus, so the palliative care NP was able to meet with Mr. P in person. He shared his understanding of the serious nature of his condition and the likelihood of a limited life expectancy without further diagnostics and possible life-prolonging treatments. He said his goal was to go home and spend the remainder of his life with his wife. He had not been out of bed since his hospitalization except to transfer to a nearby chair with the help of his nurse due to exertional dyspnea and generalized weakness. Prior to his recent hospitalizations, he was independently ambulating and had no dyspnea when performing strenuous activities. Mr. P shared that his wife was aged in her 70s and was legally blind. He added that she did not require physical assistance, but he was unsure whether she could help him because they had not been in such a situation previously. They had a daughter who visited frequently and helped with driving them to doctors’ appointments and shopping. Mr. P shared that he wanted to go home. After explaining the option of home hospice, Mr. P decided he wanted to receive hospice services at home and asked palliative care NP to contact his daughter to let her know his wishes and to tell her more about how hospice can help with his care.
The palliative care NP met with Mr. P’s nurse and shared the outcome of her visit. His nurse asked the palliative care NP whether she was familiar with his daughter. The nurse added that she wanted the palliative care NP to know that Mr. P’s daughter was quite angry and upset with his doctors after being told about his prognosis. His doctors’ notes also indicated that Mr. P wanted them to contact his daughter regarding his condition and plans for discharge, concluding that he deferred to his daughter for medical decision making.
As Mr. P’s hospitalization took place during the COVID pandemic, a face-to-face meeting with his family was not possible. The NP spoke with Mr. P’s daughter over the phone to relay his wishes and goals for his care. Mr. P’s daughter cried at times during the conversation and asked whether his condition was really that serious. The NP allowed Mr. P’s daughter to express her sadness and allowed for periods of silence during the conversation while his daughter gathered her composure. The NP reinforced the clinical information she had been provided by the medical team. Mr. P’s daughter added that he was completely independent, not requiring supplemental oxygen and was otherwise healthy just a month prior. She also asked whether there was truly nothing else that could be done to prolong his life. The NP acknowledged her observations and explained how Mr. P’s body and organs had not been able to bounce back from the recent insults to his overall physical condition.
After being told that Mr. P’s options for treatment were limited not only by his advanced age and comorbidities, but also the limitations and goals for his care he had identified, his daughter supported her father’s decision. The palliative care NP provided her information on how home hospice assists in her father’s care at home, including symptom management, nursing visits, home equipment, family support, among others. Mr. P’s daughter also said she would relay the information to her mother and call the palliative care NP if they had additional questions or concerns.
The outcome of her visit with Mr. P and his daughter were relayed by the palliative care NP to his acute health care team through an official response to the consultation request via his electronic health record. The palliative care NP also alerted the palliative care social worker to follow-up with Mr. P, his daughter, and his acute health care team to coordinate hospice services at the time of his discharge from the hospital.
Mr. P was discharged from the hospital with home hospice services after a few days. Three weeks later, Mr. P passed away peacefully on the in-patient unit of his home hospice agency as his physical care needs became too much for his family to provide at home a few days before his death. The palliative care social worker later shared with the NP that Mr. P’s daughter shared her gratitude and satisfaction with the care he had received not only from palliative care, but also from everyone during his hospitalization.
Discussion
Key themes found in end-of-life (EOL) communication with families and caregivers include highlighting clinical deterioration, involvement in decision making, continuation of high-quality care after cessation of aggressive measures, tailoring to individuals, clarity, honesty, and use of techniques in delivery.2 Some of the techniques identified were pacing, staging, and repetition.3 Other techniques that can be beneficial include allowing for time to express one’s feelings, being comfortable with brief periods of silence, validating observations shared, among others. These themes were evident in the interactions that his health care team had with Mr. P and his daughter. With honesty and clarity, various members of the health care team repeatedly shared information regarding his clinical deterioration.
Family Influence
EOL decision-making roles within a family tend to originate from family interactional histories, familial roles as well as decision-making situations the family faces.4 The US medical and legal systems also recognize formal role assignments for surrogate decision makers.4 In the case of Mr. P, his advance directive (AD) identified his daughter as his surrogate decision maker. ADs are written statements made in advance by patients expressing their wishes and limitations for treatment as well as appointing surrogate decision makers when they become unable to decide for themselves in the future.5
During discussions about the goals for his care, Mr. P made his own medical decisions and elected to pursue a comfort-focused approach to care. His request for his health care team to reach out to his daughter was largely due to his need for assistance in explaining the complexity of his clinical condition to her and how hospice services would be helpful with his EOL care. Mr. P depended on his daughter to bring him to the hospital or to his doctors’ appointments, and she had been a major source of support for him and his wife. Contrary to the belief of some of his health care practitioners, Mr. P was not deferring his medical decisions to his daughter but rather allowing for her participation as his health care partner.
Communication between nurses and patients has been found to be challenging to both parties. Nurses express difficulties in areas that include supporting patients and families after they have had a difficult conversation with their physicians and responding to patients and family members’ emotions like anger.6 EOL care issues, such as family barriers to prognostic understanding, can interfere with psychosocial care.6 Families of patients approaching the EOL describe feeling mentally worn down and being unable to think straight, leading to feelings of being overwhelmed.7 They feel the need to be in a place where they can accept the content of difficult EOL conversations to be able to effectively engage.7
Studies have shown that family members of patients at the EOL experience stress, anxiety, fatigue and depression.8 Reactions that can be perceived as anger may not be so nor directed to the health care team. Questions raised regarding the accuracy of prognostication and treatment recommendations may not necessarily reflect concerns about the quality of care received but an exercise of advocacy in exploring other options on behalf of the patient. Allowing time for families to process the information received and react freely are necessary steps to facilitate reaching a place where they can acknowledge the information being relayed.
Communication Skills Training
Every member of the health care team should be equipped with the basic skills to have these conversations. The academic curricula for members of the health care team focuses on developing communication skills, but there has been a lack of content on palliative and EOL care.9
Due to time constraints and limited opportunities in the clinical setting, there has been an increasing use of simulation-based learning activities (SBLA) to enhance communication skills among nursing students.9 At this time, the impact of SBLA in enhancing communication competency is not fully known, but given the lack of clinical opportunities for students, this option is worth considering.9 When asked, nurses recognized the need for improved EOL communication education, training, and guidelines.10 They also felt that a multidisciplinary approach in EOL communication is beneficial. The inclusion of the End-of-Life Nursing Education Consortium (ELNEC) Core training in Bachelor of Science in Nursing programs have led to improved insight on palliative care and nurses’ role in palliative care and hospice among nursing students.11
The Palliative Care and Hospice Education and Training Act of 2017 amended the Public Health Service Act to include improving EOL training for health care providers, including talking about death and dying.12 Even though the Liaison Committee of Medical Education asked medical schools to incorporate EOL care education in the medical school curricula, there is still a lack of developmentally appropriate and supervised EOL education in medical schools.12 Training on grief also has been lacking and less likely to be mandatory among medical students and residents: Workshops are mostly conducted before they can be applied in the clinical setting.13 Meanwhile, resources are available to assist physicians in EOL conversations with patient and families, such as the Serious Illness Conversation Guide, The Conversation Project, and Stanford’s Letter Project.12
Conclusions
Palliative consultation is associated with an overall improvement in EOL care, communication, and support, according to families of deceased patients.14 It has also been shown to enhance patients’ quality of life and mood, improve documentation of resuscitation preferences, and lead to less aggressive care at the EOL, including less chemotherapy.15 Integration of palliative care in the care of patients hospitalized with acute heart failure has been associated with improved quality of life, decreased symptom burden and depressive symptoms, and increased participation in advance care planning.16
The involvement of palliative care in the care of patients and their families at EOL enhances goals of care discussions that improve understanding for everyone involved. It helps provide consistency with the message being delivered by the rest of the health care team to patients and families regarding prognosis and recommendations. Palliative care can provide an alternative when all other aggressive measures are no longer helpful and allow for the continuation of care with a shift in focus from prolonging life to promoting its quality. Furthermore, palliative care involvement for care of patients with life-limiting illness also has been found to improve symptom control, decrease hospitalizations and health care costs, and even improve mortality.17A multidisciplinary approach to palliative care EOL conversations is beneficial, but every member of the health care team should have the training, education, and skills to be ready to have these difficult conversations. These health care team members include physicians, advance practice clinicians, nurses, social workers, and chaplains, among others. Patients and families are likely to be in contact with different members of the health care team who should be able to carry out therapeutic conversations. Using validated tools and resources on communication techniques through evidence-based practice is helpful and should be encouraged. This provides a framework on how EOL conversations should be conducted in the clinical setting to augment the identified lack of training on EOL communication in schools. Repeated opportunities for its use over time will help improve the ability of clinicians to engage in effective EOL communication.
1. MacKenzie AR, Lasota M. Bringing life to death: the need for honest, compassionate, and effective end-of-life conversations. Am Soc Clin Oncol Educ Book. 2020;40:476-484. doi:10.1200/EDBK_279767
2. Krishnan U, Horn E. Pulmonary hypertension due to left heart disease (group 2 pulmonary hypertension) in adults. Accessed September 17, 2021. https://www.uptodate.com/contents/pulmonary-hypertension-due-to-left-heart-disease-group-2-pulmonary-hypertension-in-adults
3. Anderson RJ, Bloch S, Armstrong M, Stone PC, Low JT. Communication between healthcare professionals and relatives of patients approaching the end-of-life: a systematic review of qualitative evidence. Palliat Med. 2019;33(8):926-941. doi:10.1177/0269216319852007
4. Trees AR, Ohs JE, Murray MC. Family communication about end-of-life decisions and the enactment of the decision-maker role. Behav Sci (Basel). 2017;7(2):36. doi:10.3390/bs7020036 5. Arruda LM, Abreu KPB, Santana LBC, Sales MVC. Variables that influence the medical decision regarding advance directives and their impact on end-of-life care. Einstein (Sao Paulo). 2019;18:eRW4852. doi:10.31744/einstein_journal/2020RW4852
6. Banerjee SC, Manna R, Coyle N, et al. The implementation and evaluation of a communication skills training program for oncology nurses. Transl Behav Med. 2017;7(3):615-623. doi:10.1007/s13142-017-0473-5
7. Mitchell S, Spry JL, Hill E, Coad J, Dale J, Plunkett A. Parental experiences of end of life care decision-making for children with life-limiting conditions in the paediatric intensive care unit: a qualitative interview study. BMJ Open. 2019;9(5):e028548. doi:10.1136/bmjopen-2018-028548
8. Laryionava K, Pfeil TA, Dietrich M, Reiter-Theil S, Hiddemann W, Winkler EC. The second patient? Family members of cancer patients and their role in end-of-life decision making. BMC Palliat Care. 2018;17(1):29. doi:10.1186/s12904-018-0288-2
9. Smith MB, Macieira TGR, Bumbach MD, et al. The use of simulation to teach nursing students and clinicians palliative care and end-of-life communication: a systematic review. Am J Hosp Palliat Care. 2018;35(8):1140-1154. doi:10.1177/1049909118761386
10. Griffiths I. What are the challenges for nurses when providing end-of-life care in intensive care units? Br J Nurs. 2019;28(16):1047-1052. doi:10.12968/bjon.2019.28.16.1047
11. Li J, Smothers A, Fang W, Borland M. Undergraduate nursing students’ perception of end-of-life care education placement in the nursing curriculum. J Hosp Palliat Nurs. 2019;21(5):E12-E18. doi:10.1097/NJH.0000000000000533
12. Sutherland R. Dying well-informed: the need for better clinical educationsurrounding facilitating end-of-life conversations. Yale J Biol Med. 2019;92(4):757-764.
13. Sikstrom L, Saikaly R, Ferguson G, Mosher PJ, Bonato S, Soklaridis S. Being there: a scoping review of grief support training in medical education. PLoS One. 2019;14(11):e0224325. doi:10.1371/journal.pone.0224325
14. Yefimova M, Aslakson RA, Yang L, et al. Palliative care and end-of-life outcomes following high-risk surgery. JAMA Surg. 2020;155(2):138-146. doi:10.1001/jamasurg.2019.5083
15. Temel JS, Greer JA, Muzikansky A, et al. Early palliative care for patients with metastatic non-small-cell lung cancer. N Engl J Med. 2010;363(8):733-42. doi:10.1056/NEJMoa1000678.
16. Sidebottom AC, Jorgenson A, Richards H, Kirven J, Sillah A. Inpatient palliative care for patients with acute heart failure: outcomes from a randomized trial. J Palliat Med. 2015;18(2):134-142. doi:org/10.1089/jpm.2014.0192
17. Diop MS, Rudolph JL, Zimmerman KM, Richter MA, Skarf LM. Palliative careinterventions for patients with heart failure: a systematic review and meta-analysis. J Palliat Med. 2017;20(1):84-92. doi:10.1089/jpm.2016.0330
Effective communication during end-of-life is crucial for health care delivery, but misinterpretation can influence how the quality of the care is rendered and perceived.
Effective communication during end-of-life is crucial for health care delivery, but misinterpretation can influence how the quality of the care is rendered and perceived.
When I was a new palliative care nurse practitioner (NP), I remember my mentor telling me that communication in our field is equivalent to surgical procedures in general surgery. Conversations need to be handled with accuracy and precision, conducted in a timely fashion, and require skills that take practice to sharpen. Over the years, I learned that unlike surgery, we do not have control over how the procedure will flow. We approach patients with a blank canvas, open to receive messages that will be shared and reacted to accordingly. The ability to communicate effectively also requires compassion, which is a trait that tends to be inherent in humans and typically is not learned from textbooks but can be cultivated with training and application.
Among the barriers identified to effective communication are avoiding emotional issues and focusing on technical topics due in part to the fear of lengthy encounters, not allowing patients or families enough time to speak, and reframing instead of validating emotions.1 Many years later, I had the chance to help care for a patient whose story reminds me of how our choice of words and how our interpretation of what we are told can influence the way we care for patients and their families.
Case Presentation
Mr. P, aged 86 years, was admitted to a teaching hospital for pneumonia and heart failure exacerbation. He was treated with diuretics and antibiotics and discharged home on room air after 3 days. He returned to the hospital after 8 days, reporting labored breathing. He was found to be hypoxic, and a further workup revealed acute hypoxic respiratory failure that was likely from severe pulmonary hypertension and exacerbation of his heart failure. Left heart disease is a common cause of pulmonary hypertension, which can lead to right ventricular failure and increased mortality.2
After meeting with his pulmonologist and cardiologist, Mr. P elected for a do-not-resuscitate code status and declined to be intubated. He also refused further diagnostics and life-prolonging treatments for his conditions, including a stress test, cardiac catheterization, and a right heart catheterization. He required bilevel positive airway pressure (BPAP) support at bedtime, which he also declined. He agreed to the use of supplemental oxygen through a nasal cannula and always needed 5 liters of oxygen.
Palliative care was consulted to assist with goals of care discussion. This visit took place during the COVID-19 pandemic, but Mr. P had tested negative for the COVID virus, so the palliative care NP was able to meet with Mr. P in person. He shared his understanding of the serious nature of his condition and the likelihood of a limited life expectancy without further diagnostics and possible life-prolonging treatments. He said his goal was to go home and spend the remainder of his life with his wife. He had not been out of bed since his hospitalization except to transfer to a nearby chair with the help of his nurse due to exertional dyspnea and generalized weakness. Prior to his recent hospitalizations, he was independently ambulating and had no dyspnea when performing strenuous activities. Mr. P shared that his wife was aged in her 70s and was legally blind. He added that she did not require physical assistance, but he was unsure whether she could help him because they had not been in such a situation previously. They had a daughter who visited frequently and helped with driving them to doctors’ appointments and shopping. Mr. P shared that he wanted to go home. After explaining the option of home hospice, Mr. P decided he wanted to receive hospice services at home and asked palliative care NP to contact his daughter to let her know his wishes and to tell her more about how hospice can help with his care.
The palliative care NP met with Mr. P’s nurse and shared the outcome of her visit. His nurse asked the palliative care NP whether she was familiar with his daughter. The nurse added that she wanted the palliative care NP to know that Mr. P’s daughter was quite angry and upset with his doctors after being told about his prognosis. His doctors’ notes also indicated that Mr. P wanted them to contact his daughter regarding his condition and plans for discharge, concluding that he deferred to his daughter for medical decision making.
As Mr. P’s hospitalization took place during the COVID pandemic, a face-to-face meeting with his family was not possible. The NP spoke with Mr. P’s daughter over the phone to relay his wishes and goals for his care. Mr. P’s daughter cried at times during the conversation and asked whether his condition was really that serious. The NP allowed Mr. P’s daughter to express her sadness and allowed for periods of silence during the conversation while his daughter gathered her composure. The NP reinforced the clinical information she had been provided by the medical team. Mr. P’s daughter added that he was completely independent, not requiring supplemental oxygen and was otherwise healthy just a month prior. She also asked whether there was truly nothing else that could be done to prolong his life. The NP acknowledged her observations and explained how Mr. P’s body and organs had not been able to bounce back from the recent insults to his overall physical condition.
After being told that Mr. P’s options for treatment were limited not only by his advanced age and comorbidities, but also the limitations and goals for his care he had identified, his daughter supported her father’s decision. The palliative care NP provided her information on how home hospice assists in her father’s care at home, including symptom management, nursing visits, home equipment, family support, among others. Mr. P’s daughter also said she would relay the information to her mother and call the palliative care NP if they had additional questions or concerns.
The outcome of her visit with Mr. P and his daughter were relayed by the palliative care NP to his acute health care team through an official response to the consultation request via his electronic health record. The palliative care NP also alerted the palliative care social worker to follow-up with Mr. P, his daughter, and his acute health care team to coordinate hospice services at the time of his discharge from the hospital.
Mr. P was discharged from the hospital with home hospice services after a few days. Three weeks later, Mr. P passed away peacefully on the in-patient unit of his home hospice agency as his physical care needs became too much for his family to provide at home a few days before his death. The palliative care social worker later shared with the NP that Mr. P’s daughter shared her gratitude and satisfaction with the care he had received not only from palliative care, but also from everyone during his hospitalization.
Discussion
Key themes found in end-of-life (EOL) communication with families and caregivers include highlighting clinical deterioration, involvement in decision making, continuation of high-quality care after cessation of aggressive measures, tailoring to individuals, clarity, honesty, and use of techniques in delivery.2 Some of the techniques identified were pacing, staging, and repetition.3 Other techniques that can be beneficial include allowing for time to express one’s feelings, being comfortable with brief periods of silence, validating observations shared, among others. These themes were evident in the interactions that his health care team had with Mr. P and his daughter. With honesty and clarity, various members of the health care team repeatedly shared information regarding his clinical deterioration.
Family Influence
EOL decision-making roles within a family tend to originate from family interactional histories, familial roles as well as decision-making situations the family faces.4 The US medical and legal systems also recognize formal role assignments for surrogate decision makers.4 In the case of Mr. P, his advance directive (AD) identified his daughter as his surrogate decision maker. ADs are written statements made in advance by patients expressing their wishes and limitations for treatment as well as appointing surrogate decision makers when they become unable to decide for themselves in the future.5
During discussions about the goals for his care, Mr. P made his own medical decisions and elected to pursue a comfort-focused approach to care. His request for his health care team to reach out to his daughter was largely due to his need for assistance in explaining the complexity of his clinical condition to her and how hospice services would be helpful with his EOL care. Mr. P depended on his daughter to bring him to the hospital or to his doctors’ appointments, and she had been a major source of support for him and his wife. Contrary to the belief of some of his health care practitioners, Mr. P was not deferring his medical decisions to his daughter but rather allowing for her participation as his health care partner.
Communication between nurses and patients has been found to be challenging to both parties. Nurses express difficulties in areas that include supporting patients and families after they have had a difficult conversation with their physicians and responding to patients and family members’ emotions like anger.6 EOL care issues, such as family barriers to prognostic understanding, can interfere with psychosocial care.6 Families of patients approaching the EOL describe feeling mentally worn down and being unable to think straight, leading to feelings of being overwhelmed.7 They feel the need to be in a place where they can accept the content of difficult EOL conversations to be able to effectively engage.7
Studies have shown that family members of patients at the EOL experience stress, anxiety, fatigue and depression.8 Reactions that can be perceived as anger may not be so nor directed to the health care team. Questions raised regarding the accuracy of prognostication and treatment recommendations may not necessarily reflect concerns about the quality of care received but an exercise of advocacy in exploring other options on behalf of the patient. Allowing time for families to process the information received and react freely are necessary steps to facilitate reaching a place where they can acknowledge the information being relayed.
Communication Skills Training
Every member of the health care team should be equipped with the basic skills to have these conversations. The academic curricula for members of the health care team focuses on developing communication skills, but there has been a lack of content on palliative and EOL care.9
Due to time constraints and limited opportunities in the clinical setting, there has been an increasing use of simulation-based learning activities (SBLA) to enhance communication skills among nursing students.9 At this time, the impact of SBLA in enhancing communication competency is not fully known, but given the lack of clinical opportunities for students, this option is worth considering.9 When asked, nurses recognized the need for improved EOL communication education, training, and guidelines.10 They also felt that a multidisciplinary approach in EOL communication is beneficial. The inclusion of the End-of-Life Nursing Education Consortium (ELNEC) Core training in Bachelor of Science in Nursing programs have led to improved insight on palliative care and nurses’ role in palliative care and hospice among nursing students.11
The Palliative Care and Hospice Education and Training Act of 2017 amended the Public Health Service Act to include improving EOL training for health care providers, including talking about death and dying.12 Even though the Liaison Committee of Medical Education asked medical schools to incorporate EOL care education in the medical school curricula, there is still a lack of developmentally appropriate and supervised EOL education in medical schools.12 Training on grief also has been lacking and less likely to be mandatory among medical students and residents: Workshops are mostly conducted before they can be applied in the clinical setting.13 Meanwhile, resources are available to assist physicians in EOL conversations with patient and families, such as the Serious Illness Conversation Guide, The Conversation Project, and Stanford’s Letter Project.12
Conclusions
Palliative consultation is associated with an overall improvement in EOL care, communication, and support, according to families of deceased patients.14 It has also been shown to enhance patients’ quality of life and mood, improve documentation of resuscitation preferences, and lead to less aggressive care at the EOL, including less chemotherapy.15 Integration of palliative care in the care of patients hospitalized with acute heart failure has been associated with improved quality of life, decreased symptom burden and depressive symptoms, and increased participation in advance care planning.16
The involvement of palliative care in the care of patients and their families at EOL enhances goals of care discussions that improve understanding for everyone involved. It helps provide consistency with the message being delivered by the rest of the health care team to patients and families regarding prognosis and recommendations. Palliative care can provide an alternative when all other aggressive measures are no longer helpful and allow for the continuation of care with a shift in focus from prolonging life to promoting its quality. Furthermore, palliative care involvement for care of patients with life-limiting illness also has been found to improve symptom control, decrease hospitalizations and health care costs, and even improve mortality.17A multidisciplinary approach to palliative care EOL conversations is beneficial, but every member of the health care team should have the training, education, and skills to be ready to have these difficult conversations. These health care team members include physicians, advance practice clinicians, nurses, social workers, and chaplains, among others. Patients and families are likely to be in contact with different members of the health care team who should be able to carry out therapeutic conversations. Using validated tools and resources on communication techniques through evidence-based practice is helpful and should be encouraged. This provides a framework on how EOL conversations should be conducted in the clinical setting to augment the identified lack of training on EOL communication in schools. Repeated opportunities for its use over time will help improve the ability of clinicians to engage in effective EOL communication.
1. MacKenzie AR, Lasota M. Bringing life to death: the need for honest, compassionate, and effective end-of-life conversations. Am Soc Clin Oncol Educ Book. 2020;40:476-484. doi:10.1200/EDBK_279767
2. Krishnan U, Horn E. Pulmonary hypertension due to left heart disease (group 2 pulmonary hypertension) in adults. Accessed September 17, 2021. https://www.uptodate.com/contents/pulmonary-hypertension-due-to-left-heart-disease-group-2-pulmonary-hypertension-in-adults
3. Anderson RJ, Bloch S, Armstrong M, Stone PC, Low JT. Communication between healthcare professionals and relatives of patients approaching the end-of-life: a systematic review of qualitative evidence. Palliat Med. 2019;33(8):926-941. doi:10.1177/0269216319852007
4. Trees AR, Ohs JE, Murray MC. Family communication about end-of-life decisions and the enactment of the decision-maker role. Behav Sci (Basel). 2017;7(2):36. doi:10.3390/bs7020036 5. Arruda LM, Abreu KPB, Santana LBC, Sales MVC. Variables that influence the medical decision regarding advance directives and their impact on end-of-life care. Einstein (Sao Paulo). 2019;18:eRW4852. doi:10.31744/einstein_journal/2020RW4852
6. Banerjee SC, Manna R, Coyle N, et al. The implementation and evaluation of a communication skills training program for oncology nurses. Transl Behav Med. 2017;7(3):615-623. doi:10.1007/s13142-017-0473-5
7. Mitchell S, Spry JL, Hill E, Coad J, Dale J, Plunkett A. Parental experiences of end of life care decision-making for children with life-limiting conditions in the paediatric intensive care unit: a qualitative interview study. BMJ Open. 2019;9(5):e028548. doi:10.1136/bmjopen-2018-028548
8. Laryionava K, Pfeil TA, Dietrich M, Reiter-Theil S, Hiddemann W, Winkler EC. The second patient? Family members of cancer patients and their role in end-of-life decision making. BMC Palliat Care. 2018;17(1):29. doi:10.1186/s12904-018-0288-2
9. Smith MB, Macieira TGR, Bumbach MD, et al. The use of simulation to teach nursing students and clinicians palliative care and end-of-life communication: a systematic review. Am J Hosp Palliat Care. 2018;35(8):1140-1154. doi:10.1177/1049909118761386
10. Griffiths I. What are the challenges for nurses when providing end-of-life care in intensive care units? Br J Nurs. 2019;28(16):1047-1052. doi:10.12968/bjon.2019.28.16.1047
11. Li J, Smothers A, Fang W, Borland M. Undergraduate nursing students’ perception of end-of-life care education placement in the nursing curriculum. J Hosp Palliat Nurs. 2019;21(5):E12-E18. doi:10.1097/NJH.0000000000000533
12. Sutherland R. Dying well-informed: the need for better clinical educationsurrounding facilitating end-of-life conversations. Yale J Biol Med. 2019;92(4):757-764.
13. Sikstrom L, Saikaly R, Ferguson G, Mosher PJ, Bonato S, Soklaridis S. Being there: a scoping review of grief support training in medical education. PLoS One. 2019;14(11):e0224325. doi:10.1371/journal.pone.0224325
14. Yefimova M, Aslakson RA, Yang L, et al. Palliative care and end-of-life outcomes following high-risk surgery. JAMA Surg. 2020;155(2):138-146. doi:10.1001/jamasurg.2019.5083
15. Temel JS, Greer JA, Muzikansky A, et al. Early palliative care for patients with metastatic non-small-cell lung cancer. N Engl J Med. 2010;363(8):733-42. doi:10.1056/NEJMoa1000678.
16. Sidebottom AC, Jorgenson A, Richards H, Kirven J, Sillah A. Inpatient palliative care for patients with acute heart failure: outcomes from a randomized trial. J Palliat Med. 2015;18(2):134-142. doi:org/10.1089/jpm.2014.0192
17. Diop MS, Rudolph JL, Zimmerman KM, Richter MA, Skarf LM. Palliative careinterventions for patients with heart failure: a systematic review and meta-analysis. J Palliat Med. 2017;20(1):84-92. doi:10.1089/jpm.2016.0330
Centers for Medicare & Medicaid Services Price Publication Requirement: If You Post It, Will They Come?
Patients in the United States continue to experience rising out-of-pocket medical costs, with little access to the price information they desire when making decisions regarding medical care.1 The Centers for Medicare & Medicaid Services (CMS) has taken steps toward transparency by requiring hospitals to publish price information.2 In this issue of the Journal of Hospital Medicine, White and Liao3 break down the new rule, and we further discuss how this policy affects patients, hospitals, and hospitalists.
The new CMS rule requires hospitals to publish the prices of 300 “shoppable” services, including those negotiated with different payors. The rule standardizes how this information is displayed and accessed, with a daily penalty for facilities that fail to comply. Clinics and ambulatory surgical centers are currently excluded, as are facility and ancillary fees, such as those billed by pathology or anesthesiology. As White and Liao point out, a limitation for hospitalists is that this rule will only affect orders for the outpatient setting at discharge. In addition, this rule separates cost from quality. Although quality data are publicly available via CMS, price data are posted directly by hospitals, making a true value assessment difficult. To strengthen the rule, White and Liao recommend the following: increasing the financial penalty for noncompliance; aggregating data centrally to allow for comparisons; adding quality data to cost; expanding included sites and types of services; and adding common additional fees to the service price.
The larger question is whether patients will use these data in the manner intended. Previous studies have found a paradoxical relationship between patients’ expressed desire to compare prices for medical services vs documented low levels of price-shopping behavior. Mehrotra et al1 found that lack of access to data as well as loyalty to providers were significant barriers to using price data effectively. The CMS rule increases access to the price information patients desire but cannot find. However, it is unclear whether available prices will be sufficient to change behaviors given that, aside from those with no insurance and those with high-deductible plans, most patients are fairly removed from the actual cost of service.
This rule may have a larger, unexpected impact on hospitals and access to care. Sharing price data could increase pressure on facilities to merge with larger systems in order to obtain more favorable rates via increased negotiating power. Hospitals that serve poorer communities may not be attractive merger candidates for large systems and could be left out of the push toward consolidation. Charging higher prices for the same services could lead to hospital closures or cuts in resources, potentially exacerbating health inequities for underserved populations.
On the provider end, it is unlikely that price transparency will influence resource utilization. Mummadi et al4 found that displaying price information in the electronic health record did not significantly influence physician ordering behavior. For hospitalists today, the emphasis on “high-value care” is already an important consideration when utilizing healthcare resources, considering the Accreditation Council for Graduate Medical Education (ACGME) requirements for residency, restrictive insurance protocols, and guidelines such as the ACR Appropriateness Criteria and the American Board of Internal Medicine’s Choosing Wisely® campaign. Outside of extremes, separate cost data likely will not make a difference in provider ordering practices.
Although the information from this rule may not cause dramatic practice change, it will allow us to help our patients by providing those interested in price-shopping with data. This policy represents a large step toward a more transparent healthcare system, though it may have limited impact on overall healthcare costs.
1. Mehrotra A, Dean KM, Sinaiko AD, Sood N. Americans support price shopping for health care, but few actually seek out price information. Health Aff (Millwood). 2017;36(8):1392-1400. https://doi.org/10.1377/hlthaff.2016.1471
2. Price Transparency Requirements for Hospitals to Make Standard Charges Public. 45 CFR § 180.20 (2019).
3. White AA, Liao JM. Policy in clinical practice: hospital price transparency. J Hosp Med. 2021;16(11):688-690. https://doi.org/10.12788/jhm.3698
4. Mummadi SR, Mishra R. Effectiveness of provider price display in computerized physician order entry (CPOE) on healthcare quality: a systematic review. J Am Med Inform Assoc. 2018;25(9):1228-1239. https://doi.org/10.1093/jamia/ocy076
Patients in the United States continue to experience rising out-of-pocket medical costs, with little access to the price information they desire when making decisions regarding medical care.1 The Centers for Medicare & Medicaid Services (CMS) has taken steps toward transparency by requiring hospitals to publish price information.2 In this issue of the Journal of Hospital Medicine, White and Liao3 break down the new rule, and we further discuss how this policy affects patients, hospitals, and hospitalists.
The new CMS rule requires hospitals to publish the prices of 300 “shoppable” services, including those negotiated with different payors. The rule standardizes how this information is displayed and accessed, with a daily penalty for facilities that fail to comply. Clinics and ambulatory surgical centers are currently excluded, as are facility and ancillary fees, such as those billed by pathology or anesthesiology. As White and Liao point out, a limitation for hospitalists is that this rule will only affect orders for the outpatient setting at discharge. In addition, this rule separates cost from quality. Although quality data are publicly available via CMS, price data are posted directly by hospitals, making a true value assessment difficult. To strengthen the rule, White and Liao recommend the following: increasing the financial penalty for noncompliance; aggregating data centrally to allow for comparisons; adding quality data to cost; expanding included sites and types of services; and adding common additional fees to the service price.
The larger question is whether patients will use these data in the manner intended. Previous studies have found a paradoxical relationship between patients’ expressed desire to compare prices for medical services vs documented low levels of price-shopping behavior. Mehrotra et al1 found that lack of access to data as well as loyalty to providers were significant barriers to using price data effectively. The CMS rule increases access to the price information patients desire but cannot find. However, it is unclear whether available prices will be sufficient to change behaviors given that, aside from those with no insurance and those with high-deductible plans, most patients are fairly removed from the actual cost of service.
This rule may have a larger, unexpected impact on hospitals and access to care. Sharing price data could increase pressure on facilities to merge with larger systems in order to obtain more favorable rates via increased negotiating power. Hospitals that serve poorer communities may not be attractive merger candidates for large systems and could be left out of the push toward consolidation. Charging higher prices for the same services could lead to hospital closures or cuts in resources, potentially exacerbating health inequities for underserved populations.
On the provider end, it is unlikely that price transparency will influence resource utilization. Mummadi et al4 found that displaying price information in the electronic health record did not significantly influence physician ordering behavior. For hospitalists today, the emphasis on “high-value care” is already an important consideration when utilizing healthcare resources, considering the Accreditation Council for Graduate Medical Education (ACGME) requirements for residency, restrictive insurance protocols, and guidelines such as the ACR Appropriateness Criteria and the American Board of Internal Medicine’s Choosing Wisely® campaign. Outside of extremes, separate cost data likely will not make a difference in provider ordering practices.
Although the information from this rule may not cause dramatic practice change, it will allow us to help our patients by providing those interested in price-shopping with data. This policy represents a large step toward a more transparent healthcare system, though it may have limited impact on overall healthcare costs.
1. Mehrotra A, Dean KM, Sinaiko AD, Sood N. Americans support price shopping for health care, but few actually seek out price information. Health Aff (Millwood). 2017;36(8):1392-1400. https://doi.org/10.1377/hlthaff.2016.1471
2. Price Transparency Requirements for Hospitals to Make Standard Charges Public. 45 CFR § 180.20 (2019).
3. White AA, Liao JM. Policy in clinical practice: hospital price transparency. J Hosp Med. 2021;16(11):688-690. https://doi.org/10.12788/jhm.3698
4. Mummadi SR, Mishra R. Effectiveness of provider price display in computerized physician order entry (CPOE) on healthcare quality: a systematic review. J Am Med Inform Assoc. 2018;25(9):1228-1239. https://doi.org/10.1093/jamia/ocy076
© 2021 Society of Hospital Medicine
Goal-Concordant Care After Hospitalization for Serious Acute Illness: A Key Opportunity for Hospitalists in Patient-Centered Outcomes
Care concordant with patient goals of care (GOC) is a central component of quality. Communication about GOC is associated with improved quality of life, reduced resource utilization, and optimized end-of-life (EOL) care. Prior literature has focused on outpatient populations, with little knowledge based on preferences elicited from patients hospitalized for serious acute illness.1 The consequent knowledge gap relates to a dimension of practice through which hospitalists can improve patient-centered care by clarifying patient preferences for goal-directed treatments both during and following hospitalization.2 Implementing interventions that optimize shared decision-making through a personalized serious- illness care plan is a high-priority research area.2
In this issue, to estimate how frequently GOC are assessed during hospitalization for serious illness and the concordance between identified goals and postdischarge care, Taylor et al3 retrospectively evaluated a cohort of sepsis survivors through electronic health record (EHR) review. A standardized EHR care alignment tool and a comprehensive EHR assessment demonstrated that only 19% and 40% of patients, respectively, had identifiable GOC documented. Goal-concordant care was subsequently observed among 68% of patients with identified goals, consistent with prior work demonstrating goal-concordance in this range.1 Data on EOL care provided to decedents in an integrated health system notably showed that 89% received goal-concordant treatments.4 This difference may stem from clinicians’ emphasis on goal ascertainment at the EOL, a propensity reflected in the comparative characteristics of patients with goals documented in the current study’s Table.3 Investigators took advantage of unique inpatient and postdischarge clinical information from a sepsis patient sample to provide novel insights into the inadequacy of patient preference assessment and the substantial frequency of goal-discordant care resulting from insufficient attention to GOC.
This study suggests a critical need to improve practices related to identification of GOC in patients hospitalized with serious illness. After adjusting for relevant confounding characteristics, completion of a standardized EHR care alignment tool was strongly associated with receipt of goal-concordant care following discharge.3 Although this tool was only completed in 19% of patients, this finding suggests that elicitation of patient preferences is an under-addressed step in facilitating patient-centered transitions of care. In particular, the low 39% rate of goal-concordant care among patients prioritizing comfort over longevity is noteworthy, but consistent with prior literature.1 This degree of discordance highlights provision of goal-concordant care following hospitalization as a key, yet unfulfilled, patient-centered-care quality metric.
The identified shortcomings in communication and care represent an important opportunity for hospitalists to enhance the extent to which survivors of critical illness receive care respectful of their preferences and values. Given the importance of effective discharge handoff practices in hospital medicine,2 future work should address assertively incorporating GOC into transitions after serious acute illness. Enhancing communication of these goals at discharge may benefit patients at high risk of readmission and other postdischarge adverse events, particularly for patients with comfort-focused GOC.
The study is limited in its derivation from trial participants with a specific clinical syndrome in a single health system. Also, investigators’ classification of a single patient goal does not reflect the multifactorial objectives of health interventions. In addition, since patient-reported GOC discussions correlate more highly with goal-concordant care than those identified through EHRs,5 future work should ascertain the generalizability of the identified gaps in practice.
The findings of this study underscore the need for clinicians to promote GOC assessment and documentation during hospitalization for high-risk conditions, such as sepsis. Tracking rates of GOC elicitation and goal-concordant care following discharge should be incorporated into quality measurement systems as important patient-centered dimensions of care. Hospitalists can fill a critical void by helping to correct the deficiencies that exist in respecting the preferences of survivors of serious acute illness.
1. Modes ME, Heckbert SR, Engelberg RA, Nielsen EL, Curtis JR, Kross EK. Patient-reported receipt of goal-concordant care among seriously ill outpatients-prevalence and associated factors. J Pain Symptom Manage. 2020;60(4):765-773. https://doi.org/10.1016/j.jpainsymman.2020.04.026
2. Harrison JD, Archuleta M, Avitia E, et al. Developing a patient- and family-centered research agenda for hospital medicine: the Improving Hospital Outcomes through Patient Engagement (i-HOPE) Study. J Hosp Med. 2020;15(6):331-337. https://doi.org/10.12788/jhm.3386
3. Taylor SP, Kowalkowski MA, Courtright KR, et al. Deficits in identification of goals and goal-concordant care after sepsis hospitalization. J Hosp Med. 2021;16(11):645-651. https://doi.org/10.12788/jhm.3714
4. Glass DP, Wang SE, Minardi PM, Kanter MH. Concordance of end-of-life care with end-of-life wishes in an integrated health care system. JAMA Netw Open. 2021;4(4):e213053. https://doi.org/10.1001/jamanetworkopen.2021.3053
5. Modes ME, Engelberg RA, Downey L, Nielsen EL, Curtis JR, Kross EK. Did a goals-of-care discussion happen? Differences in the occurrence of goals-of-care discussions as reported by patients, clinicians, and in the electronic health record. J Pain Symptom Manage. 2019;57(2):251-259. https://doi.org/10.1016/j.jpainsymman.2018.10.507
Care concordant with patient goals of care (GOC) is a central component of quality. Communication about GOC is associated with improved quality of life, reduced resource utilization, and optimized end-of-life (EOL) care. Prior literature has focused on outpatient populations, with little knowledge based on preferences elicited from patients hospitalized for serious acute illness.1 The consequent knowledge gap relates to a dimension of practice through which hospitalists can improve patient-centered care by clarifying patient preferences for goal-directed treatments both during and following hospitalization.2 Implementing interventions that optimize shared decision-making through a personalized serious- illness care plan is a high-priority research area.2
In this issue, to estimate how frequently GOC are assessed during hospitalization for serious illness and the concordance between identified goals and postdischarge care, Taylor et al3 retrospectively evaluated a cohort of sepsis survivors through electronic health record (EHR) review. A standardized EHR care alignment tool and a comprehensive EHR assessment demonstrated that only 19% and 40% of patients, respectively, had identifiable GOC documented. Goal-concordant care was subsequently observed among 68% of patients with identified goals, consistent with prior work demonstrating goal-concordance in this range.1 Data on EOL care provided to decedents in an integrated health system notably showed that 89% received goal-concordant treatments.4 This difference may stem from clinicians’ emphasis on goal ascertainment at the EOL, a propensity reflected in the comparative characteristics of patients with goals documented in the current study’s Table.3 Investigators took advantage of unique inpatient and postdischarge clinical information from a sepsis patient sample to provide novel insights into the inadequacy of patient preference assessment and the substantial frequency of goal-discordant care resulting from insufficient attention to GOC.
This study suggests a critical need to improve practices related to identification of GOC in patients hospitalized with serious illness. After adjusting for relevant confounding characteristics, completion of a standardized EHR care alignment tool was strongly associated with receipt of goal-concordant care following discharge.3 Although this tool was only completed in 19% of patients, this finding suggests that elicitation of patient preferences is an under-addressed step in facilitating patient-centered transitions of care. In particular, the low 39% rate of goal-concordant care among patients prioritizing comfort over longevity is noteworthy, but consistent with prior literature.1 This degree of discordance highlights provision of goal-concordant care following hospitalization as a key, yet unfulfilled, patient-centered-care quality metric.
The identified shortcomings in communication and care represent an important opportunity for hospitalists to enhance the extent to which survivors of critical illness receive care respectful of their preferences and values. Given the importance of effective discharge handoff practices in hospital medicine,2 future work should address assertively incorporating GOC into transitions after serious acute illness. Enhancing communication of these goals at discharge may benefit patients at high risk of readmission and other postdischarge adverse events, particularly for patients with comfort-focused GOC.
The study is limited in its derivation from trial participants with a specific clinical syndrome in a single health system. Also, investigators’ classification of a single patient goal does not reflect the multifactorial objectives of health interventions. In addition, since patient-reported GOC discussions correlate more highly with goal-concordant care than those identified through EHRs,5 future work should ascertain the generalizability of the identified gaps in practice.
The findings of this study underscore the need for clinicians to promote GOC assessment and documentation during hospitalization for high-risk conditions, such as sepsis. Tracking rates of GOC elicitation and goal-concordant care following discharge should be incorporated into quality measurement systems as important patient-centered dimensions of care. Hospitalists can fill a critical void by helping to correct the deficiencies that exist in respecting the preferences of survivors of serious acute illness.
1. Modes ME, Heckbert SR, Engelberg RA, Nielsen EL, Curtis JR, Kross EK. Patient-reported receipt of goal-concordant care among seriously ill outpatients-prevalence and associated factors. J Pain Symptom Manage. 2020;60(4):765-773. https://doi.org/10.1016/j.jpainsymman.2020.04.026
2. Harrison JD, Archuleta M, Avitia E, et al. Developing a patient- and family-centered research agenda for hospital medicine: the Improving Hospital Outcomes through Patient Engagement (i-HOPE) Study. J Hosp Med. 2020;15(6):331-337. https://doi.org/10.12788/jhm.3386
3. Taylor SP, Kowalkowski MA, Courtright KR, et al. Deficits in identification of goals and goal-concordant care after sepsis hospitalization. J Hosp Med. 2021;16(11):645-651. https://doi.org/10.12788/jhm.3714
4. Glass DP, Wang SE, Minardi PM, Kanter MH. Concordance of end-of-life care with end-of-life wishes in an integrated health care system. JAMA Netw Open. 2021;4(4):e213053. https://doi.org/10.1001/jamanetworkopen.2021.3053
5. Modes ME, Engelberg RA, Downey L, Nielsen EL, Curtis JR, Kross EK. Did a goals-of-care discussion happen? Differences in the occurrence of goals-of-care discussions as reported by patients, clinicians, and in the electronic health record. J Pain Symptom Manage. 2019;57(2):251-259. https://doi.org/10.1016/j.jpainsymman.2018.10.507
© 2021 Society of Hospital Medicine
Where Have All the Medicare Inpatients Gone?
The advent of COVID-19 saw a precipitous decline in inpatient admissions. Even before the COVID-19 pandemic, hospitals were seeing a trend toward fewer inpatient admissions for Medicare beneficiaries, which has not been thoroughly examined or explained.1 In this issue, Keohane et al2 studied Medicare inpatient episode trends between 2009 and 2017 and found that, during this period, inpatient episodes per 1000 Medicare fee-for-service (FFS) beneficiaries declined by 18.2%, from 326 to 267 per 1000 beneficiaries.
This trend can be partly explained by changes in the way that care is delivered. First, observation stays have risen, and these are excluded in the authors’ analysis. From 2010 to 2017, observation visits per 1000 beneficiaries increased from 28 to 51.1 Second, due to improved outpatient management, margin constraints, and efficiency gains, hospitals are less likely to admit patients with less complex problems or keep patients overnight for uncomplicated procedural interventions. In cardiology, there has been an increase in the proportion of same-day percutaneous coronary interventions, from 4.5% in 2009 to 28.6% in 2017.3 The authors do not include a quantitative measure of complexity, but their data support this conclusion as they find larger declines in episodes that began with a planned admission and those that involved no use of post–acute care services, and thus were likely less complicated admissions. Finally, the increased use of alternative care sites such as home-based care settings and urgent care clinics, the proliferation of telemedicine, and the continual development of guideline-based therapy have resulted in better outpatient management of diseases.
The growth of value-based care has also contributed to the reduction in inpatient admission. The past decade has seen the growth of bundled-payment contracts, accountable care organizations (ACO), and advanced primary care models. In 2018, an estimated 20% of Medicare beneficiaries were part of an ACO.4 These changes have led healthcare systems to invest in care management and postdischarge interventions, such as postdischarge phone calls, transitional clinics, and transition guides to reduce admissions and readmissions. Johns Hopkins adopted all these strategies to drive performance on the Maryland Total Cost of Care Model, which like an ACO holds hospitals accountable for both inpatient and outpatient costs incurred by Medicare FFS beneficiaries. A consistent theme among successful ACOs has been a reduction in inpatient spending.5
The authors are likely undercounting the volume of admissions by Medicare beneficiaries. First, to define an episode, they leverage the Medicare definition of bundles and include traditional Medicare inpatient, outpatient, and Part D services 30 days prior to hospitalizations and up to 90 days after. Admissions for the same diagnosis related group that occur in the 90 days after the anchor hospitalization are included in the same episode. From a clinical perspective, it is not intuitively clear why an admission for heart failure or pneumonia that occurs 3 months after an anchor hospitalization would not be defined as a separate and distinct admission rather than a readmission. Second, their analysis focuses on Medicare FFS and does not include Medicare Advantage, which now accounts for 42% of total Medicare beneficiaries. In fact, Medicare Advantage experienced significant growth in enrollment during the study period, increasing from 10 million to 24 million beneficiaries.6
Despite the reduction in inpatient volumes, the authors find that inpatient spending has increased. Spending per episode increased by 11.4% over this period, when adjusted for Medicare payment increases. Actual spending per episode unadjusted for payment increases rose by 25%. Thus, they astutely point out that most of the increase has been driven by Medicare payment increases. It is likely that increases in the complexity of patients and more dedicated focus on appropriate coding have also contributed. The authors, however, do not provide information on changes to the total cost of care outside of their defined inpatient episodes, a relevant measure to those participating in value-based models.
It is likely that the trend toward fewer inpatient admissions and increased outpatient management of medical conditions will continue as value-based care models grow. Studies like these are important in documenting this trend, but it will be important in future studies to understand how these changes have impacted the quality of care delivered to patients. Prior studies have found that reductions in readmissions through the Hospital Readmission Reduction Program were associated with increases in mortality as a potential unintended consequence.7
1. The Medicare Payment Advisory Commission. A Data Book: Health Care Spending and the Medicare Program. June 2018. Accessed October 25, 2021. http://medpac.gov/docs/default-source/data-book/jun19_databook_entirereport_sec.pdf
2. Keohane LM, Kripalani S, Buntin MB, et al. Traditional Medicare spending on inpatient episodes as hospitalizations decline. J Hosp Med. 2021;16(11):652-658. https://doi.org/10.12788/jhm.3699
3. Bradley SM, Kaltenbach LA, Xiang K, et al. Trends in use and outcomes of same-day discharge following elective percutaneous coronary intervention. JACC Cardiovasc Interv. 2021;14(15):1655-1666. https://doi.org/10.1016/j.jcin.2021.05.043
4. National Association of ACOs. NAACOs overview of the 2018 Medicare ACO class. Accessed October 25, 2021. https://www.naacos.com/overview-of-the-2018-medicare-aco-class
5. McWilliams JM, Hatfield LA, Landon BE, Hamed P, Chernew ME. Medicare spending after 3 years of the Medicare shared savings program. N Engl J Med. 2018;379(12):1139-1149. https://doi.org/10.1056/NEJMsa1803388
6. Freed M, Fuglesten Biniek J, Damico A, Neuman T. Medicare Advantage in 2021: Enrollment update and key trends. KFF. June 21, 2021. Accessed October 25, 2021. https://www.kff.org/medicare/issue-brief/medicare-advantage-in-2021-enrollment-update-and-key-trends/
7. Gupta A, Allen LA, Bhatt DL, et al. Association of the hospital readmissions reduction program implementation with readmission and mortality outcomes in heart failure. JAMA Cardiol. 2018;3(1):44-53. https://doi.org/10.1001/jamacardio.2017.4265
The advent of COVID-19 saw a precipitous decline in inpatient admissions. Even before the COVID-19 pandemic, hospitals were seeing a trend toward fewer inpatient admissions for Medicare beneficiaries, which has not been thoroughly examined or explained.1 In this issue, Keohane et al2 studied Medicare inpatient episode trends between 2009 and 2017 and found that, during this period, inpatient episodes per 1000 Medicare fee-for-service (FFS) beneficiaries declined by 18.2%, from 326 to 267 per 1000 beneficiaries.
This trend can be partly explained by changes in the way that care is delivered. First, observation stays have risen, and these are excluded in the authors’ analysis. From 2010 to 2017, observation visits per 1000 beneficiaries increased from 28 to 51.1 Second, due to improved outpatient management, margin constraints, and efficiency gains, hospitals are less likely to admit patients with less complex problems or keep patients overnight for uncomplicated procedural interventions. In cardiology, there has been an increase in the proportion of same-day percutaneous coronary interventions, from 4.5% in 2009 to 28.6% in 2017.3 The authors do not include a quantitative measure of complexity, but their data support this conclusion as they find larger declines in episodes that began with a planned admission and those that involved no use of post–acute care services, and thus were likely less complicated admissions. Finally, the increased use of alternative care sites such as home-based care settings and urgent care clinics, the proliferation of telemedicine, and the continual development of guideline-based therapy have resulted in better outpatient management of diseases.
The growth of value-based care has also contributed to the reduction in inpatient admission. The past decade has seen the growth of bundled-payment contracts, accountable care organizations (ACO), and advanced primary care models. In 2018, an estimated 20% of Medicare beneficiaries were part of an ACO.4 These changes have led healthcare systems to invest in care management and postdischarge interventions, such as postdischarge phone calls, transitional clinics, and transition guides to reduce admissions and readmissions. Johns Hopkins adopted all these strategies to drive performance on the Maryland Total Cost of Care Model, which like an ACO holds hospitals accountable for both inpatient and outpatient costs incurred by Medicare FFS beneficiaries. A consistent theme among successful ACOs has been a reduction in inpatient spending.5
The authors are likely undercounting the volume of admissions by Medicare beneficiaries. First, to define an episode, they leverage the Medicare definition of bundles and include traditional Medicare inpatient, outpatient, and Part D services 30 days prior to hospitalizations and up to 90 days after. Admissions for the same diagnosis related group that occur in the 90 days after the anchor hospitalization are included in the same episode. From a clinical perspective, it is not intuitively clear why an admission for heart failure or pneumonia that occurs 3 months after an anchor hospitalization would not be defined as a separate and distinct admission rather than a readmission. Second, their analysis focuses on Medicare FFS and does not include Medicare Advantage, which now accounts for 42% of total Medicare beneficiaries. In fact, Medicare Advantage experienced significant growth in enrollment during the study period, increasing from 10 million to 24 million beneficiaries.6
Despite the reduction in inpatient volumes, the authors find that inpatient spending has increased. Spending per episode increased by 11.4% over this period, when adjusted for Medicare payment increases. Actual spending per episode unadjusted for payment increases rose by 25%. Thus, they astutely point out that most of the increase has been driven by Medicare payment increases. It is likely that increases in the complexity of patients and more dedicated focus on appropriate coding have also contributed. The authors, however, do not provide information on changes to the total cost of care outside of their defined inpatient episodes, a relevant measure to those participating in value-based models.
It is likely that the trend toward fewer inpatient admissions and increased outpatient management of medical conditions will continue as value-based care models grow. Studies like these are important in documenting this trend, but it will be important in future studies to understand how these changes have impacted the quality of care delivered to patients. Prior studies have found that reductions in readmissions through the Hospital Readmission Reduction Program were associated with increases in mortality as a potential unintended consequence.7
1. The Medicare Payment Advisory Commission. A Data Book: Health Care Spending and the Medicare Program. June 2018. Accessed October 25, 2021. http://medpac.gov/docs/default-source/data-book/jun19_databook_entirereport_sec.pdf
2. Keohane LM, Kripalani S, Buntin MB, et al. Traditional Medicare spending on inpatient episodes as hospitalizations decline. J Hosp Med. 2021;16(11):652-658. https://doi.org/10.12788/jhm.3699
3. Bradley SM, Kaltenbach LA, Xiang K, et al. Trends in use and outcomes of same-day discharge following elective percutaneous coronary intervention. JACC Cardiovasc Interv. 2021;14(15):1655-1666. https://doi.org/10.1016/j.jcin.2021.05.043
4. National Association of ACOs. NAACOs overview of the 2018 Medicare ACO class. Accessed October 25, 2021. https://www.naacos.com/overview-of-the-2018-medicare-aco-class
5. McWilliams JM, Hatfield LA, Landon BE, Hamed P, Chernew ME. Medicare spending after 3 years of the Medicare shared savings program. N Engl J Med. 2018;379(12):1139-1149. https://doi.org/10.1056/NEJMsa1803388
6. Freed M, Fuglesten Biniek J, Damico A, Neuman T. Medicare Advantage in 2021: Enrollment update and key trends. KFF. June 21, 2021. Accessed October 25, 2021. https://www.kff.org/medicare/issue-brief/medicare-advantage-in-2021-enrollment-update-and-key-trends/
7. Gupta A, Allen LA, Bhatt DL, et al. Association of the hospital readmissions reduction program implementation with readmission and mortality outcomes in heart failure. JAMA Cardiol. 2018;3(1):44-53. https://doi.org/10.1001/jamacardio.2017.4265
© 2021 Society of Hospital Medicine
Problematic Trends in Observation Status for Children’s Hospitals
Two children who presented to emergency departments in different cities were diagnosed with diabetes mellitus and ketoacidosis. On presentation, both had significant anion gap metabolic acidosis. Because the patients were deemed unsafe for discharge, the admitting physician placed orders that dictated hospital care, including an order that designated the stay as observation (OBS) or inpatient (IP) status. During their stay, both patients received care including continuous infusion of insulin, intravenous fluids, and frequent lab monitoring. Each child recovered quickly and was discharged in less than 48 hours.
Despite both patients receiving comparable care, recovering well, and being discharged home after a similar length of stay, their encounter designation may be different. Although the patient outcome is of utmost importance, the consequences of labeling an encounter as OBS or IP status are complex and may impact the financial standing of patients, hospitals, and payors. Determining the trajectory of OBS status and its utilization in the pediatric population is vital to understanding the consequences of this designation.
In this issue of the Journal of Hospital Medicine, Tian et al1 describe the increase in OBS status hospitalizations between 2010 and 2019, with OBS stays accounting for approximately one-third of pediatric hospitalizations within children’s hospitals in 2019. The increase in OBS status use was described in 19 of 20 of the most common All Patient Refined Diagnosis Related Groups, with the highest growth noted for surgical conditions and diabetes mellitus.1 These frequently seen, high-stakes conditions, when expertly managed, may result in a safe discharge within 48 hours of admission, but the labor-intensive technical skills to ensure patient safety and high-value care often differ greatly from the idea of simply “observing” a patient.
The scope creep of OBS status in pediatrics is evident. OBS status was initially designed to acknowledge a prolonged outpatient period of monitoring with a goal of determining whether inpatient hospitalization was warranted. However, in most circumstances, the care of children under OBS status differs little from those under IP status; OBS status patients are usually cared for in the same wards and by the same providers as IP status patients. The similarities in care lead to nearly equivalent hospital costs for IP and OBS stays.2 Comparable hospital costs would be less concerning if reimbursement were proportional, but OBS status hospitalizations are reimbursed at lower outpatient rates.3 The combination of similar costs and lower reimbursement results in a financial liability for children’s hospitals.
Tian et al add to the growing body of literature that underscores concerns with OBS stays.1 Its increasing use over the past decade represents a troubling continuation of increased OBS status use described by Macy et al3 nearly a decade ago, and the variability with which it is applied suggests that the designation has little connection to the clinical status of patients. Instead, its use is more likely influenced by local payor contracts, individual state laws, and provider culture. For individual institutions, this differential application affects more than just reimbursement. OBS stays are often excluded from nationally representative administrative databases, which makes hospital benchmarking, research on outcomes, and accurate comparison of patient populations impossible.4,5
The trends described by Tian et al1 raise concerns about the potential impact that OBS stays have on patients and hospital systems across the country. OBS status was created to serve a clinical need, but its inconsistent use places hospitals and the children they treat at risk. This erratic application of OBS status and the serious results of its assignment to pediatric hospitalizations provide evidence that criteria for OBS need to be standardized or otherwise abandoned outright.
1. Tian Y, Hall M, Ingram M-CE, Hu A, Raval MV. Trends and variation in the use of observation stays at children’s hospitals. J Hosp Med. 2021;16(11):645-651. https://doi.org/10.12788/jhm.3622
2. Fieldston ES, Shah SS, Hall M, et al. Resource utilization for observation-status stays at children’s hospitals. Pediatrics. 2013;131(6):1050-1058. https://doi.org/10.1542/peds.2012-2494
3. Macy ML, Hall M, Shah SS, et al. Pediatric observation status: are we overlooking a growing population in children’s hospitals? J Hosp Med. 2012;7(7):530-536. https://doi.org/10.1002/jhm.1923
4. Synhorst DC, Hall M, Harris M, et al. Hospital observation status and readmission rates. Pediatrics. 2020;146(5):e2020003954. https://doi.org/10.1542/peds.2020-003954
5. Gay JC, Hall M, Morse R, Fieldston ES, Synhorst D, Macy ML. Observation encounters and length of stay benchmarking in children’s hospitals. Pediatrics. 2020;146(5):e20200120. https://doi.org/10.1542/peds.2020-0120
Two children who presented to emergency departments in different cities were diagnosed with diabetes mellitus and ketoacidosis. On presentation, both had significant anion gap metabolic acidosis. Because the patients were deemed unsafe for discharge, the admitting physician placed orders that dictated hospital care, including an order that designated the stay as observation (OBS) or inpatient (IP) status. During their stay, both patients received care including continuous infusion of insulin, intravenous fluids, and frequent lab monitoring. Each child recovered quickly and was discharged in less than 48 hours.
Despite both patients receiving comparable care, recovering well, and being discharged home after a similar length of stay, their encounter designation may be different. Although the patient outcome is of utmost importance, the consequences of labeling an encounter as OBS or IP status are complex and may impact the financial standing of patients, hospitals, and payors. Determining the trajectory of OBS status and its utilization in the pediatric population is vital to understanding the consequences of this designation.
In this issue of the Journal of Hospital Medicine, Tian et al1 describe the increase in OBS status hospitalizations between 2010 and 2019, with OBS stays accounting for approximately one-third of pediatric hospitalizations within children’s hospitals in 2019. The increase in OBS status use was described in 19 of 20 of the most common All Patient Refined Diagnosis Related Groups, with the highest growth noted for surgical conditions and diabetes mellitus.1 These frequently seen, high-stakes conditions, when expertly managed, may result in a safe discharge within 48 hours of admission, but the labor-intensive technical skills to ensure patient safety and high-value care often differ greatly from the idea of simply “observing” a patient.
The scope creep of OBS status in pediatrics is evident. OBS status was initially designed to acknowledge a prolonged outpatient period of monitoring with a goal of determining whether inpatient hospitalization was warranted. However, in most circumstances, the care of children under OBS status differs little from those under IP status; OBS status patients are usually cared for in the same wards and by the same providers as IP status patients. The similarities in care lead to nearly equivalent hospital costs for IP and OBS stays.2 Comparable hospital costs would be less concerning if reimbursement were proportional, but OBS status hospitalizations are reimbursed at lower outpatient rates.3 The combination of similar costs and lower reimbursement results in a financial liability for children’s hospitals.
Tian et al add to the growing body of literature that underscores concerns with OBS stays.1 Its increasing use over the past decade represents a troubling continuation of increased OBS status use described by Macy et al3 nearly a decade ago, and the variability with which it is applied suggests that the designation has little connection to the clinical status of patients. Instead, its use is more likely influenced by local payor contracts, individual state laws, and provider culture. For individual institutions, this differential application affects more than just reimbursement. OBS stays are often excluded from nationally representative administrative databases, which makes hospital benchmarking, research on outcomes, and accurate comparison of patient populations impossible.4,5
The trends described by Tian et al1 raise concerns about the potential impact that OBS stays have on patients and hospital systems across the country. OBS status was created to serve a clinical need, but its inconsistent use places hospitals and the children they treat at risk. This erratic application of OBS status and the serious results of its assignment to pediatric hospitalizations provide evidence that criteria for OBS need to be standardized or otherwise abandoned outright.
1. Tian Y, Hall M, Ingram M-CE, Hu A, Raval MV. Trends and variation in the use of observation stays at children’s hospitals. J Hosp Med. 2021;16(11):645-651. https://doi.org/10.12788/jhm.3622
2. Fieldston ES, Shah SS, Hall M, et al. Resource utilization for observation-status stays at children’s hospitals. Pediatrics. 2013;131(6):1050-1058. https://doi.org/10.1542/peds.2012-2494
3. Macy ML, Hall M, Shah SS, et al. Pediatric observation status: are we overlooking a growing population in children’s hospitals? J Hosp Med. 2012;7(7):530-536. https://doi.org/10.1002/jhm.1923
4. Synhorst DC, Hall M, Harris M, et al. Hospital observation status and readmission rates. Pediatrics. 2020;146(5):e2020003954. https://doi.org/10.1542/peds.2020-003954
5. Gay JC, Hall M, Morse R, Fieldston ES, Synhorst D, Macy ML. Observation encounters and length of stay benchmarking in children’s hospitals. Pediatrics. 2020;146(5):e20200120. https://doi.org/10.1542/peds.2020-0120
© 2021 Society of Hospital Medicine
Leadership & Professional Development: Everyone Resists Change
Nothing changes without personal transformation.
—W Edwards Deming, 1986
Failure is common among quality improvement projects, but also predictable. Health professionals have multiple competing priorities. Improvement projects rarely reduce an individual’s workload. In our experience coaching health professionals, we have found that improvement teams often overlook two important facts: improvement requires behavior change, and everyone resists change.
Quality improvement education focuses on the development of technical skills (eg, process mapping, measure development, data analysis). Technical skills are necessary, but insufficient, to lead change. Process maps and run charts guide improvement work but alone do not motivate frontline staff to change workflows. Rather, soft skills (eg, communication, negotiation, change management, influencing others) convince frontline staff and hospital leaders that change is worth their time and effort.1,2 Successful improvement teams combine technical skills and soft skills to inspire behavior change.
We propose three practical skills that all improvement teams can adopt to inspire change:
Understand your stakeholders’ needs. Early identification and engagement of stakeholders (individuals or groups who may affect or be affected by the project) is critical. Improvement teams must consider stakeholders at multiple levels in the organization, from frontline staff to executives. The easiest way to understand stakeholders is by talking to them. Often, stakeholders lack time for scheduled meetings, so teams must rely on informal conversations in hallways and elevators. The key is to understand what will motivate the stakeholder to change. Put yourself in the stakeholders’ shoes: What are their needs and priorities? How might their needs and priorities motivate them to change? What potential barriers exist that prevent the stakeholder from making a change?
Tailor your message to establish a rationale for change. Build upon what was learned from stakeholders and decide how the rationale for change will be communicated. What can you say that will influence others to see the problem as important? Recognize that the rationale is different for different stakeholders; a financial rationale may inspire hospital leaders but alienate staff who are driven by patient and staff satisfaction. Even carefully crafted messages may not resonate with stakeholders as intended. Improvement teams must monitor the impact of their message with different stakeholders. Developing a clear, concise, and compelling rationale for change is often challenging and iterative. Multiple communication channels (ie, email, newsletters, formal and informal conversations) must be employed to spread your message.
Share small and large wins. Talking with stakeholders is not a one-time event. Stakeholder interest may decrease over time. Frontline staff can become complacent, falling back into old behaviors. Priorities of hospital leadership can shift. Successful teams maintain lines of communication throughout the project to share successes and sustain stakeholder buy-in. Small and large wins matter. Project outcomes (large wins) may take months to achieve. Teams can maintain stakeholder interest by demonstrating that project processes are feasible and acceptable (small wins). Maintaining regular communication also affords teams the opportunity for early identification of organizational barriers and facilitators that may impact their project. Ongoing communication of project wins sets the stage for sustainment by embedding the change within the local culture.
The goal of any improvement project is to create sustainable change. To do this, improvement teams often need hundreds of people to change the way they work. Change is hard, but improvement teams can overcome resistance to it by strategically engaging stakeholders and thoughtfully communicating the rationale for change.
1. Myers JS, Lane-Fall MB, Perfetti AR, et al. Demonstrating the value of postgraduate fellowships for physicians in quality improvement and patient safety. BMJ Qual Saf. 2020;29(8):645-654. https://doi.org/10.1136/bmjqs-2019-010204
2. Rajashekara S, Naik AD, Campbell CM, et al. Using a logic model to design and evaluate a quality improvement leadership course. Acad Med. 2020;95(8):1201-1206. https://doi.org/10.1097/ACM.0000000000003191
Nothing changes without personal transformation.
—W Edwards Deming, 1986
Failure is common among quality improvement projects, but also predictable. Health professionals have multiple competing priorities. Improvement projects rarely reduce an individual’s workload. In our experience coaching health professionals, we have found that improvement teams often overlook two important facts: improvement requires behavior change, and everyone resists change.
Quality improvement education focuses on the development of technical skills (eg, process mapping, measure development, data analysis). Technical skills are necessary, but insufficient, to lead change. Process maps and run charts guide improvement work but alone do not motivate frontline staff to change workflows. Rather, soft skills (eg, communication, negotiation, change management, influencing others) convince frontline staff and hospital leaders that change is worth their time and effort.1,2 Successful improvement teams combine technical skills and soft skills to inspire behavior change.
We propose three practical skills that all improvement teams can adopt to inspire change:
Understand your stakeholders’ needs. Early identification and engagement of stakeholders (individuals or groups who may affect or be affected by the project) is critical. Improvement teams must consider stakeholders at multiple levels in the organization, from frontline staff to executives. The easiest way to understand stakeholders is by talking to them. Often, stakeholders lack time for scheduled meetings, so teams must rely on informal conversations in hallways and elevators. The key is to understand what will motivate the stakeholder to change. Put yourself in the stakeholders’ shoes: What are their needs and priorities? How might their needs and priorities motivate them to change? What potential barriers exist that prevent the stakeholder from making a change?
Tailor your message to establish a rationale for change. Build upon what was learned from stakeholders and decide how the rationale for change will be communicated. What can you say that will influence others to see the problem as important? Recognize that the rationale is different for different stakeholders; a financial rationale may inspire hospital leaders but alienate staff who are driven by patient and staff satisfaction. Even carefully crafted messages may not resonate with stakeholders as intended. Improvement teams must monitor the impact of their message with different stakeholders. Developing a clear, concise, and compelling rationale for change is often challenging and iterative. Multiple communication channels (ie, email, newsletters, formal and informal conversations) must be employed to spread your message.
Share small and large wins. Talking with stakeholders is not a one-time event. Stakeholder interest may decrease over time. Frontline staff can become complacent, falling back into old behaviors. Priorities of hospital leadership can shift. Successful teams maintain lines of communication throughout the project to share successes and sustain stakeholder buy-in. Small and large wins matter. Project outcomes (large wins) may take months to achieve. Teams can maintain stakeholder interest by demonstrating that project processes are feasible and acceptable (small wins). Maintaining regular communication also affords teams the opportunity for early identification of organizational barriers and facilitators that may impact their project. Ongoing communication of project wins sets the stage for sustainment by embedding the change within the local culture.
The goal of any improvement project is to create sustainable change. To do this, improvement teams often need hundreds of people to change the way they work. Change is hard, but improvement teams can overcome resistance to it by strategically engaging stakeholders and thoughtfully communicating the rationale for change.
1. Myers JS, Lane-Fall MB, Perfetti AR, et al. Demonstrating the value of postgraduate fellowships for physicians in quality improvement and patient safety. BMJ Qual Saf. 2020;29(8):645-654. https://doi.org/10.1136/bmjqs-2019-010204
2. Rajashekara S, Naik AD, Campbell CM, et al. Using a logic model to design and evaluate a quality improvement leadership course. Acad Med. 2020;95(8):1201-1206. https://doi.org/10.1097/ACM.0000000000003191
© 2021 Society of Hospital Medicine
Association of Healthcare Access With Intensive Care Unit Utilization and Mortality in Patients of Hispanic Ethnicity Hospitalized With COVID-19
In the United States, health disparities in COVID-19 outcomes (including morbidity and mortality) based on race and ethnicity have been described in the scientific literature and mainstream media.1-7 According to the US Centers for Disease Control and Prevention (CDC), Hispanic people are 3.2 times more likely to be hospitalized with COVID-19 than non-Hispanic White people.8 Further, Hispanic people diagnosed with COVID-19 are 2.3 times more likely to die, adjusted for age, than non-Hispanic White people.9 As the epicenter of the COVID-19 pandemic shifted from the Northeast to the South, the CDC reported that, among people who died from COVID-19 in the United States from May to August 2020, the percentage of Hispanic people increased from 16.3% to 26.4%.10
Published studies on the effect of ethnicity on critical illness or mortality for hospitalized COVID-19 patients are limited and inconsistent. While some studies reported a higher mortality rate for Hispanic patients,11-15 others showed no difference.4,16,17 A recent meta-analysis found that intensive care unit (ICU) utilization and mortality were slightly higher among Hispanic COVID-19 inpatients, but this finding did not reach statistical significance.18 Past studies from different healthcare systems were limited by the small sample size of hospitalized Hispanic patients and the heterogeneity of patients. A comprehensive analysis from a large healthcare system with sufficient sample size is needed to understand the impact of ethnicity on clinical outcomes of hospitalized COVID-19 patients.
Texas Health Resources (THR) is a large integrated healthcare system serving the Dallas-Fort Worth-Arlington (DFW) metropolitan area. According to the 2019 US Census Bureau American Community Survey, Hispanic people comprise 18.4% of the population of this geographic area.19 Congruent with the CDC’s findings, Hispanic patients account for a disproportionate share (32.2%) of hospitalized COVID-19 patients at THR relative to the area’s demographic composition. Aware of the increased risk, we undertook an analysis of the clinical outcomes and the clinical, social, and demographic characteristics of Hispanic patients hospitalized at THR with COVID-19. Our primary goal was to investigate whether clinical outcomes differ by ethnicity among patients hospitalized with COVID-19 and, if so, whether inpatient care or preadmission factors contribute to this difference.
Methods
Study Setting and Overview
We collected data from the single electronic health record (EHR) used by 20 THR hospitals located across the DFW metropolitan area. THR is the largest faith-based, nonprofit health system in North Texas, operating 20 acute care hospitals. Including all access points, such as outpatient facilities and physician group practices, THR serves 7 million residents in 16 counties in North Texas, of whom 16.8% are Hispanic, 73.3% are non-Hispanic, and 9.9% are unclassified, congruent with demographics in the DFW area.
The institutional review boards at THR and UT Southwestern Medical Center approved the study under a waiver of informed consent (as a minimal-risk medical record review). After collection, all data were de-identified prior to statistical analysis.
Cohort, Outcomes, and Covariables
The study cohort included 6097 adult patients with laboratory-confirmed COVID-19 (age ≥18 years) who were admitted as inpatients from March 3 to November 5, 2020. The primary outcomes included ICU utilization and death during hospitalization. We described demographic characteristics using the following variables: age (18–49, 50–64, 65–79, ≥80 years), sex, self-reported ethnicity, and primary spoken language.
We defined a severe baseline condition as an elevated respiratory subscore parsed from the overall MSOFA (Modified Sequential Organ Failure Assessment),20 an elevated Epic Deterioration Index (EDI),21 or an elevated C-reactive protein level (CRP) at baseline (any elevated CRP). Baseline referred to the variable mean during the first available 12-hour window of measurement during the COVID-19 hospital admission, including variables obtained in the emergency department (ED). An elevated MSOFA referred to a score of 4, corresponding to an SpO2/FiO2 < 150. Elevated EDI referred to a baseline EDI > 45. An elevated CRP referred to a baseline CRP > 20 mg/dL.22
Variables reflecting access to healthcare included: THR EHR creation year (representing the first time patients accessed the THR health system), insurance payor type, and presence of a primary care provider (PCP). The federal government established the COVID-19 Claims Reimbursement to Health Care Providers and Facilities for Testing, Treatment, and Vaccine Administration for the Uninsured program. The insurance payor for patients covered by this program is designated as COVID-19 HRSA. Presence of a PCP reflects any documented PCP, regardless of affiliation with THR. We selected these access metrics opportunistically, as they were consistently documented in the EHR and readily available for analysis.
We used 12 variables to describe comorbidities or underlying conditions that, according to the CDC, increased patients’ risk of severe illness from COVID-1923: diagnoses of diabetes, hypertension, obesity, chronic obstructive pulmonary disease (COPD), asthma, smoking, other lung disease, heart failure, kidney disease without end-stage renal disease (ESRD), ESRD, liver disease, and cancer. We identified comorbidities by mining the structured diagnosis codes documented in the EHR prior to and during the COVID-19 admission. Sources for diagnoses included final billed diagnosis codes, working diagnosis codes, problem list, and reason for visit. The definition of diabetes included previously recorded diabetes or baseline hemoglobin A1c > 9%. We also recorded the presence of four major COVID-19 treatments: steroids, remdesivir, tocilizumab, and fresh frozen plasma (FFP) from convalescent patients.24-26 Each treatment variable was defined by receipt of one or more doses.
Statistical Analysis
To analyze patient outcomes based on ethnicity, we divided the study cohort into a Hispanic group and a non-Hispanic group based on self-reported ethnicity in the EHR. To study the potential impact of primary language among Hispanic patients, we divided them into English-speaking and non-English-speaking patients based on their self-reported primary language. As a result, we analyzed three groups of patients: (1) non-Hispanic, (2) Hispanic and English speaking, and (3) Hispanic and non-English speaking. We tested differences of a given categorical variable across the three groups using the chi-square test for each age subgroup (18–49, 50–64, 65–79, ≥80 years). The Cochran-Mantel-Haenszel test was used for the overall difference adjusted for age. To assess whether an observed disparity in treatment existed across the three groups, we tested the difference in the administration of four major therapeutics for COVID-19, including steroids, remdesivir, tocilizumab, and convalescent plasma. To determine whether any groups had elevated disease severity at hospital admission (baseline), we tested the difference in four disease-severity metrics across the ethnic-language groups: (1) elevated respiratory MSOFA score, (2) elevated EDI, (3) elevated CRP level, and (4) any of the three conditions.
To study the associations with ICU utilization and death, respectively, we performed a multivariable analysis using a generalized linear mixed model with binomial distribution and a logit link function. In each analysis model, the hospital of admission was included as a random-effect variable to account for the potential treatment variations among different hospitals, while other variables were regarded as fixed effects. In the first multivariable analysis (Model 1), all demographic variables, including age, sex, and ethnicity, and different types of comorbidities and underlying conditions, were included as fixed-effect variables in the initial model, and then backward stepwise variable selection was performed to establish the final model (Model 1). We performed the backward stepwise variable selection separately for the outcome of ICU use or mortality. Based on Akaike information criterion (AIC), during each iteration the fixed-effect variable that led to the largest decrease in the AIC value was removed, and the variable selection process was completed when the AIC value stopped decreasing. In Model 2, we added the disease-severity variable at baseline to the selected variable set derived from Model 1 to explore its effect on the associations between ethnicity and clinical outcomes. In Model 3, we added healthcare access–related variables, including first-time healthsystem access, payor type, and PCP availability to Model 2. We performed all statistical analyses using R, version 4.0.2 (R Foundation for Statistical Computing) in RStudio (version 1.3.1093).
Results
Distinct Demographic and Comorbidity Patterns for Three Ethnic-Language Groups
We identified 6097 adult patients (age ≥18 years) who had confirmed COVID-19 disease and were hospitalized between March 3 and November 5, 2020. Demographic characteristics and comorbidity for these patients are summarized in Table 1. Among these patients, 4139 (67.9%) were non-Hispanic and 1958 (32.1%) were Hispanic. Among the Hispanic patients, 1203 (61.4%) identified English as their primary language and 755 (38.6%) identified a non-English primary language. Age distribution was vastly different among the three ethnic-language groups (Table 1). Unlike the relatively balanced distribution across different age groups in the non-Hispanic group, more than half (55.8%) of the English-speaking Hispanic patients were in the youngest age group (18-49 years). A much lower fraction of Hispanic patients was among the oldest (≥80 years) age group (P < .001). Because COVID-19 clinical outcome is strongly associated with age,27 we used age-stratified analysis when comparing group-level differences in patient outcomes.

Sex distribution also was different among the three groups, with the non-English-speaking Hispanic group having more male patients (53.0%). Diabetes and obesity, which are associated with clinical outcomes of COVID-19 patients, were more prevalent in Hispanic patients (Table 1). Non-English-speaking Hispanic patients had the highest diabetes rate (48.7% with documented diabetes; 15.8% with baseline HbA1c > 9%; P < .001). English-speaking Hispanic patients presented with the highest obesity rate (62.8%; P < .001). Appendix Table 1 provides detailed age-group-specific comorbidity distributions among ethnic-language groups.
Patients of Hispanic Ethnicity Experienced a Higher Rate of ICU Utilization and Mortality
Of the 6097 patients overall, 1365 (22.4%) were admitted to the ICU and 543 (8.9%) died in hospital. For non-Hispanic patients (n = 4139), 883 (21.3%) were admitted to the ICU and 373 (9.0%) died in hospital. For English-speaking Hispanic patients (n = 1203), 241 (20.0%) were admitted to the ICU and 91 (7.6%) died in hospital. For non-English-speaking Hispanic patients (n = 755), 241 (31.9%) were admitted to the ICU and 79 (10.5%) died in hospital. Figure 1 summarizes the age-stratified comparison of ICU utilization and mortality across the three ethnic-language patient groups. In all age groups, non-English-speaking Hispanic patients experienced a significantly higher ICU utilization rate compared to non-Hispanic patients (age-adjusted OR, 1.75; 95% CI, 1.47-2.08; P < .001). English-speaking and non-English-speaking Hispanic patients had a significantly higher mortality rate compared to non-Hispanic patients (age-adjusted OR, 1.53; 95% CI, 1.19-1.98; P = .001 for English-speaking Hispanic patients; age-adjusted OR, 1.43; 95% CI,: 1.10-1.86; P = .01 for non-English-speaking Hispanic patients).

To delineate the risk factors associated with ICU utilization and death, we performed multivariable logistic regression with stepwise variable selection. After adjusting for age, sex, and comorbidity (Model 1), the factors ethnicity and primary language were still strongly associated with ICU utilization and mortality (Appendix Table 2). Non-English-speaking Hispanic patients had an OR of 1.74 (95% CI, 1.41-2.15; P < .001) for ICU utilization and an OR of 1.54 (95% CI, 1.12-2.12; P = .008) for mortality compared to non-Hispanic patients. Similarly, English-speaking Hispanic patients had higher ICU utilization (OR, 1.28; 95% CI, 1.05-1.55; P = .01) and a higher mortality rate (OR, 1.60; 95% CI, 1.19-2.14; P = .002).
No Disparity in COVID-19 Therapeutics Observed Across Three Ethnic-Language Groups
Appendix Figure 1 summarizes the comparison of the administration of four major treatments across the three ethnic-language groups. We did not observe any underuse of COVID-19 therapeutics for Hispanic patients. Usage rates for these therapies were significantly higher, after adjusting for age, in Hispanic groups when compared to non-Hispanic patients (OR ranged from 1.21 to 1.96). Steroids were the most common treatment in all patient groups. Tocilizumab was used almost twice as frequently (OR, 1.96; 95% CI, 1.64-2.33; P < .001) in non-English-speaking Hispanic patients compared to non-Hispanic patients.
Patients of Hispanic Ethnicity Had More Severe Disease at Hospital Admission
Figure 2 shows that non-English-speaking Hispanic patients had a higher rate of severe illness at admission based on each of these metrics: high respiratory MSOFA score (OR, 2.43; 95% CI, 1.77-3.33; P < .001), high EDI (OR, 1.85; 95% CI, 1.41-2.41; P < .001), and high CRP level (OR, 2.06; 95% CI, 1.64-2.58; P < .001). English-speaking Hispanic patients also had a greater rate of high CRP level (OR, 1.48; 95% CI, 1.17-1.86; P = .001) compared to non-Hispanic patients. When considering the presentation of any one of these clinical indicators, the English-speaking and non-English-speaking Hispanic patients had a higher rate of severe baseline condition (OR, 1.33; 95% CI, 1.10-1.61; P = .004 for English-speaking patients; OR, 2.27; 95% CI, 1.89-2.72; P < .001 for non-English-speaking patients).

We then studied how the baseline disease condition affects the association between ethnicity and clinical outcomes. We performed a multivariable analysis including baseline disease severity as a covariable (Model 2, Table 2), which showed that baseline disease severity was strongly associated with ICU admission (OR, 4.52; 95% CI, 3.83-5.33; P < .001) and mortality (OR, 3.32; 95% CI, 2.67-4.13; P < .001). The associations between ethnicity and clinical outcomes were reduced after considering the baseline disease condition. The OR dropped to 1.47 (95% CI, 1.18-1.84; P < .001) and 1.34 (95% CI, 0.97-1.87; P = .08) for ICU utilization and mortality, respectively, when comparing non-English-speaking Hispanic patients to non-Hispanic patients. A similar reduction was observed for English-speaking Hispanic patients. Model comparison showed a significant improvement of Model 2 over Model 1 based on ANOVA test (P < .001) as well as AIC.
")
Hispanic Patients Had Worse Healthcare Access
To explore the etiology for the more severe disease conditions at hospital admission among Hispanic patients, we analyzed variables related to healthcare access. We found that Hispanic patients were likely to have reduced access to healthcare (Table 1; Appendix Figure 2). For a large proportion (16.9%) of the COVID-19 patients in this study, their medical records were first created at THR in 2020, corresponding to the initial time these patients accessed THR for their healthcare. This surge in 2020, compared to previous years with data (2005–2019), corresponds to the number of new patients seen because of COVID-19 (Appendix Figure 2A). Among this new patient population, the proportion of non-English-speaking Hispanic patients in 2020 was 28.3%, compared to 9.1% from 2005 to 2019 (P < .001). The proportion of new English-speaking Hispanic patients in 2020 was 22.1%, compared to an average of 19.2% from 2005 to 2019 (P < .001). In addition, a much smaller proportion of Hispanic patients had a PCP (P < .001) (Table 1; Appendix Figure 2B), with non-English-speaking Hispanic patients having the smallest proportion (58.5%).
Appendix Figure 2C illustrates the comparison of payor types across the three patient groups. A much higher proportion of Hispanic patients used COVID-19 HRSA (P < .001) compared to non-Hispanic patients. Breaking this down further by primary language, 29.1% of non-English-speaking Hispanic patients relied on COVID-19 HRSA due to otherwise uninsured status, compared to 12.7% of English-speaking Hispanic patients and only 5.1% of non-Hispanic patients. Similarly, non-English-speaking Hispanic patients have the highest self-pay rates (2.3%) compared to English-speaking Hispanic patients (1.4%) and non-Hispanic patients (0.7%). In summary, more Hispanic patients, and especially non-English-speaking Hispanic patients, lacked conventional health insurance and experienced limited access to healthcare.
Further evidence showed a trend of correlation between presentation of severe COVID-19 conditions when arriving at the hospital and each of the healthcare access factors analyzed (Appendix Figure 3).
Discussion
With a large sample size of hospitalized COVID-19 patients at an integrated health system in the DFW metropolitan area, we observed an increased rate of ICU utilization and mortality among Hispanic inpatients. After adjusting for age, we found that non-English-speaking Hispanic patients were 75% more likely to require critical care compared with non-Hispanic patients. English-speaking and non-English-speaking Hispanic patients had an increased mortality rate (age-adjusted) compared to non-Hispanic patients. The association between ethnicity and clinical outcomes remained significant after adjusting for age, sex, and comorbidities. We did not observe any underuse of major COVID-19 therapeutics in Hispanic patients, and excluded in-hospital treatments from the contributors to the outcome differences.
Hispanic patients, especially non-English-speaking Hispanic patients, had a higher rate of severe COVID-19 disease at the time of hospital admission (Figure 2). After including baseline disease severity into the multivariable analysis (Model 2), the overall model improved (P < .001) while the associations between ethnicity and outcomes decreased (Table 2). This suggests disease severity at admission was a main contributor to the observed associations between ethnicity and clinical outcomes. The higher rate of baseline COVID-19 severity in Hispanic patients might also explain their higher rate of receiving major COVID-19 therapeutics (Appendix Figure 1).
This study found that Hispanic patients were less likely to have a PCP and insurance coverage compared with non-Hispanic patients (P < .001). This disparity was more pronounced among non-English-speaking Hispanic patients (Appendix Figure 2). We also observed that a disproportionately larger proportion (50.4%) of patients who visited the healthcare system for the first time in 2020 (the year of the COVID-19 pandemic) was composed of Hispanic patients, compared to merely 28.4% prior to 2020. While there is a possibility that patients had primary care outside THR, the staggering number of Hispanic patients who were new to the health system in 2020, in conjunction with the fact that immigrants tend to be “healthier” compared to their native-born peers (the so-called immigrant paradox),28 led us to conclude that there were few other primary care options for these patients, making THR’s ED the primary care option of choice. The systemic, structural barriers to routine care might be a possible cause for delayed admission and, in turn, elevated baseline COVID-19 severity for Hispanic patients (Appendix Figure 3).
Recent studies have investigated the impact of socioeconomic factors on racial/ethnic disparities in the COVID-19 pandemic.7,16,17 To our knowledge, no study has directly analyzed the link between healthcare access metrics, COVID-19 severity at admission, and the Hispanic population stratified by primary language. Studies exist on this subject for other diseases, however. For example, healthcare access factors have been associated with sepsis-related mortality.29,30 In fact, a recent study that explored the potential effect of language barriers on healthcare access demonstrated an association between limited English proficiency and sepsis-related mortality.31 Our study found that Hispanic patients whose primary language is not English had the worst clinical outcomes, including more severe baseline COVID-19 conditions, and the least access to healthcare, highlighting the importance of addressing language barriers in COVID-19 care. Further research is needed to confirm the relationship between limited English proficiency and clinical outcomes, as well as potential factors that contribute to such a relationship in different types of diseases.
Our study has a number of limitations. First, it was limited to only one large healthcare system, which means the results may not be generalizable. Because THR is an open system, comorbidity data may be incomplete, and we cannot exclude the possibility that patients accessed care outside THR prior to or during the pandemic. We may overcome this limitation in the future with cross-system health information exchange data. Second, we did not have data for the time of symptom onset, so we were unable to analyze the direct evidence of the possible delayed care. As a result, we were unable to analyze whether treatments were administered in a timely manner or appropriately. Third, our analysis was not adjusted for other socioeconomic factors (eg, income, education) due to lack of data. We used self-identification for ethnicity, but unlike new approaches by the U.S. Census Bureau,32 our survey allowed only one choice to be selected.
Conclusion
Sociodemographic factors among Hispanic inpatients hospitalized for COVID-19 at a large integrated health system—including a primary non-English language, lack of a PCP, and insurance status—were associated with measures of reduced access to care and more severe illness at admission. Structural barriers to care, which may be associated with reduced health literacy and less access to health insurance, can result in delayed treatment and more severe illness at admission and underdiagnosis of medical conditions, contributing to worse outcomes in this population. Our findings suggest that interventions to promote early recognition of signs and symptoms of COVID-19 and to encourage prompt clinical care at the community level may reduce the burden of COVID-19 deaths in racial or ethnic minority communities with language and socioeconomic barriers.
1. Lopez L III, Hart LH III, Katz MH. Racial and ethnic health disparities related to COVID-19. JAMA. 2021;325(8):719-720. https://doi.org/10.1001/jama.2020.26443
2. Cooper LA, Williams DR. Excess deaths from COVID-19, community bereavement, and restorative justice for communities of color. JAMA. 2020;324(15):1491-1492. https://doi.org/10.1001/jama.2020.19567
3. Clay LA, Rogus S. Primary and secondary health impacts of COVID-19 among minority individuals in New York State. Int J Environ Res Public Health. 2021;18(2):683. https://doi.org/10.3390/ijerph18020683
4. Rodriguez F, Solomon N, de Lemos JA, et al. Racial and ethnic differences in presentation and outcomes for patients hospitalized with COVID-19: findings from the American Heart Association’s COVID-19 Cardiovascular Disease Registry. Circulation. 2021;143(24):2332-2342. https://doi.org/10.1161/CIRCULATIONAHA.120.052278
5. Moreira A, Chorath K, Rajasekaran K, Burmeister F, Ahmed M, Moreira A. Demographic predictors of hospitalization and mortality in US children with COVID-19. Eur J Pediatr. 2021;180(5):1659-1663. https://doi.org/10.1007/s00431-021-03955-x
6. Kolata G. Social inequities explain racial gaps in pandemic, studies find. The New York Times. December 9, 2020. https://www.nytimes.com/2020/12/09/health/coronavirus-black-hispanic.html
7. Liao TF, De Maio F. Association of social and economic inequality with coronavirus disease 2019 incidence and mortality across US counties. JAMA Netw Open. 2021;4(1):e2034578. https://doi.org/10.1001/jamanetworkopen.2020.34578
8. Centers for Disease Control and Prevention. A Weekly Surveillance Summary of U.S. COVID-19 Activity: Key Updates for Week 2. January 21, 2021. https://www.cdc.gov/coronavirus/2019-ncov/covid-data/pdf/covidview-01-22-2021.pdf
9. Centers for Disease Control and Prevention. Risk for COVID-19 infection, hospitalization, and death by race/ethnicity. Updated September 9, 2021. https://www.cdc.gov/coronavirus/2019-ncov/covid-data/investigations-discovery/hospitalization-death-by-race-ethnicity.html
10. Gold JAW, Rossen LM, Ahmad FB, et al. Race, ethnicity, and age trends in persons who died from COVID-19 – United States, May-August 2020. MMWR Morb Mortal Wkly Rep. 2020;69(42):1517-1521. https://doi.org/10.15585/mmwr.mm6942e1
11. Pennington AF, Kompaniyets L, Summers AD, et al. Risk of clinical severity by age and race/ethnicity among adults hospitalized for COVID-19 – United States, March-September 2020. Open Forum Infect Dis. 2021;8(2):ofaa638. https://doi.org/10.1093/ofid/ofaa638.
12. Renelus BD, Khoury NC, Chandrasekaran K, et al. Racial disparities in COVID-19 hospitalization and in-hospital mortality at the height of the New York City pandemic. J Racial Ethn Health Disparities. 2021;8(5):1161-1167. https://doi.org/10.1007/s40615-020-00872-x
13. Wiley Z, Ross-Driscoll K, Wang Z, Smothers L, Mehta AK, Patzer RE. Racial and ethnic differences and clinical outcomes of COVID-19 patients presenting to the emergency department. Clin Infect Dis. 2021 Apr 2. [Epub ahead of print] https://doi.org/10.1093/cid/ciab290
14. Dai CL, Kornilov SA, Roper RT, et al. Characteristics and factors associated with COVID-19 infection, hospitalization, and mortality across race and ethnicity. Clin Infect Dis. 2021 Feb 20. [Epub ahead of print] https://doi.org/10.1093/cid/ciab154
15. Pan AP, Khan O, Meeks JR, et al. Disparities in COVID-19 hospitalizations and mortality among black and Hispanic patients: cross-sectional analysis from the greater Houston metropolitan area. BMC Public Health. 2021;21(1):1330. https://doi.org/10.1186/s12889-021-11431-2
16. Ogedegbe G, Ravenell J, Adhikari S, et al. Assessment of racial/ethnic disparities in hospitalization and mortality in patients with COVID-19 in New York City. JAMA Netw Open. 2020;3(12):e2026881. https://doi.org/10.1001/jamanetworkopen.2020.26881
17. Gershengorn HB, Patel S, Shukla B, et al. Association of race and ethnicity with COVID-19 test positivity and hospitalization is mediated by socioeconomic factors. Ann Am Thorac Soc. 2021;18(8):1326-1334. https://doi.org/10.1513/AnnalsATS.202011-1448OC
18. Sze S, Pan D, Nevill CR, et al. Ethnicity and clinical outcomes in COVID-19: a systematic review and meta-analysis. EClinicalMedicine. 2020;29:100630. https://doi.org/10.1016/j.eclinm.2020.100630
19. U.S. Census Bureau. 2019 U.S Census Bureau American Community Survey. https://www.census.gov/programs-surveys/acs
20. North Texas Mass Critical Care Task Force. North Texas Mass Critical Care Guidelines Document. Hospital and ICU Triage Guidelines for ADULTS. January 2014. https://www.dallas-cms.org/tmaimis/dcms/assets/files/communityhealth/MCC/GuidelinesAdult_JAN2014.pdf
21. Singh K, Valley TS, Tang S, et al. Evaluating a widely implemented proprietary deterioration index model among hospitalized COVID-19 patients. Ann Am Thorac Soc. 2021;18(7):1129-1137. https://doi.org/10.1513/AnnalsATS.202006-698OC
22. Keller MJ, Kitsis EA, Arora S, et al. Effect of systemic glucocorticoids on mortality or mechanical ventilation in patients with COVID-19. J Hosp Med. 2020;15(8):489-493. https://doi.org/10.12788/jhm.3497
23. Centers for Disease Control and Prevention. Science Brief: Evidence used to update the list of underlying medical conditions that increase a person’s risk of severe illness from COVID-19. Updated May 12, 2021. https://www.cdc.gov/coronavirus/2019-ncov/science/science-briefs/underlying-evidence-table.html
24. Gupta S, Wang W, Hayek SS, et al. Association between early treatment with tocilizumab and mortality among critically ill patients with COVID-19. JAMA Intern Med. 2021;181(1):41-51. https://doi.org/10.1001/jamainternmed.2020.6252
25. Baroutjian A, Sanchez C, Boneva D, McKenney M, Elkbuli A. SARS-CoV-2 pharmacologic therapies and their safety/effectiveness according to level of evidence. Am J Emerg Med. 2020;38(11):2405-2415. https://doi.org/10.1016/j.ajem.2020.08.091
26. Janiaud P, Axfors C, Schmitt AM, et al. Association of convalescent plasma treatment with clinical outcomes in patients with COVID-19: a systematic review and meta-analysis. JAMA. 2021;325(12):1185-1195. https://doi.org/10.1001/jama.2021.2747
27. Panagiotou OA, Kosar CM, White EM, et al. Risk factors associated with all-cause 30-day mortality in nursing home residents with COVID-19. JAMA Intern Med. 2021;181(4):439-448. https://doi.org/10.1001/jamainternmed.2020.7968
28. Bacong AM, Menjívar C. Recasting the immigrant health paradox through intersections of legal status and race. J Immigr Minor Health. 2021;23(5):1092-1104. https://doi.org/10.1007/s10903-021-01162-2
29. Plopper GE, Sciarretta KL, Buchman TG. Disparities in sepsis outcomes may be attributable to access to care. Crit Care Med. 2021;49(8):1358-1360. https://doi.org/10.1097/CCM.0000000000005126
30. Jones JM, Fingar KR, Miller MA, et al. Racial disparities in sepsis-related in-hospital mortality: using a broad case capture method and multivariate controls for clinical and hospital variables, 2004-2013. Crit Care Med. 2017;45(12):e1209-e1217. https://doi.org/10.1097/CCM.0000000000002699
31. Jacobs ZG, Prasad PA, Fang MC, Abe-Jones Y, Kangelaris KN. The association between limited English proficiency and sepsis mortality. J Hosp Med. 2019;14:E1-E7. https://doi.org/10.12788/jhm.3334
32. Cohn D. Census considers new approach to asking about race – by not using the term at all. June 18, 2015. https://www.pewresearch.org/fact-tank/2015/06/18/census-considers-new-approach-to-asking-about-race-by-not-using-the-term-at-all/
In the United States, health disparities in COVID-19 outcomes (including morbidity and mortality) based on race and ethnicity have been described in the scientific literature and mainstream media.1-7 According to the US Centers for Disease Control and Prevention (CDC), Hispanic people are 3.2 times more likely to be hospitalized with COVID-19 than non-Hispanic White people.8 Further, Hispanic people diagnosed with COVID-19 are 2.3 times more likely to die, adjusted for age, than non-Hispanic White people.9 As the epicenter of the COVID-19 pandemic shifted from the Northeast to the South, the CDC reported that, among people who died from COVID-19 in the United States from May to August 2020, the percentage of Hispanic people increased from 16.3% to 26.4%.10
Published studies on the effect of ethnicity on critical illness or mortality for hospitalized COVID-19 patients are limited and inconsistent. While some studies reported a higher mortality rate for Hispanic patients,11-15 others showed no difference.4,16,17 A recent meta-analysis found that intensive care unit (ICU) utilization and mortality were slightly higher among Hispanic COVID-19 inpatients, but this finding did not reach statistical significance.18 Past studies from different healthcare systems were limited by the small sample size of hospitalized Hispanic patients and the heterogeneity of patients. A comprehensive analysis from a large healthcare system with sufficient sample size is needed to understand the impact of ethnicity on clinical outcomes of hospitalized COVID-19 patients.
Texas Health Resources (THR) is a large integrated healthcare system serving the Dallas-Fort Worth-Arlington (DFW) metropolitan area. According to the 2019 US Census Bureau American Community Survey, Hispanic people comprise 18.4% of the population of this geographic area.19 Congruent with the CDC’s findings, Hispanic patients account for a disproportionate share (32.2%) of hospitalized COVID-19 patients at THR relative to the area’s demographic composition. Aware of the increased risk, we undertook an analysis of the clinical outcomes and the clinical, social, and demographic characteristics of Hispanic patients hospitalized at THR with COVID-19. Our primary goal was to investigate whether clinical outcomes differ by ethnicity among patients hospitalized with COVID-19 and, if so, whether inpatient care or preadmission factors contribute to this difference.
Methods
Study Setting and Overview
We collected data from the single electronic health record (EHR) used by 20 THR hospitals located across the DFW metropolitan area. THR is the largest faith-based, nonprofit health system in North Texas, operating 20 acute care hospitals. Including all access points, such as outpatient facilities and physician group practices, THR serves 7 million residents in 16 counties in North Texas, of whom 16.8% are Hispanic, 73.3% are non-Hispanic, and 9.9% are unclassified, congruent with demographics in the DFW area.
The institutional review boards at THR and UT Southwestern Medical Center approved the study under a waiver of informed consent (as a minimal-risk medical record review). After collection, all data were de-identified prior to statistical analysis.
Cohort, Outcomes, and Covariables
The study cohort included 6097 adult patients with laboratory-confirmed COVID-19 (age ≥18 years) who were admitted as inpatients from March 3 to November 5, 2020. The primary outcomes included ICU utilization and death during hospitalization. We described demographic characteristics using the following variables: age (18–49, 50–64, 65–79, ≥80 years), sex, self-reported ethnicity, and primary spoken language.
We defined a severe baseline condition as an elevated respiratory subscore parsed from the overall MSOFA (Modified Sequential Organ Failure Assessment),20 an elevated Epic Deterioration Index (EDI),21 or an elevated C-reactive protein level (CRP) at baseline (any elevated CRP). Baseline referred to the variable mean during the first available 12-hour window of measurement during the COVID-19 hospital admission, including variables obtained in the emergency department (ED). An elevated MSOFA referred to a score of 4, corresponding to an SpO2/FiO2 < 150. Elevated EDI referred to a baseline EDI > 45. An elevated CRP referred to a baseline CRP > 20 mg/dL.22
Variables reflecting access to healthcare included: THR EHR creation year (representing the first time patients accessed the THR health system), insurance payor type, and presence of a primary care provider (PCP). The federal government established the COVID-19 Claims Reimbursement to Health Care Providers and Facilities for Testing, Treatment, and Vaccine Administration for the Uninsured program. The insurance payor for patients covered by this program is designated as COVID-19 HRSA. Presence of a PCP reflects any documented PCP, regardless of affiliation with THR. We selected these access metrics opportunistically, as they were consistently documented in the EHR and readily available for analysis.
We used 12 variables to describe comorbidities or underlying conditions that, according to the CDC, increased patients’ risk of severe illness from COVID-1923: diagnoses of diabetes, hypertension, obesity, chronic obstructive pulmonary disease (COPD), asthma, smoking, other lung disease, heart failure, kidney disease without end-stage renal disease (ESRD), ESRD, liver disease, and cancer. We identified comorbidities by mining the structured diagnosis codes documented in the EHR prior to and during the COVID-19 admission. Sources for diagnoses included final billed diagnosis codes, working diagnosis codes, problem list, and reason for visit. The definition of diabetes included previously recorded diabetes or baseline hemoglobin A1c > 9%. We also recorded the presence of four major COVID-19 treatments: steroids, remdesivir, tocilizumab, and fresh frozen plasma (FFP) from convalescent patients.24-26 Each treatment variable was defined by receipt of one or more doses.
Statistical Analysis
To analyze patient outcomes based on ethnicity, we divided the study cohort into a Hispanic group and a non-Hispanic group based on self-reported ethnicity in the EHR. To study the potential impact of primary language among Hispanic patients, we divided them into English-speaking and non-English-speaking patients based on their self-reported primary language. As a result, we analyzed three groups of patients: (1) non-Hispanic, (2) Hispanic and English speaking, and (3) Hispanic and non-English speaking. We tested differences of a given categorical variable across the three groups using the chi-square test for each age subgroup (18–49, 50–64, 65–79, ≥80 years). The Cochran-Mantel-Haenszel test was used for the overall difference adjusted for age. To assess whether an observed disparity in treatment existed across the three groups, we tested the difference in the administration of four major therapeutics for COVID-19, including steroids, remdesivir, tocilizumab, and convalescent plasma. To determine whether any groups had elevated disease severity at hospital admission (baseline), we tested the difference in four disease-severity metrics across the ethnic-language groups: (1) elevated respiratory MSOFA score, (2) elevated EDI, (3) elevated CRP level, and (4) any of the three conditions.
To study the associations with ICU utilization and death, respectively, we performed a multivariable analysis using a generalized linear mixed model with binomial distribution and a logit link function. In each analysis model, the hospital of admission was included as a random-effect variable to account for the potential treatment variations among different hospitals, while other variables were regarded as fixed effects. In the first multivariable analysis (Model 1), all demographic variables, including age, sex, and ethnicity, and different types of comorbidities and underlying conditions, were included as fixed-effect variables in the initial model, and then backward stepwise variable selection was performed to establish the final model (Model 1). We performed the backward stepwise variable selection separately for the outcome of ICU use or mortality. Based on Akaike information criterion (AIC), during each iteration the fixed-effect variable that led to the largest decrease in the AIC value was removed, and the variable selection process was completed when the AIC value stopped decreasing. In Model 2, we added the disease-severity variable at baseline to the selected variable set derived from Model 1 to explore its effect on the associations between ethnicity and clinical outcomes. In Model 3, we added healthcare access–related variables, including first-time healthsystem access, payor type, and PCP availability to Model 2. We performed all statistical analyses using R, version 4.0.2 (R Foundation for Statistical Computing) in RStudio (version 1.3.1093).
Results
Distinct Demographic and Comorbidity Patterns for Three Ethnic-Language Groups
We identified 6097 adult patients (age ≥18 years) who had confirmed COVID-19 disease and were hospitalized between March 3 and November 5, 2020. Demographic characteristics and comorbidity for these patients are summarized in Table 1. Among these patients, 4139 (67.9%) were non-Hispanic and 1958 (32.1%) were Hispanic. Among the Hispanic patients, 1203 (61.4%) identified English as their primary language and 755 (38.6%) identified a non-English primary language. Age distribution was vastly different among the three ethnic-language groups (Table 1). Unlike the relatively balanced distribution across different age groups in the non-Hispanic group, more than half (55.8%) of the English-speaking Hispanic patients were in the youngest age group (18-49 years). A much lower fraction of Hispanic patients was among the oldest (≥80 years) age group (P < .001). Because COVID-19 clinical outcome is strongly associated with age,27 we used age-stratified analysis when comparing group-level differences in patient outcomes.
Sex distribution also was different among the three groups, with the non-English-speaking Hispanic group having more male patients (53.0%). Diabetes and obesity, which are associated with clinical outcomes of COVID-19 patients, were more prevalent in Hispanic patients (Table 1). Non-English-speaking Hispanic patients had the highest diabetes rate (48.7% with documented diabetes; 15.8% with baseline HbA1c > 9%; P < .001). English-speaking Hispanic patients presented with the highest obesity rate (62.8%; P < .001). Appendix Table 1 provides detailed age-group-specific comorbidity distributions among ethnic-language groups.
Patients of Hispanic Ethnicity Experienced a Higher Rate of ICU Utilization and Mortality
Of the 6097 patients overall, 1365 (22.4%) were admitted to the ICU and 543 (8.9%) died in hospital. For non-Hispanic patients (n = 4139), 883 (21.3%) were admitted to the ICU and 373 (9.0%) died in hospital. For English-speaking Hispanic patients (n = 1203), 241 (20.0%) were admitted to the ICU and 91 (7.6%) died in hospital. For non-English-speaking Hispanic patients (n = 755), 241 (31.9%) were admitted to the ICU and 79 (10.5%) died in hospital. Figure 1 summarizes the age-stratified comparison of ICU utilization and mortality across the three ethnic-language patient groups. In all age groups, non-English-speaking Hispanic patients experienced a significantly higher ICU utilization rate compared to non-Hispanic patients (age-adjusted OR, 1.75; 95% CI, 1.47-2.08; P < .001). English-speaking and non-English-speaking Hispanic patients had a significantly higher mortality rate compared to non-Hispanic patients (age-adjusted OR, 1.53; 95% CI, 1.19-1.98; P = .001 for English-speaking Hispanic patients; age-adjusted OR, 1.43; 95% CI,: 1.10-1.86; P = .01 for non-English-speaking Hispanic patients).
To delineate the risk factors associated with ICU utilization and death, we performed multivariable logistic regression with stepwise variable selection. After adjusting for age, sex, and comorbidity (Model 1), the factors ethnicity and primary language were still strongly associated with ICU utilization and mortality (Appendix Table 2). Non-English-speaking Hispanic patients had an OR of 1.74 (95% CI, 1.41-2.15; P < .001) for ICU utilization and an OR of 1.54 (95% CI, 1.12-2.12; P = .008) for mortality compared to non-Hispanic patients. Similarly, English-speaking Hispanic patients had higher ICU utilization (OR, 1.28; 95% CI, 1.05-1.55; P = .01) and a higher mortality rate (OR, 1.60; 95% CI, 1.19-2.14; P = .002).
No Disparity in COVID-19 Therapeutics Observed Across Three Ethnic-Language Groups
Appendix Figure 1 summarizes the comparison of the administration of four major treatments across the three ethnic-language groups. We did not observe any underuse of COVID-19 therapeutics for Hispanic patients. Usage rates for these therapies were significantly higher, after adjusting for age, in Hispanic groups when compared to non-Hispanic patients (OR ranged from 1.21 to 1.96). Steroids were the most common treatment in all patient groups. Tocilizumab was used almost twice as frequently (OR, 1.96; 95% CI, 1.64-2.33; P < .001) in non-English-speaking Hispanic patients compared to non-Hispanic patients.
Patients of Hispanic Ethnicity Had More Severe Disease at Hospital Admission
Figure 2 shows that non-English-speaking Hispanic patients had a higher rate of severe illness at admission based on each of these metrics: high respiratory MSOFA score (OR, 2.43; 95% CI, 1.77-3.33; P < .001), high EDI (OR, 1.85; 95% CI, 1.41-2.41; P < .001), and high CRP level (OR, 2.06; 95% CI, 1.64-2.58; P < .001). English-speaking Hispanic patients also had a greater rate of high CRP level (OR, 1.48; 95% CI, 1.17-1.86; P = .001) compared to non-Hispanic patients. When considering the presentation of any one of these clinical indicators, the English-speaking and non-English-speaking Hispanic patients had a higher rate of severe baseline condition (OR, 1.33; 95% CI, 1.10-1.61; P = .004 for English-speaking patients; OR, 2.27; 95% CI, 1.89-2.72; P < .001 for non-English-speaking patients).
We then studied how the baseline disease condition affects the association between ethnicity and clinical outcomes. We performed a multivariable analysis including baseline disease severity as a covariable (Model 2, Table 2), which showed that baseline disease severity was strongly associated with ICU admission (OR, 4.52; 95% CI, 3.83-5.33; P < .001) and mortality (OR, 3.32; 95% CI, 2.67-4.13; P < .001). The associations between ethnicity and clinical outcomes were reduced after considering the baseline disease condition. The OR dropped to 1.47 (95% CI, 1.18-1.84; P < .001) and 1.34 (95% CI, 0.97-1.87; P = .08) for ICU utilization and mortality, respectively, when comparing non-English-speaking Hispanic patients to non-Hispanic patients. A similar reduction was observed for English-speaking Hispanic patients. Model comparison showed a significant improvement of Model 2 over Model 1 based on ANOVA test (P < .001) as well as AIC.
Hispanic Patients Had Worse Healthcare Access
To explore the etiology for the more severe disease conditions at hospital admission among Hispanic patients, we analyzed variables related to healthcare access. We found that Hispanic patients were likely to have reduced access to healthcare (Table 1; Appendix Figure 2). For a large proportion (16.9%) of the COVID-19 patients in this study, their medical records were first created at THR in 2020, corresponding to the initial time these patients accessed THR for their healthcare. This surge in 2020, compared to previous years with data (2005–2019), corresponds to the number of new patients seen because of COVID-19 (Appendix Figure 2A). Among this new patient population, the proportion of non-English-speaking Hispanic patients in 2020 was 28.3%, compared to 9.1% from 2005 to 2019 (P < .001). The proportion of new English-speaking Hispanic patients in 2020 was 22.1%, compared to an average of 19.2% from 2005 to 2019 (P < .001). In addition, a much smaller proportion of Hispanic patients had a PCP (P < .001) (Table 1; Appendix Figure 2B), with non-English-speaking Hispanic patients having the smallest proportion (58.5%).
Appendix Figure 2C illustrates the comparison of payor types across the three patient groups. A much higher proportion of Hispanic patients used COVID-19 HRSA (P < .001) compared to non-Hispanic patients. Breaking this down further by primary language, 29.1% of non-English-speaking Hispanic patients relied on COVID-19 HRSA due to otherwise uninsured status, compared to 12.7% of English-speaking Hispanic patients and only 5.1% of non-Hispanic patients. Similarly, non-English-speaking Hispanic patients have the highest self-pay rates (2.3%) compared to English-speaking Hispanic patients (1.4%) and non-Hispanic patients (0.7%). In summary, more Hispanic patients, and especially non-English-speaking Hispanic patients, lacked conventional health insurance and experienced limited access to healthcare.
Further evidence showed a trend of correlation between presentation of severe COVID-19 conditions when arriving at the hospital and each of the healthcare access factors analyzed (Appendix Figure 3).
Discussion
With a large sample size of hospitalized COVID-19 patients at an integrated health system in the DFW metropolitan area, we observed an increased rate of ICU utilization and mortality among Hispanic inpatients. After adjusting for age, we found that non-English-speaking Hispanic patients were 75% more likely to require critical care compared with non-Hispanic patients. English-speaking and non-English-speaking Hispanic patients had an increased mortality rate (age-adjusted) compared to non-Hispanic patients. The association between ethnicity and clinical outcomes remained significant after adjusting for age, sex, and comorbidities. We did not observe any underuse of major COVID-19 therapeutics in Hispanic patients, and excluded in-hospital treatments from the contributors to the outcome differences.
Hispanic patients, especially non-English-speaking Hispanic patients, had a higher rate of severe COVID-19 disease at the time of hospital admission (Figure 2). After including baseline disease severity into the multivariable analysis (Model 2), the overall model improved (P < .001) while the associations between ethnicity and outcomes decreased (Table 2). This suggests disease severity at admission was a main contributor to the observed associations between ethnicity and clinical outcomes. The higher rate of baseline COVID-19 severity in Hispanic patients might also explain their higher rate of receiving major COVID-19 therapeutics (Appendix Figure 1).
This study found that Hispanic patients were less likely to have a PCP and insurance coverage compared with non-Hispanic patients (P < .001). This disparity was more pronounced among non-English-speaking Hispanic patients (Appendix Figure 2). We also observed that a disproportionately larger proportion (50.4%) of patients who visited the healthcare system for the first time in 2020 (the year of the COVID-19 pandemic) was composed of Hispanic patients, compared to merely 28.4% prior to 2020. While there is a possibility that patients had primary care outside THR, the staggering number of Hispanic patients who were new to the health system in 2020, in conjunction with the fact that immigrants tend to be “healthier” compared to their native-born peers (the so-called immigrant paradox),28 led us to conclude that there were few other primary care options for these patients, making THR’s ED the primary care option of choice. The systemic, structural barriers to routine care might be a possible cause for delayed admission and, in turn, elevated baseline COVID-19 severity for Hispanic patients (Appendix Figure 3).
Recent studies have investigated the impact of socioeconomic factors on racial/ethnic disparities in the COVID-19 pandemic.7,16,17 To our knowledge, no study has directly analyzed the link between healthcare access metrics, COVID-19 severity at admission, and the Hispanic population stratified by primary language. Studies exist on this subject for other diseases, however. For example, healthcare access factors have been associated with sepsis-related mortality.29,30 In fact, a recent study that explored the potential effect of language barriers on healthcare access demonstrated an association between limited English proficiency and sepsis-related mortality.31 Our study found that Hispanic patients whose primary language is not English had the worst clinical outcomes, including more severe baseline COVID-19 conditions, and the least access to healthcare, highlighting the importance of addressing language barriers in COVID-19 care. Further research is needed to confirm the relationship between limited English proficiency and clinical outcomes, as well as potential factors that contribute to such a relationship in different types of diseases.
Our study has a number of limitations. First, it was limited to only one large healthcare system, which means the results may not be generalizable. Because THR is an open system, comorbidity data may be incomplete, and we cannot exclude the possibility that patients accessed care outside THR prior to or during the pandemic. We may overcome this limitation in the future with cross-system health information exchange data. Second, we did not have data for the time of symptom onset, so we were unable to analyze the direct evidence of the possible delayed care. As a result, we were unable to analyze whether treatments were administered in a timely manner or appropriately. Third, our analysis was not adjusted for other socioeconomic factors (eg, income, education) due to lack of data. We used self-identification for ethnicity, but unlike new approaches by the U.S. Census Bureau,32 our survey allowed only one choice to be selected.
Conclusion
Sociodemographic factors among Hispanic inpatients hospitalized for COVID-19 at a large integrated health system—including a primary non-English language, lack of a PCP, and insurance status—were associated with measures of reduced access to care and more severe illness at admission. Structural barriers to care, which may be associated with reduced health literacy and less access to health insurance, can result in delayed treatment and more severe illness at admission and underdiagnosis of medical conditions, contributing to worse outcomes in this population. Our findings suggest that interventions to promote early recognition of signs and symptoms of COVID-19 and to encourage prompt clinical care at the community level may reduce the burden of COVID-19 deaths in racial or ethnic minority communities with language and socioeconomic barriers.
1. Lopez L III, Hart LH III, Katz MH. Racial and ethnic health disparities related to COVID-19. JAMA. 2021;325(8):719-720. https://doi.org/10.1001/jama.2020.26443
2. Cooper LA, Williams DR. Excess deaths from COVID-19, community bereavement, and restorative justice for communities of color. JAMA. 2020;324(15):1491-1492. https://doi.org/10.1001/jama.2020.19567
3. Clay LA, Rogus S. Primary and secondary health impacts of COVID-19 among minority individuals in New York State. Int J Environ Res Public Health. 2021;18(2):683. https://doi.org/10.3390/ijerph18020683
4. Rodriguez F, Solomon N, de Lemos JA, et al. Racial and ethnic differences in presentation and outcomes for patients hospitalized with COVID-19: findings from the American Heart Association’s COVID-19 Cardiovascular Disease Registry. Circulation. 2021;143(24):2332-2342. https://doi.org/10.1161/CIRCULATIONAHA.120.052278
5. Moreira A, Chorath K, Rajasekaran K, Burmeister F, Ahmed M, Moreira A. Demographic predictors of hospitalization and mortality in US children with COVID-19. Eur J Pediatr. 2021;180(5):1659-1663. https://doi.org/10.1007/s00431-021-03955-x
6. Kolata G. Social inequities explain racial gaps in pandemic, studies find. The New York Times. December 9, 2020. https://www.nytimes.com/2020/12/09/health/coronavirus-black-hispanic.html
7. Liao TF, De Maio F. Association of social and economic inequality with coronavirus disease 2019 incidence and mortality across US counties. JAMA Netw Open. 2021;4(1):e2034578. https://doi.org/10.1001/jamanetworkopen.2020.34578
8. Centers for Disease Control and Prevention. A Weekly Surveillance Summary of U.S. COVID-19 Activity: Key Updates for Week 2. January 21, 2021. https://www.cdc.gov/coronavirus/2019-ncov/covid-data/pdf/covidview-01-22-2021.pdf
9. Centers for Disease Control and Prevention. Risk for COVID-19 infection, hospitalization, and death by race/ethnicity. Updated September 9, 2021. https://www.cdc.gov/coronavirus/2019-ncov/covid-data/investigations-discovery/hospitalization-death-by-race-ethnicity.html
10. Gold JAW, Rossen LM, Ahmad FB, et al. Race, ethnicity, and age trends in persons who died from COVID-19 – United States, May-August 2020. MMWR Morb Mortal Wkly Rep. 2020;69(42):1517-1521. https://doi.org/10.15585/mmwr.mm6942e1
11. Pennington AF, Kompaniyets L, Summers AD, et al. Risk of clinical severity by age and race/ethnicity among adults hospitalized for COVID-19 – United States, March-September 2020. Open Forum Infect Dis. 2021;8(2):ofaa638. https://doi.org/10.1093/ofid/ofaa638.
12. Renelus BD, Khoury NC, Chandrasekaran K, et al. Racial disparities in COVID-19 hospitalization and in-hospital mortality at the height of the New York City pandemic. J Racial Ethn Health Disparities. 2021;8(5):1161-1167. https://doi.org/10.1007/s40615-020-00872-x
13. Wiley Z, Ross-Driscoll K, Wang Z, Smothers L, Mehta AK, Patzer RE. Racial and ethnic differences and clinical outcomes of COVID-19 patients presenting to the emergency department. Clin Infect Dis. 2021 Apr 2. [Epub ahead of print] https://doi.org/10.1093/cid/ciab290
14. Dai CL, Kornilov SA, Roper RT, et al. Characteristics and factors associated with COVID-19 infection, hospitalization, and mortality across race and ethnicity. Clin Infect Dis. 2021 Feb 20. [Epub ahead of print] https://doi.org/10.1093/cid/ciab154
15. Pan AP, Khan O, Meeks JR, et al. Disparities in COVID-19 hospitalizations and mortality among black and Hispanic patients: cross-sectional analysis from the greater Houston metropolitan area. BMC Public Health. 2021;21(1):1330. https://doi.org/10.1186/s12889-021-11431-2
16. Ogedegbe G, Ravenell J, Adhikari S, et al. Assessment of racial/ethnic disparities in hospitalization and mortality in patients with COVID-19 in New York City. JAMA Netw Open. 2020;3(12):e2026881. https://doi.org/10.1001/jamanetworkopen.2020.26881
17. Gershengorn HB, Patel S, Shukla B, et al. Association of race and ethnicity with COVID-19 test positivity and hospitalization is mediated by socioeconomic factors. Ann Am Thorac Soc. 2021;18(8):1326-1334. https://doi.org/10.1513/AnnalsATS.202011-1448OC
18. Sze S, Pan D, Nevill CR, et al. Ethnicity and clinical outcomes in COVID-19: a systematic review and meta-analysis. EClinicalMedicine. 2020;29:100630. https://doi.org/10.1016/j.eclinm.2020.100630
19. U.S. Census Bureau. 2019 U.S Census Bureau American Community Survey. https://www.census.gov/programs-surveys/acs
20. North Texas Mass Critical Care Task Force. North Texas Mass Critical Care Guidelines Document. Hospital and ICU Triage Guidelines for ADULTS. January 2014. https://www.dallas-cms.org/tmaimis/dcms/assets/files/communityhealth/MCC/GuidelinesAdult_JAN2014.pdf
21. Singh K, Valley TS, Tang S, et al. Evaluating a widely implemented proprietary deterioration index model among hospitalized COVID-19 patients. Ann Am Thorac Soc. 2021;18(7):1129-1137. https://doi.org/10.1513/AnnalsATS.202006-698OC
22. Keller MJ, Kitsis EA, Arora S, et al. Effect of systemic glucocorticoids on mortality or mechanical ventilation in patients with COVID-19. J Hosp Med. 2020;15(8):489-493. https://doi.org/10.12788/jhm.3497
23. Centers for Disease Control and Prevention. Science Brief: Evidence used to update the list of underlying medical conditions that increase a person’s risk of severe illness from COVID-19. Updated May 12, 2021. https://www.cdc.gov/coronavirus/2019-ncov/science/science-briefs/underlying-evidence-table.html
24. Gupta S, Wang W, Hayek SS, et al. Association between early treatment with tocilizumab and mortality among critically ill patients with COVID-19. JAMA Intern Med. 2021;181(1):41-51. https://doi.org/10.1001/jamainternmed.2020.6252
25. Baroutjian A, Sanchez C, Boneva D, McKenney M, Elkbuli A. SARS-CoV-2 pharmacologic therapies and their safety/effectiveness according to level of evidence. Am J Emerg Med. 2020;38(11):2405-2415. https://doi.org/10.1016/j.ajem.2020.08.091
26. Janiaud P, Axfors C, Schmitt AM, et al. Association of convalescent plasma treatment with clinical outcomes in patients with COVID-19: a systematic review and meta-analysis. JAMA. 2021;325(12):1185-1195. https://doi.org/10.1001/jama.2021.2747
27. Panagiotou OA, Kosar CM, White EM, et al. Risk factors associated with all-cause 30-day mortality in nursing home residents with COVID-19. JAMA Intern Med. 2021;181(4):439-448. https://doi.org/10.1001/jamainternmed.2020.7968
28. Bacong AM, Menjívar C. Recasting the immigrant health paradox through intersections of legal status and race. J Immigr Minor Health. 2021;23(5):1092-1104. https://doi.org/10.1007/s10903-021-01162-2
29. Plopper GE, Sciarretta KL, Buchman TG. Disparities in sepsis outcomes may be attributable to access to care. Crit Care Med. 2021;49(8):1358-1360. https://doi.org/10.1097/CCM.0000000000005126
30. Jones JM, Fingar KR, Miller MA, et al. Racial disparities in sepsis-related in-hospital mortality: using a broad case capture method and multivariate controls for clinical and hospital variables, 2004-2013. Crit Care Med. 2017;45(12):e1209-e1217. https://doi.org/10.1097/CCM.0000000000002699
31. Jacobs ZG, Prasad PA, Fang MC, Abe-Jones Y, Kangelaris KN. The association between limited English proficiency and sepsis mortality. J Hosp Med. 2019;14:E1-E7. https://doi.org/10.12788/jhm.3334
32. Cohn D. Census considers new approach to asking about race – by not using the term at all. June 18, 2015. https://www.pewresearch.org/fact-tank/2015/06/18/census-considers-new-approach-to-asking-about-race-by-not-using-the-term-at-all/
© 2021 Society of Hospital Medicine