User login
Continue to opt for HDT/ASCT for multiple myeloma
High-dose therapy with melphalan followed by autologous stem cell transplant (HDT/ASCT) is still the best option for multiple myeloma even after almost 2 decades with newer and highly effective induction agents, according to a recent systematic review and two meta-analyses.
Given the “unprecedented efficacy” of “modern induction therapy with immunomodulatory drugs and proteasome inhibitors (also called ‘novel agents’),” investigators “have sought to reevaluate the role of HDT/ASCT,” wrote Binod Dhakal, MD, of the Medical College of Wisconsin, and his colleagues. The report is in JAMA Oncology.
To solve the issue, they analyzed five randomized controlled trials conducted since 2000 and concluded that HDT/ASCT is still the preferred treatment approach.
Despite a lack of demonstrable overall survival benefit, there is a significant progression-free survival (PFS) benefit, low treatment-related mortality, and potential high minimal residual disease-negative rates conferred by HDT/ASCT in newly-diagnosed multiple myeloma, the researchers noted.
The combined odds for complete response were 1.27 (95% confidence interval, 0.97-1.65, P = .07) with HDT/ASCT, compared with standard-dose therapy (SDT). The combined hazard ratio (HR) for PFS was 0.55 (95% CI, 0.41-0.7, P less than .001) and 0.76 for overall survival (95% CI, 0.42-1.36, P = .20) in favor of HDT.
PFS was best with tandem HDT/ASCT (HR, 0.49, 95% CI, 0.37-0.65) followed by single HDT/ASCT with bortezomib, lenalidomide, and dexamethasone consolidation (HR, 0.53, 95% CI, 0.37-0.76) and single HDT/ASCT alone (HR, 0.68, 95% CI, 0.53-0.87), compared with SDT. However, none of the HDT/ASCT approaches had a significant impact on overall survival.
Meanwhile, treatment-related mortality with HDT/ASCT was minimal, at less than 1%.
“The achievement of high [minimal residual disease] rates with HDT/ASCT may render this approach the ideal platform for testing novel approaches (e.g., immunotherapy) aiming at disease eradication and cures,” the researchers wrote.
The researchers reported relationships with a number of companies, including Takeda, Celgene, and Amgen, that make novel induction agents.
SOURCE: Dhakal B et al. JAMA Oncol. 2018 Jan 4. doi: 10.1001/jamaoncol.2017.4600.
High-dose therapy with melphalan followed by autologous stem cell transplant (HDT/ASCT) is still the best option for multiple myeloma even after almost 2 decades with newer and highly effective induction agents, according to a recent systematic review and two meta-analyses.
Given the “unprecedented efficacy” of “modern induction therapy with immunomodulatory drugs and proteasome inhibitors (also called ‘novel agents’),” investigators “have sought to reevaluate the role of HDT/ASCT,” wrote Binod Dhakal, MD, of the Medical College of Wisconsin, and his colleagues. The report is in JAMA Oncology.
To solve the issue, they analyzed five randomized controlled trials conducted since 2000 and concluded that HDT/ASCT is still the preferred treatment approach.
Despite a lack of demonstrable overall survival benefit, there is a significant progression-free survival (PFS) benefit, low treatment-related mortality, and potential high minimal residual disease-negative rates conferred by HDT/ASCT in newly-diagnosed multiple myeloma, the researchers noted.
The combined odds for complete response were 1.27 (95% confidence interval, 0.97-1.65, P = .07) with HDT/ASCT, compared with standard-dose therapy (SDT). The combined hazard ratio (HR) for PFS was 0.55 (95% CI, 0.41-0.7, P less than .001) and 0.76 for overall survival (95% CI, 0.42-1.36, P = .20) in favor of HDT.
PFS was best with tandem HDT/ASCT (HR, 0.49, 95% CI, 0.37-0.65) followed by single HDT/ASCT with bortezomib, lenalidomide, and dexamethasone consolidation (HR, 0.53, 95% CI, 0.37-0.76) and single HDT/ASCT alone (HR, 0.68, 95% CI, 0.53-0.87), compared with SDT. However, none of the HDT/ASCT approaches had a significant impact on overall survival.
Meanwhile, treatment-related mortality with HDT/ASCT was minimal, at less than 1%.
“The achievement of high [minimal residual disease] rates with HDT/ASCT may render this approach the ideal platform for testing novel approaches (e.g., immunotherapy) aiming at disease eradication and cures,” the researchers wrote.
The researchers reported relationships with a number of companies, including Takeda, Celgene, and Amgen, that make novel induction agents.
SOURCE: Dhakal B et al. JAMA Oncol. 2018 Jan 4. doi: 10.1001/jamaoncol.2017.4600.
High-dose therapy with melphalan followed by autologous stem cell transplant (HDT/ASCT) is still the best option for multiple myeloma even after almost 2 decades with newer and highly effective induction agents, according to a recent systematic review and two meta-analyses.
Given the “unprecedented efficacy” of “modern induction therapy with immunomodulatory drugs and proteasome inhibitors (also called ‘novel agents’),” investigators “have sought to reevaluate the role of HDT/ASCT,” wrote Binod Dhakal, MD, of the Medical College of Wisconsin, and his colleagues. The report is in JAMA Oncology.
To solve the issue, they analyzed five randomized controlled trials conducted since 2000 and concluded that HDT/ASCT is still the preferred treatment approach.
Despite a lack of demonstrable overall survival benefit, there is a significant progression-free survival (PFS) benefit, low treatment-related mortality, and potential high minimal residual disease-negative rates conferred by HDT/ASCT in newly-diagnosed multiple myeloma, the researchers noted.
The combined odds for complete response were 1.27 (95% confidence interval, 0.97-1.65, P = .07) with HDT/ASCT, compared with standard-dose therapy (SDT). The combined hazard ratio (HR) for PFS was 0.55 (95% CI, 0.41-0.7, P less than .001) and 0.76 for overall survival (95% CI, 0.42-1.36, P = .20) in favor of HDT.
PFS was best with tandem HDT/ASCT (HR, 0.49, 95% CI, 0.37-0.65) followed by single HDT/ASCT with bortezomib, lenalidomide, and dexamethasone consolidation (HR, 0.53, 95% CI, 0.37-0.76) and single HDT/ASCT alone (HR, 0.68, 95% CI, 0.53-0.87), compared with SDT. However, none of the HDT/ASCT approaches had a significant impact on overall survival.
Meanwhile, treatment-related mortality with HDT/ASCT was minimal, at less than 1%.
“The achievement of high [minimal residual disease] rates with HDT/ASCT may render this approach the ideal platform for testing novel approaches (e.g., immunotherapy) aiming at disease eradication and cures,” the researchers wrote.
The researchers reported relationships with a number of companies, including Takeda, Celgene, and Amgen, that make novel induction agents.
SOURCE: Dhakal B et al. JAMA Oncol. 2018 Jan 4. doi: 10.1001/jamaoncol.2017.4600.
FROM JAMA ONCOLOGY
Key clinical point:
Major finding: The combined odds for complete response were 1.27 (95% CI 0.97-1.65, P = .07) with HDT/ASCT, compared with standard-dose therapy (SDT).
Study details: A systematic review and two meta-analyses examining five phase 3 clinical trials reported since 2000.
Disclosures: The researchers reported relationships with a number of companies, including Takeda, Celgene, and Amgen, that make novel induction agents.
Source: Dhakal B et al. JAMA Oncol. 2018 Jan 4. doi: 10.1001/jamaoncol.2017.4600.
California tops state tobacco prevention spending
California will spend almost as much money on tobacco prevention and smoking cessation as the other states combined in 2018, putting it closest to the spending level recommended for each state by the Centers for Disease Control and Prevention, according to a report on the effects of the 1998 tobacco settlement.
The Golden State has budgeted almost $328 million for tobacco prevention and cessation this year, which amounts to just over 45% of all states’ total spending of $722 million and 94% of the CDC’s recommendation of $348 million. Alaska is the only state close to that in terms of the CDC-recommended level, reaching 93% of its spending target of $10.2 million. In third place for recommended spending is North Dakota, which has budgeted $5.3 million for 2018, or 54% of its CDC target, the report said. 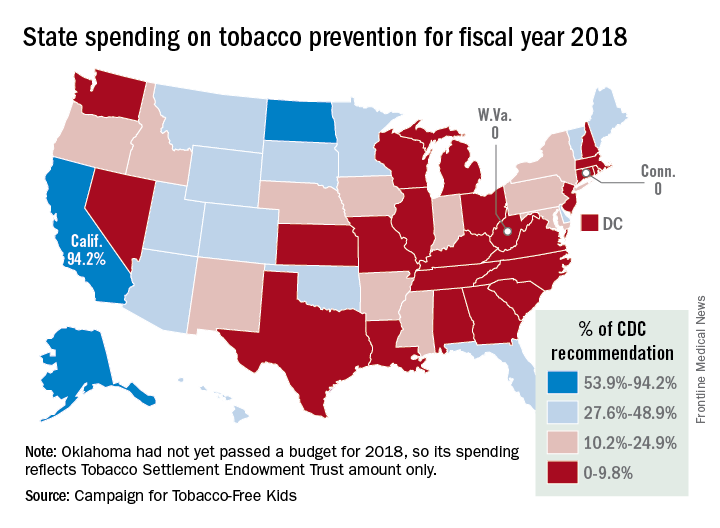
“Broken Promises to Our Children: A State-by-State Look at the 1998 Tobacco Settlement 19 Years Later” was released by the Campaign for Tobacco-Free Kids, American Cancer Society Cancer Action Network, American Heart Association, American Lung Association, Robert Wood Johnson Foundation, Americans for Nonsmokers’ Rights, and Truth Initiative.
As for actual spending, Florida is second behind California with almost $69 million – 35% of its CDC-recommended level – budgeted for tobacco prevention and smoking cessation in 2018, and New York is third at just over $39 million, which is 19.4% of the CDC recommendation. Two states – Connecticut and West Virginia – will spend no money on such programs this year, the report noted.
The CDC has said that all states combined should be spending $3.3 billion for the year on prevention and cessation efforts, which is about 4.5 times higher than actual budgeted spending. The report also pointed out that the $722 million the states will spend this year amounts to just 2.6% of the $27.5 billion they will collect from the 1998 tobacco settlement and tobacco taxes. By comparison, the report cited data from the Federal Trade Commission showing that the tobacco companies spent $8.9 billion on marketing in 2015.
California will spend almost as much money on tobacco prevention and smoking cessation as the other states combined in 2018, putting it closest to the spending level recommended for each state by the Centers for Disease Control and Prevention, according to a report on the effects of the 1998 tobacco settlement.
The Golden State has budgeted almost $328 million for tobacco prevention and cessation this year, which amounts to just over 45% of all states’ total spending of $722 million and 94% of the CDC’s recommendation of $348 million. Alaska is the only state close to that in terms of the CDC-recommended level, reaching 93% of its spending target of $10.2 million. In third place for recommended spending is North Dakota, which has budgeted $5.3 million for 2018, or 54% of its CDC target, the report said.
“Broken Promises to Our Children: A State-by-State Look at the 1998 Tobacco Settlement 19 Years Later” was released by the Campaign for Tobacco-Free Kids, American Cancer Society Cancer Action Network, American Heart Association, American Lung Association, Robert Wood Johnson Foundation, Americans for Nonsmokers’ Rights, and Truth Initiative.
As for actual spending, Florida is second behind California with almost $69 million – 35% of its CDC-recommended level – budgeted for tobacco prevention and smoking cessation in 2018, and New York is third at just over $39 million, which is 19.4% of the CDC recommendation. Two states – Connecticut and West Virginia – will spend no money on such programs this year, the report noted.
The CDC has said that all states combined should be spending $3.3 billion for the year on prevention and cessation efforts, which is about 4.5 times higher than actual budgeted spending. The report also pointed out that the $722 million the states will spend this year amounts to just 2.6% of the $27.5 billion they will collect from the 1998 tobacco settlement and tobacco taxes. By comparison, the report cited data from the Federal Trade Commission showing that the tobacco companies spent $8.9 billion on marketing in 2015.
California will spend almost as much money on tobacco prevention and smoking cessation as the other states combined in 2018, putting it closest to the spending level recommended for each state by the Centers for Disease Control and Prevention, according to a report on the effects of the 1998 tobacco settlement.
The Golden State has budgeted almost $328 million for tobacco prevention and cessation this year, which amounts to just over 45% of all states’ total spending of $722 million and 94% of the CDC’s recommendation of $348 million. Alaska is the only state close to that in terms of the CDC-recommended level, reaching 93% of its spending target of $10.2 million. In third place for recommended spending is North Dakota, which has budgeted $5.3 million for 2018, or 54% of its CDC target, the report said.
“Broken Promises to Our Children: A State-by-State Look at the 1998 Tobacco Settlement 19 Years Later” was released by the Campaign for Tobacco-Free Kids, American Cancer Society Cancer Action Network, American Heart Association, American Lung Association, Robert Wood Johnson Foundation, Americans for Nonsmokers’ Rights, and Truth Initiative.
As for actual spending, Florida is second behind California with almost $69 million – 35% of its CDC-recommended level – budgeted for tobacco prevention and smoking cessation in 2018, and New York is third at just over $39 million, which is 19.4% of the CDC recommendation. Two states – Connecticut and West Virginia – will spend no money on such programs this year, the report noted.
The CDC has said that all states combined should be spending $3.3 billion for the year on prevention and cessation efforts, which is about 4.5 times higher than actual budgeted spending. The report also pointed out that the $722 million the states will spend this year amounts to just 2.6% of the $27.5 billion they will collect from the 1998 tobacco settlement and tobacco taxes. By comparison, the report cited data from the Federal Trade Commission showing that the tobacco companies spent $8.9 billion on marketing in 2015.
Trying to Keep Pace With 3-D Technology
Three-dimensional printing has revolutionized the drug and device market and already has changed the lives of millions of patients. The FDA has reviewed more than 100 devices now on the market that were manufactured on 3-D printers, including knee replacements and implants “designed to fit like a missing puzzle piece into a patient’s skull for facial reconstruction,” says FDA Commissioner Scott Gottlieb, MD. The FDA also has approved the first drug produced on a 3-D printer. It has a more porous matrix than that of the drug manufactured in the traditional way, which allows it to dissolve more rapidly. But the technology advances have been moving so fast that they have threatened to outpace safeguards.
Now the FDA is preparing for a “significant wave” of new technologies, Gottlieb says, such as 3-D-printer skin cells for burn victims and is working to provide a regulatory pathway that keeps pace with those advances, helping to keep them safe and effective. To that end, the FDA has issued new guidance to help advise manufacturers on technical aspects of 3-D printing. And as more hospitals and academic centers use their 3-D printers for innovations to use in clinical studies, the FDA also is establishing a regulatory framework for applying existing laws to nontraditional manufacturers.
The Center for Drug Evaluation and Research state-of-the-art 3-D printing facility allows FDA scientists to conduct research to determine how 3-D printing of drugs, for instance, affects drug components. The Center for Devices and Radiological Health also has a 3-D printing facility to investigate the effect of design changes on safety and performance.
Gottlieb calls the technical guidance leapfrog guidance because it helps bridge current policy with innovation. It is only intended, he says, to provide “initial thoughts on an emerging technology with the understanding that our recommendations are likely to evolve as the technology develops in unexpected ways.”
Three-dimensional printing has revolutionized the drug and device market and already has changed the lives of millions of patients. The FDA has reviewed more than 100 devices now on the market that were manufactured on 3-D printers, including knee replacements and implants “designed to fit like a missing puzzle piece into a patient’s skull for facial reconstruction,” says FDA Commissioner Scott Gottlieb, MD. The FDA also has approved the first drug produced on a 3-D printer. It has a more porous matrix than that of the drug manufactured in the traditional way, which allows it to dissolve more rapidly. But the technology advances have been moving so fast that they have threatened to outpace safeguards.
Now the FDA is preparing for a “significant wave” of new technologies, Gottlieb says, such as 3-D-printer skin cells for burn victims and is working to provide a regulatory pathway that keeps pace with those advances, helping to keep them safe and effective. To that end, the FDA has issued new guidance to help advise manufacturers on technical aspects of 3-D printing. And as more hospitals and academic centers use their 3-D printers for innovations to use in clinical studies, the FDA also is establishing a regulatory framework for applying existing laws to nontraditional manufacturers.
The Center for Drug Evaluation and Research state-of-the-art 3-D printing facility allows FDA scientists to conduct research to determine how 3-D printing of drugs, for instance, affects drug components. The Center for Devices and Radiological Health also has a 3-D printing facility to investigate the effect of design changes on safety and performance.
Gottlieb calls the technical guidance leapfrog guidance because it helps bridge current policy with innovation. It is only intended, he says, to provide “initial thoughts on an emerging technology with the understanding that our recommendations are likely to evolve as the technology develops in unexpected ways.”
Three-dimensional printing has revolutionized the drug and device market and already has changed the lives of millions of patients. The FDA has reviewed more than 100 devices now on the market that were manufactured on 3-D printers, including knee replacements and implants “designed to fit like a missing puzzle piece into a patient’s skull for facial reconstruction,” says FDA Commissioner Scott Gottlieb, MD. The FDA also has approved the first drug produced on a 3-D printer. It has a more porous matrix than that of the drug manufactured in the traditional way, which allows it to dissolve more rapidly. But the technology advances have been moving so fast that they have threatened to outpace safeguards.
Now the FDA is preparing for a “significant wave” of new technologies, Gottlieb says, such as 3-D-printer skin cells for burn victims and is working to provide a regulatory pathway that keeps pace with those advances, helping to keep them safe and effective. To that end, the FDA has issued new guidance to help advise manufacturers on technical aspects of 3-D printing. And as more hospitals and academic centers use their 3-D printers for innovations to use in clinical studies, the FDA also is establishing a regulatory framework for applying existing laws to nontraditional manufacturers.
The Center for Drug Evaluation and Research state-of-the-art 3-D printing facility allows FDA scientists to conduct research to determine how 3-D printing of drugs, for instance, affects drug components. The Center for Devices and Radiological Health also has a 3-D printing facility to investigate the effect of design changes on safety and performance.
Gottlieb calls the technical guidance leapfrog guidance because it helps bridge current policy with innovation. It is only intended, he says, to provide “initial thoughts on an emerging technology with the understanding that our recommendations are likely to evolve as the technology develops in unexpected ways.”
Bedside Test Helps Protect Against Infant Deaths
According to researchers from William Paterson University, Emory University, and the CDC, screening for CCHD could save at least 120 babies a year.
Congenital heart disease accounted for 6% of U.S. infant deaths from 1999 to 2006. Almost 1 in every 4 babies born with a congenital heart defect has critical congenital heart disease (CCHD) and will need surgery or other procedures in the first year. About 7,200 babies born in the U.S .each year have 1 of 7 CCHDs. But some babies can seem healthy and be sent home before the heart defect is detected.
In 2011, CCHD was added to the U.S. Recommended Uniform Screening Panel for newborns. As of June 2013, 8 states had implemented mandatory screening policies, 5 had voluntary screening policies, and 9 had adopted but not yet implemented mandates.
The study was conducted in 2013 and involved data for nearly 27 million births. Between 2007 and 2013, 2,734 infants died due to CCHD; 3,967 died of other or unspecified causes.
The study, which is the first look at the impact of state policies to require or recommend screening for CCHD at birth, found that states with screening requirements saw the most significant drop in numbers of infant deaths. Voluntary policies or mandated policies not yet implemented were not associated with reductions. However, 47 states and DC now have mandatory screening policies in place.
According to researchers from William Paterson University, Emory University, and the CDC, screening for CCHD could save at least 120 babies a year.
Congenital heart disease accounted for 6% of U.S. infant deaths from 1999 to 2006. Almost 1 in every 4 babies born with a congenital heart defect has critical congenital heart disease (CCHD) and will need surgery or other procedures in the first year. About 7,200 babies born in the U.S .each year have 1 of 7 CCHDs. But some babies can seem healthy and be sent home before the heart defect is detected.
In 2011, CCHD was added to the U.S. Recommended Uniform Screening Panel for newborns. As of June 2013, 8 states had implemented mandatory screening policies, 5 had voluntary screening policies, and 9 had adopted but not yet implemented mandates.
The study was conducted in 2013 and involved data for nearly 27 million births. Between 2007 and 2013, 2,734 infants died due to CCHD; 3,967 died of other or unspecified causes.
The study, which is the first look at the impact of state policies to require or recommend screening for CCHD at birth, found that states with screening requirements saw the most significant drop in numbers of infant deaths. Voluntary policies or mandated policies not yet implemented were not associated with reductions. However, 47 states and DC now have mandatory screening policies in place.
According to researchers from William Paterson University, Emory University, and the CDC, screening for CCHD could save at least 120 babies a year.
Congenital heart disease accounted for 6% of U.S. infant deaths from 1999 to 2006. Almost 1 in every 4 babies born with a congenital heart defect has critical congenital heart disease (CCHD) and will need surgery or other procedures in the first year. About 7,200 babies born in the U.S .each year have 1 of 7 CCHDs. But some babies can seem healthy and be sent home before the heart defect is detected.
In 2011, CCHD was added to the U.S. Recommended Uniform Screening Panel for newborns. As of June 2013, 8 states had implemented mandatory screening policies, 5 had voluntary screening policies, and 9 had adopted but not yet implemented mandates.
The study was conducted in 2013 and involved data for nearly 27 million births. Between 2007 and 2013, 2,734 infants died due to CCHD; 3,967 died of other or unspecified causes.
The study, which is the first look at the impact of state policies to require or recommend screening for CCHD at birth, found that states with screening requirements saw the most significant drop in numbers of infant deaths. Voluntary policies or mandated policies not yet implemented were not associated with reductions. However, 47 states and DC now have mandatory screening policies in place.
Majority of influenza-related deaths among hospitalized patients occur after discharge
SAN DIEGO – Over half of hospitalized, influenza-related deaths occurred within 30 days of discharge, according to a study presented at an annual scientific meeting on infectious diseases.
As physicians and pharmaceutical companies attempt to measure the burden of seasonal influenza, discharged patients are currently not considered as much as they should be, according to investigators.
Among 968 deceased patients studied, 444 (46%) died in hospital, while 524 (54%) died within 30 days of discharge.
Investigators conducted a retrospective study of 15,562 patients hospitalized for influenza-related cases between 2014 and 2015, as recorded in Influenza-Associated Hospitalizations Surveillance (FluSurv-NET), a database of the Centers for Disease Control and Prevention.
The majority of the studied patients were women (55%) and the majority were white.
Those who died were more likely to have been admitted to the hospital immediately after influenza onset, with 26% of those who died after discharge and 22% of those who died in hospital having been admitted the same day. In contrast, 13% of those who lived past 30 days were admitted immediately after onset.
A total of 46% of those who died after hospitalization had a length of stay longer than 1 week, compared to 15% of those who lived.
Among patients who died after discharge, 356 (68%) died within 2 weeks of discharge, with the highest number of deaths occurring within the first few days, according to presenter Craig McGowan of the Influenza Division of the CDC in Atlanta.
Age also seemed to be a possible mortality predictor, according to Mr. McGowan and his fellow investigators. “Those who died were more likely to be elderly, and those who died after discharge were even more likely to be 85 [years or older] than those who died during their influenza-related hospitalizations,” said Mr. McGowan, who added that patients aged 85 years and older made up more than half of those who died after discharge.
Patients who died in hospital were significantly more likely to have influenza listed as a cause of death. Overall, influenza-related and non–influenza-related respiratory issues were the two most common causes of death listed on death certificates of patients who died during hospitalization or within 14 days of discharge, while cardiovascular or other symptoms were listed for those who died between 15 and 30 days after discharge.
Admission and discharge locations among patients who did not die were almost 80% from a private residence to a private residence, while observations of those who died revealed a different pattern. “Those individuals who died after discharge were almost evenly split between admission from a nursing home or a private residence,” Mr. McGowan said. “Those who were admitted from the nursing home were almost exclusively discharged to either hospice care or back to a nursing home.”
Mr. McGowan noted rehospitalization to be a significant factor among those who died, with 34% of deaths occurring back in the hospital after initial discharge.
Influenza testing of studied patients was given at clinicians’ discretion, which may make the sample not generalizable to the overall influenza population, and the investigators included only bivariate associations, which means there were likely confounding effects that could not be accounted for.
Mr. McGowan and his fellow investigators plan to expand their research by determining underlying causes of death in these patients, to create more accurate estimates of influenza-associated mortality.
Mr. McGowan reported no relevant financial disclosures.
ezimmerman@frontlinemedcom.com
SOURCE: McGowan, C., et al., ID Week 2017, Abstract 951.
SAN DIEGO – Over half of hospitalized, influenza-related deaths occurred within 30 days of discharge, according to a study presented at an annual scientific meeting on infectious diseases.
As physicians and pharmaceutical companies attempt to measure the burden of seasonal influenza, discharged patients are currently not considered as much as they should be, according to investigators.
Among 968 deceased patients studied, 444 (46%) died in hospital, while 524 (54%) died within 30 days of discharge.
Investigators conducted a retrospective study of 15,562 patients hospitalized for influenza-related cases between 2014 and 2015, as recorded in Influenza-Associated Hospitalizations Surveillance (FluSurv-NET), a database of the Centers for Disease Control and Prevention.
The majority of the studied patients were women (55%) and the majority were white.
Those who died were more likely to have been admitted to the hospital immediately after influenza onset, with 26% of those who died after discharge and 22% of those who died in hospital having been admitted the same day. In contrast, 13% of those who lived past 30 days were admitted immediately after onset.
A total of 46% of those who died after hospitalization had a length of stay longer than 1 week, compared to 15% of those who lived.
Among patients who died after discharge, 356 (68%) died within 2 weeks of discharge, with the highest number of deaths occurring within the first few days, according to presenter Craig McGowan of the Influenza Division of the CDC in Atlanta.
Age also seemed to be a possible mortality predictor, according to Mr. McGowan and his fellow investigators. “Those who died were more likely to be elderly, and those who died after discharge were even more likely to be 85 [years or older] than those who died during their influenza-related hospitalizations,” said Mr. McGowan, who added that patients aged 85 years and older made up more than half of those who died after discharge.
Patients who died in hospital were significantly more likely to have influenza listed as a cause of death. Overall, influenza-related and non–influenza-related respiratory issues were the two most common causes of death listed on death certificates of patients who died during hospitalization or within 14 days of discharge, while cardiovascular or other symptoms were listed for those who died between 15 and 30 days after discharge.
Admission and discharge locations among patients who did not die were almost 80% from a private residence to a private residence, while observations of those who died revealed a different pattern. “Those individuals who died after discharge were almost evenly split between admission from a nursing home or a private residence,” Mr. McGowan said. “Those who were admitted from the nursing home were almost exclusively discharged to either hospice care or back to a nursing home.”
Mr. McGowan noted rehospitalization to be a significant factor among those who died, with 34% of deaths occurring back in the hospital after initial discharge.
Influenza testing of studied patients was given at clinicians’ discretion, which may make the sample not generalizable to the overall influenza population, and the investigators included only bivariate associations, which means there were likely confounding effects that could not be accounted for.
Mr. McGowan and his fellow investigators plan to expand their research by determining underlying causes of death in these patients, to create more accurate estimates of influenza-associated mortality.
Mr. McGowan reported no relevant financial disclosures.
ezimmerman@frontlinemedcom.com
SOURCE: McGowan, C., et al., ID Week 2017, Abstract 951.
SAN DIEGO – Over half of hospitalized, influenza-related deaths occurred within 30 days of discharge, according to a study presented at an annual scientific meeting on infectious diseases.
As physicians and pharmaceutical companies attempt to measure the burden of seasonal influenza, discharged patients are currently not considered as much as they should be, according to investigators.
Among 968 deceased patients studied, 444 (46%) died in hospital, while 524 (54%) died within 30 days of discharge.
Investigators conducted a retrospective study of 15,562 patients hospitalized for influenza-related cases between 2014 and 2015, as recorded in Influenza-Associated Hospitalizations Surveillance (FluSurv-NET), a database of the Centers for Disease Control and Prevention.
The majority of the studied patients were women (55%) and the majority were white.
Those who died were more likely to have been admitted to the hospital immediately after influenza onset, with 26% of those who died after discharge and 22% of those who died in hospital having been admitted the same day. In contrast, 13% of those who lived past 30 days were admitted immediately after onset.
A total of 46% of those who died after hospitalization had a length of stay longer than 1 week, compared to 15% of those who lived.
Among patients who died after discharge, 356 (68%) died within 2 weeks of discharge, with the highest number of deaths occurring within the first few days, according to presenter Craig McGowan of the Influenza Division of the CDC in Atlanta.
Age also seemed to be a possible mortality predictor, according to Mr. McGowan and his fellow investigators. “Those who died were more likely to be elderly, and those who died after discharge were even more likely to be 85 [years or older] than those who died during their influenza-related hospitalizations,” said Mr. McGowan, who added that patients aged 85 years and older made up more than half of those who died after discharge.
Patients who died in hospital were significantly more likely to have influenza listed as a cause of death. Overall, influenza-related and non–influenza-related respiratory issues were the two most common causes of death listed on death certificates of patients who died during hospitalization or within 14 days of discharge, while cardiovascular or other symptoms were listed for those who died between 15 and 30 days after discharge.
Admission and discharge locations among patients who did not die were almost 80% from a private residence to a private residence, while observations of those who died revealed a different pattern. “Those individuals who died after discharge were almost evenly split between admission from a nursing home or a private residence,” Mr. McGowan said. “Those who were admitted from the nursing home were almost exclusively discharged to either hospice care or back to a nursing home.”
Mr. McGowan noted rehospitalization to be a significant factor among those who died, with 34% of deaths occurring back in the hospital after initial discharge.
Influenza testing of studied patients was given at clinicians’ discretion, which may make the sample not generalizable to the overall influenza population, and the investigators included only bivariate associations, which means there were likely confounding effects that could not be accounted for.
Mr. McGowan and his fellow investigators plan to expand their research by determining underlying causes of death in these patients, to create more accurate estimates of influenza-associated mortality.
Mr. McGowan reported no relevant financial disclosures.
ezimmerman@frontlinemedcom.com
SOURCE: McGowan, C., et al., ID Week 2017, Abstract 951.
AT IDWEEK 2017
Key clinical point:
Major finding: Among patients who died with confirmed influenza, 46% died in hospital, while 54% died within 30 days of discharge.
Data source: Retrospective study of 15,562 influenza patients hospitalized or within 30 days of discharge between 2014 and 2015, recorded in Influenza-Associated Hospitalizations Surveillance (FluSurv-NET).
Disclosures: Mr. McGowen reported no relevant financial disclosures.
How Long Can Corneas Be Saved Before Transplantation?
The belief that corneas that have been preserved for > 7 days are not viable for transplantation is not based on evidence, says Jonathan Lass, MD. In fact, he led a study that found corneas can be preserved safely for 11 days without negative impact on the success of transplantation. In the Cornea Preservation Time Study, funded by the National Eye Institute, Lass and other researchers looked at 3-year graft success rates among 1,090 participants (1,330 eyes) who underwent transplantation via Descemet’s stripping automated endothelial keratoplasty by 70 surgeons at 40 surgical sites. Most of the patients had Fuchs’ endothelial corneal dystrophy, a progressive disease.
The researchers were “unable to conclude” that the success rates were the same for corneas preserved for 8 to 14 days, versus up to 7 days (92% vs 95%). However, they found that much of the difference between the groups was accounted for by patients receiving corneas preserved for 12 to 14 days.
In a separate analysis, the researchers looked to see if differences in corneal preservation time affected endothelial cell loss after 3 years. They found that corneas preserved for up to 7 days had a 37% loss of cells versus 40% in those preserved for 8 to 14 days. A closer look at the data showed that the effect of corneal preservation time on the loss of endothelial cells was comparable from 4 to 13 days.
Dr. Lass emphasizes that while patients who received the older corneas had lower success rates, even those success rates were “impressively high” at 89%.
Donor corneas are not in short supply in the U.S. Outside the U.S., however, corneal disease is the third leading cause of blindness and corneal donor tissue is scarce.
The belief that corneas that have been preserved for > 7 days are not viable for transplantation is not based on evidence, says Jonathan Lass, MD. In fact, he led a study that found corneas can be preserved safely for 11 days without negative impact on the success of transplantation. In the Cornea Preservation Time Study, funded by the National Eye Institute, Lass and other researchers looked at 3-year graft success rates among 1,090 participants (1,330 eyes) who underwent transplantation via Descemet’s stripping automated endothelial keratoplasty by 70 surgeons at 40 surgical sites. Most of the patients had Fuchs’ endothelial corneal dystrophy, a progressive disease.
The researchers were “unable to conclude” that the success rates were the same for corneas preserved for 8 to 14 days, versus up to 7 days (92% vs 95%). However, they found that much of the difference between the groups was accounted for by patients receiving corneas preserved for 12 to 14 days.
In a separate analysis, the researchers looked to see if differences in corneal preservation time affected endothelial cell loss after 3 years. They found that corneas preserved for up to 7 days had a 37% loss of cells versus 40% in those preserved for 8 to 14 days. A closer look at the data showed that the effect of corneal preservation time on the loss of endothelial cells was comparable from 4 to 13 days.
Dr. Lass emphasizes that while patients who received the older corneas had lower success rates, even those success rates were “impressively high” at 89%.
Donor corneas are not in short supply in the U.S. Outside the U.S., however, corneal disease is the third leading cause of blindness and corneal donor tissue is scarce.
The belief that corneas that have been preserved for > 7 days are not viable for transplantation is not based on evidence, says Jonathan Lass, MD. In fact, he led a study that found corneas can be preserved safely for 11 days without negative impact on the success of transplantation. In the Cornea Preservation Time Study, funded by the National Eye Institute, Lass and other researchers looked at 3-year graft success rates among 1,090 participants (1,330 eyes) who underwent transplantation via Descemet’s stripping automated endothelial keratoplasty by 70 surgeons at 40 surgical sites. Most of the patients had Fuchs’ endothelial corneal dystrophy, a progressive disease.
The researchers were “unable to conclude” that the success rates were the same for corneas preserved for 8 to 14 days, versus up to 7 days (92% vs 95%). However, they found that much of the difference between the groups was accounted for by patients receiving corneas preserved for 12 to 14 days.
In a separate analysis, the researchers looked to see if differences in corneal preservation time affected endothelial cell loss after 3 years. They found that corneas preserved for up to 7 days had a 37% loss of cells versus 40% in those preserved for 8 to 14 days. A closer look at the data showed that the effect of corneal preservation time on the loss of endothelial cells was comparable from 4 to 13 days.
Dr. Lass emphasizes that while patients who received the older corneas had lower success rates, even those success rates were “impressively high” at 89%.
Donor corneas are not in short supply in the U.S. Outside the U.S., however, corneal disease is the third leading cause of blindness and corneal donor tissue is scarce.
Study identifies predictors of acquired von Willebrand disease
ATLANTA – Waldenström macroglobulinemia can present as acquired von Willebrand disease (VWD), and when it does, the finding strongly correlates with high serum IgM levels and the presence of CXCR4 mutations, according to the results of a large, single-center retrospective study.
Further, successfully treating Waldenström macroglobulinemia often resolves acquired VWD, and the depth of treatment response predicts the degree of improvement, Jorge J. Castillo, MD, and his associates wrote in a poster presented at the annual meeting of the American Society of Hematology.
Acquired VWD is an uncommon, poorly understood presentation of Waldenström macroglobulinemia. Because affected patients require treatment, better characterizing this subgroup is important, the investigators noted.
At the Bing Center for Waldenström Macroglobulinemia at Dana-Farber Cancer Institute in Boston, the researchers retrospectively studied 320 individuals with newly diagnosed Waldenström macroglobulinemia and used logistic regression analysis to seek predictors of acquired VWD, which they evaluated by measuring levels of VW factor antigen, VW factor activity, and factor VIII. Levels under 30% were considered VWD and levels between 30% and 50% were considered low-level VWD.
In all, 49 individuals had acquired VWD while 271 patients did not. These two groups were similar in terms of age, sex, hemoglobin level, platelet count, and bone marrow involvement. However, 45% of patients with acquired VWD had serum IgM levels above 6,000 mg/dL versus 6% of patients without acquired VWD (P less than .001), and 47% of patients with acquired VWD had serum IgM levels between 3,000 and 5,999 versus 31% of patients without acquired VWD (P less than .001). Also, 77% of patients with acquired VWD tested positive for CXCR4 mutation versus 37% of patients without acquired VWD (P less than .001).
A significantly higher proportion of patients without acquired VWD had white blood cell concentrations above 6,000/mcL (29% vs. 50%; P = .006). This finding lost statistical significance in the logistic regression model, but all the other variables remained significantly associated. Serum IgM levels above 6,000 mg/dL conferred a 55-fold increase in the odds of having acquired VWD (95% confidence interval, 17-177; P less than .001), and serum IgM levels between 3,000 and 5,999 mg/dL led to an 11-fold increase in these odds (95% CI, 4-34). The presence of CXCR4 mutations was associated with a sixfold increased odds of acquired VWD (95% CI, 2-15). The P value for each of these three associations was at or below .001.
Therapy for Waldenström macroglobulinemia led to statistically significant increases in levels of factor VIII, VW factor antigen, and VW factor activity (P less than .001) and the median of each level improved by at least 35% after treatment. After treatment, 78% of patients with acquired VWD had levels of all three measures above 50% (versus 0% before treatment; P less than .001). Patients with acquired VWD with the best responses to treatment had about a 90% decrease in IgM levels, while those with a partial response had about a two-thirds decrease and patients with stable disease had about a 20% decrease. A linear regression model confirmed that depth of treatment response, based on change in IgM level, correlated with degree of improvement in VWD – that is, the extent of improvement in levels of VW factor antigen, VW factor activity, and factor VIII.
No external funding sources were reported. Dr. Castillo disclosed consulting ties and research funding from Pharmacyclics and Janssen, and research funding from Millenium and Abbvie.
SOURCE: Castillo J, et al. ASH 2017 Abstract 1088.
ATLANTA – Waldenström macroglobulinemia can present as acquired von Willebrand disease (VWD), and when it does, the finding strongly correlates with high serum IgM levels and the presence of CXCR4 mutations, according to the results of a large, single-center retrospective study.
Further, successfully treating Waldenström macroglobulinemia often resolves acquired VWD, and the depth of treatment response predicts the degree of improvement, Jorge J. Castillo, MD, and his associates wrote in a poster presented at the annual meeting of the American Society of Hematology.
Acquired VWD is an uncommon, poorly understood presentation of Waldenström macroglobulinemia. Because affected patients require treatment, better characterizing this subgroup is important, the investigators noted.
At the Bing Center for Waldenström Macroglobulinemia at Dana-Farber Cancer Institute in Boston, the researchers retrospectively studied 320 individuals with newly diagnosed Waldenström macroglobulinemia and used logistic regression analysis to seek predictors of acquired VWD, which they evaluated by measuring levels of VW factor antigen, VW factor activity, and factor VIII. Levels under 30% were considered VWD and levels between 30% and 50% were considered low-level VWD.
In all, 49 individuals had acquired VWD while 271 patients did not. These two groups were similar in terms of age, sex, hemoglobin level, platelet count, and bone marrow involvement. However, 45% of patients with acquired VWD had serum IgM levels above 6,000 mg/dL versus 6% of patients without acquired VWD (P less than .001), and 47% of patients with acquired VWD had serum IgM levels between 3,000 and 5,999 versus 31% of patients without acquired VWD (P less than .001). Also, 77% of patients with acquired VWD tested positive for CXCR4 mutation versus 37% of patients without acquired VWD (P less than .001).
A significantly higher proportion of patients without acquired VWD had white blood cell concentrations above 6,000/mcL (29% vs. 50%; P = .006). This finding lost statistical significance in the logistic regression model, but all the other variables remained significantly associated. Serum IgM levels above 6,000 mg/dL conferred a 55-fold increase in the odds of having acquired VWD (95% confidence interval, 17-177; P less than .001), and serum IgM levels between 3,000 and 5,999 mg/dL led to an 11-fold increase in these odds (95% CI, 4-34). The presence of CXCR4 mutations was associated with a sixfold increased odds of acquired VWD (95% CI, 2-15). The P value for each of these three associations was at or below .001.
Therapy for Waldenström macroglobulinemia led to statistically significant increases in levels of factor VIII, VW factor antigen, and VW factor activity (P less than .001) and the median of each level improved by at least 35% after treatment. After treatment, 78% of patients with acquired VWD had levels of all three measures above 50% (versus 0% before treatment; P less than .001). Patients with acquired VWD with the best responses to treatment had about a 90% decrease in IgM levels, while those with a partial response had about a two-thirds decrease and patients with stable disease had about a 20% decrease. A linear regression model confirmed that depth of treatment response, based on change in IgM level, correlated with degree of improvement in VWD – that is, the extent of improvement in levels of VW factor antigen, VW factor activity, and factor VIII.
No external funding sources were reported. Dr. Castillo disclosed consulting ties and research funding from Pharmacyclics and Janssen, and research funding from Millenium and Abbvie.
SOURCE: Castillo J, et al. ASH 2017 Abstract 1088.
ATLANTA – Waldenström macroglobulinemia can present as acquired von Willebrand disease (VWD), and when it does, the finding strongly correlates with high serum IgM levels and the presence of CXCR4 mutations, according to the results of a large, single-center retrospective study.
Further, successfully treating Waldenström macroglobulinemia often resolves acquired VWD, and the depth of treatment response predicts the degree of improvement, Jorge J. Castillo, MD, and his associates wrote in a poster presented at the annual meeting of the American Society of Hematology.
Acquired VWD is an uncommon, poorly understood presentation of Waldenström macroglobulinemia. Because affected patients require treatment, better characterizing this subgroup is important, the investigators noted.
At the Bing Center for Waldenström Macroglobulinemia at Dana-Farber Cancer Institute in Boston, the researchers retrospectively studied 320 individuals with newly diagnosed Waldenström macroglobulinemia and used logistic regression analysis to seek predictors of acquired VWD, which they evaluated by measuring levels of VW factor antigen, VW factor activity, and factor VIII. Levels under 30% were considered VWD and levels between 30% and 50% were considered low-level VWD.
In all, 49 individuals had acquired VWD while 271 patients did not. These two groups were similar in terms of age, sex, hemoglobin level, platelet count, and bone marrow involvement. However, 45% of patients with acquired VWD had serum IgM levels above 6,000 mg/dL versus 6% of patients without acquired VWD (P less than .001), and 47% of patients with acquired VWD had serum IgM levels between 3,000 and 5,999 versus 31% of patients without acquired VWD (P less than .001). Also, 77% of patients with acquired VWD tested positive for CXCR4 mutation versus 37% of patients without acquired VWD (P less than .001).
A significantly higher proportion of patients without acquired VWD had white blood cell concentrations above 6,000/mcL (29% vs. 50%; P = .006). This finding lost statistical significance in the logistic regression model, but all the other variables remained significantly associated. Serum IgM levels above 6,000 mg/dL conferred a 55-fold increase in the odds of having acquired VWD (95% confidence interval, 17-177; P less than .001), and serum IgM levels between 3,000 and 5,999 mg/dL led to an 11-fold increase in these odds (95% CI, 4-34). The presence of CXCR4 mutations was associated with a sixfold increased odds of acquired VWD (95% CI, 2-15). The P value for each of these three associations was at or below .001.
Therapy for Waldenström macroglobulinemia led to statistically significant increases in levels of factor VIII, VW factor antigen, and VW factor activity (P less than .001) and the median of each level improved by at least 35% after treatment. After treatment, 78% of patients with acquired VWD had levels of all three measures above 50% (versus 0% before treatment; P less than .001). Patients with acquired VWD with the best responses to treatment had about a 90% decrease in IgM levels, while those with a partial response had about a two-thirds decrease and patients with stable disease had about a 20% decrease. A linear regression model confirmed that depth of treatment response, based on change in IgM level, correlated with degree of improvement in VWD – that is, the extent of improvement in levels of VW factor antigen, VW factor activity, and factor VIII.
No external funding sources were reported. Dr. Castillo disclosed consulting ties and research funding from Pharmacyclics and Janssen, and research funding from Millenium and Abbvie.
SOURCE: Castillo J, et al. ASH 2017 Abstract 1088.
AT ASH 2017
Key clinical point: Successfully treating Waldenström macroglobulinemia often resolves acquired von Willebrand disease.
Major finding: Therapy for Waldenström macroglobulinemia led to statistically significant increases in levels of factor VIII, VW factor antigen, and VW factor activity (P less than .001) and the median of each level improved by at least 35% after treatment.
Data source: A single-center retrospective study of 320 patients with newly diagnosed Waldenström macroglobulinemia.
Disclosures: No external funding sources were reported. Dr. Castillo disclosed consultancy and research funding from Pharmacyclics and Janssen. He also disclosed research funding from Millenium and Abbvie.
Source: Castillo J, et al. ASH 2017 Abstract 1088.
FDA axes asthma drugs’ boxed warning
The Food and Drug Administration has eliminated the boxed warning for risk of asthma-related death from the labels of products containing both an inhaled corticosteroid (ICS) and a long-acting beta agonist (LABA), the agency announced.
In 2011, the FDA required companies manufacturing fixed-dose LABA-ICS combination products to conduct 26-week clinical safety trials to evaluate the risks of serious adverse asthma-related events in patients treated with these drugs. Specifically, the companies had to compare the risks of taking a LABA in combination with an ICS with the risks of taking an ICS alone.
The removal of the boxed warning follows the FDA’s review of these trials, which found that treating asthma with LABAs in combination with ICS did not result in patients experiencing significantly more serious asthma-related side effects and asthma-related deaths, compared with those being treated with an ICS alone, according to the FDA announcement. “Results of subgroup analyses for gender, adolescents 12-18 years, and African Americans are consistent with the primary endpoint results,” the statement added.
“These trials showed that LABAs, when used with ICS, did not significantly increase the risk of asthma-related hospitalizations, the need to insert a breathing tube known as intubation, or asthma-related deaths, compared to ICS alone,” the FDA said in the statement.
The trials also demonstrated that using the combination reduced asthma exacerbations, compared with using ICS alone, and that most of the exacerbations “were those that required at least 3 days of systemic corticosteroids” – information that is being added the product labels, according to the FDA.
The products that will no longer carry this boxed warning in their labels include AstraZeneca’s budesonide/formoterol fumarate dihydrate (Symbicort) and GlaxoSmithKline’s fluticasone furoate/vilanterol (Breo Ellipta) and fluticasone propionate/salmeterol (Advair Diskus and Advair HFA).
The FDA also approved updates to the Warnings and Precautions section of labeling for the ICS/LABA class, which now includes a description of the four trials. Information on the efficacy of the drugs, found in the trials, has been added to the Clinical Studies section of the labels as well.
In a related safety announcement, the FDA stated the following: “Using LABAs alone to treat asthma without an ICS to treat lung inflammation is associated with an increased risk of asthma-related death. Therefore, the Boxed Warning stating this will remain in the labels of all single-ingredient LABA medicines, which are approved to treat asthma, chronic obstructive pulmonary disease (COPD), and wheezing caused by exercise. The labels of medicines that contain both an ICS and LABA also retain a Warning and Precaution related to the increased risk of asthma-related death when LABAs are used without an ICS to treat asthma.

The Food and Drug Administration has eliminated the boxed warning for risk of asthma-related death from the labels of products containing both an inhaled corticosteroid (ICS) and a long-acting beta agonist (LABA), the agency announced.
In 2011, the FDA required companies manufacturing fixed-dose LABA-ICS combination products to conduct 26-week clinical safety trials to evaluate the risks of serious adverse asthma-related events in patients treated with these drugs. Specifically, the companies had to compare the risks of taking a LABA in combination with an ICS with the risks of taking an ICS alone.
The removal of the boxed warning follows the FDA’s review of these trials, which found that treating asthma with LABAs in combination with ICS did not result in patients experiencing significantly more serious asthma-related side effects and asthma-related deaths, compared with those being treated with an ICS alone, according to the FDA announcement. “Results of subgroup analyses for gender, adolescents 12-18 years, and African Americans are consistent with the primary endpoint results,” the statement added.
“These trials showed that LABAs, when used with ICS, did not significantly increase the risk of asthma-related hospitalizations, the need to insert a breathing tube known as intubation, or asthma-related deaths, compared to ICS alone,” the FDA said in the statement.
The trials also demonstrated that using the combination reduced asthma exacerbations, compared with using ICS alone, and that most of the exacerbations “were those that required at least 3 days of systemic corticosteroids” – information that is being added the product labels, according to the FDA.
The products that will no longer carry this boxed warning in their labels include AstraZeneca’s budesonide/formoterol fumarate dihydrate (Symbicort) and GlaxoSmithKline’s fluticasone furoate/vilanterol (Breo Ellipta) and fluticasone propionate/salmeterol (Advair Diskus and Advair HFA).
The FDA also approved updates to the Warnings and Precautions section of labeling for the ICS/LABA class, which now includes a description of the four trials. Information on the efficacy of the drugs, found in the trials, has been added to the Clinical Studies section of the labels as well.
In a related safety announcement, the FDA stated the following: “Using LABAs alone to treat asthma without an ICS to treat lung inflammation is associated with an increased risk of asthma-related death. Therefore, the Boxed Warning stating this will remain in the labels of all single-ingredient LABA medicines, which are approved to treat asthma, chronic obstructive pulmonary disease (COPD), and wheezing caused by exercise. The labels of medicines that contain both an ICS and LABA also retain a Warning and Precaution related to the increased risk of asthma-related death when LABAs are used without an ICS to treat asthma.
The Food and Drug Administration has eliminated the boxed warning for risk of asthma-related death from the labels of products containing both an inhaled corticosteroid (ICS) and a long-acting beta agonist (LABA), the agency announced.
In 2011, the FDA required companies manufacturing fixed-dose LABA-ICS combination products to conduct 26-week clinical safety trials to evaluate the risks of serious adverse asthma-related events in patients treated with these drugs. Specifically, the companies had to compare the risks of taking a LABA in combination with an ICS with the risks of taking an ICS alone.
The removal of the boxed warning follows the FDA’s review of these trials, which found that treating asthma with LABAs in combination with ICS did not result in patients experiencing significantly more serious asthma-related side effects and asthma-related deaths, compared with those being treated with an ICS alone, according to the FDA announcement. “Results of subgroup analyses for gender, adolescents 12-18 years, and African Americans are consistent with the primary endpoint results,” the statement added.
“These trials showed that LABAs, when used with ICS, did not significantly increase the risk of asthma-related hospitalizations, the need to insert a breathing tube known as intubation, or asthma-related deaths, compared to ICS alone,” the FDA said in the statement.
The trials also demonstrated that using the combination reduced asthma exacerbations, compared with using ICS alone, and that most of the exacerbations “were those that required at least 3 days of systemic corticosteroids” – information that is being added the product labels, according to the FDA.
The products that will no longer carry this boxed warning in their labels include AstraZeneca’s budesonide/formoterol fumarate dihydrate (Symbicort) and GlaxoSmithKline’s fluticasone furoate/vilanterol (Breo Ellipta) and fluticasone propionate/salmeterol (Advair Diskus and Advair HFA).
The FDA also approved updates to the Warnings and Precautions section of labeling for the ICS/LABA class, which now includes a description of the four trials. Information on the efficacy of the drugs, found in the trials, has been added to the Clinical Studies section of the labels as well.
In a related safety announcement, the FDA stated the following: “Using LABAs alone to treat asthma without an ICS to treat lung inflammation is associated with an increased risk of asthma-related death. Therefore, the Boxed Warning stating this will remain in the labels of all single-ingredient LABA medicines, which are approved to treat asthma, chronic obstructive pulmonary disease (COPD), and wheezing caused by exercise. The labels of medicines that contain both an ICS and LABA also retain a Warning and Precaution related to the increased risk of asthma-related death when LABAs are used without an ICS to treat asthma.
A Connection Between Brain Glucose and Alzheimer?
For some time, researchers have suspected that diabetes and Alzheimer disease (AD) are similar, but those similarities have been hard to evaluate. Insulin is not needed for glucose to enter the brain or to get into neurons. But NIH researchers may have, for the first time, uncovered a connection.
Using brain tissue samples from participants in the Baltimore Longitudinal Study of Aging, one of the longest-running aging studies, the researchers measured glucose levels in different brain regions, including those either vulnerable or resistant to AD.
The researchers found distinct abnormalities in the way the brain breaks down glucose, and say severity of the abnormalities correlated with the severity of AD pathology. Lower rates of glycolysis and higher brain glucose levels correlated to more severe plaques and tangles in the brains of patients with AD. More severe reductions in brain glycolysis also were related to symptoms of the disease during life, such as memory problems.
The researchers caution that it is not yet clear whether abnormalities in brain glucose metabolism are definitively linked to the severity of AD symptoms or the speed of disease progression. However, lead investigator Madhav Thambisetty, MD, PhD, says “these findings point to a novel mechanism that could be targeted in the development of new treatments.”
For some time, researchers have suspected that diabetes and Alzheimer disease (AD) are similar, but those similarities have been hard to evaluate. Insulin is not needed for glucose to enter the brain or to get into neurons. But NIH researchers may have, for the first time, uncovered a connection.
Using brain tissue samples from participants in the Baltimore Longitudinal Study of Aging, one of the longest-running aging studies, the researchers measured glucose levels in different brain regions, including those either vulnerable or resistant to AD.
The researchers found distinct abnormalities in the way the brain breaks down glucose, and say severity of the abnormalities correlated with the severity of AD pathology. Lower rates of glycolysis and higher brain glucose levels correlated to more severe plaques and tangles in the brains of patients with AD. More severe reductions in brain glycolysis also were related to symptoms of the disease during life, such as memory problems.
The researchers caution that it is not yet clear whether abnormalities in brain glucose metabolism are definitively linked to the severity of AD symptoms or the speed of disease progression. However, lead investigator Madhav Thambisetty, MD, PhD, says “these findings point to a novel mechanism that could be targeted in the development of new treatments.”
For some time, researchers have suspected that diabetes and Alzheimer disease (AD) are similar, but those similarities have been hard to evaluate. Insulin is not needed for glucose to enter the brain or to get into neurons. But NIH researchers may have, for the first time, uncovered a connection.
Using brain tissue samples from participants in the Baltimore Longitudinal Study of Aging, one of the longest-running aging studies, the researchers measured glucose levels in different brain regions, including those either vulnerable or resistant to AD.
The researchers found distinct abnormalities in the way the brain breaks down glucose, and say severity of the abnormalities correlated with the severity of AD pathology. Lower rates of glycolysis and higher brain glucose levels correlated to more severe plaques and tangles in the brains of patients with AD. More severe reductions in brain glycolysis also were related to symptoms of the disease during life, such as memory problems.
The researchers caution that it is not yet clear whether abnormalities in brain glucose metabolism are definitively linked to the severity of AD symptoms or the speed of disease progression. However, lead investigator Madhav Thambisetty, MD, PhD, says “these findings point to a novel mechanism that could be targeted in the development of new treatments.”
For some time, researchers have suspected that diabetes and Alzheimer disease (AD) are similar, but those similarities have been hard to evaluate. Insulin is not needed for glucose to enter the brain or to get into neurons. But NIH researchers may have, for the first time, uncovered a connection.
Using brain tissue samples from participants in the Baltimore Longitudinal Study of Aging, one of the longest-running aging studies, the researchers measured glucose levels in different brain regions, including those either vulnerable or resistant to AD.
The researchers found distinct abnormalities in the way the brain breaks down glucose, and say severity of the abnormalities correlated with the severity of AD pathology. Lower rates of glycolysis and higher brain glucose levels correlated to more severe plaques and tangles in the brains of patients with AD. More severe reductions in brain glycolysis also were related to symptoms of the disease during life, such as memory problems.
The researchers caution that it is not yet clear whether abnormalities in brain glucose metabolism are definitively linked to the severity of AD symptoms or the speed of disease progression. However, lead investigator Madhav Thambisetty, MD, PhD, says “these findings point to a novel mechanism that could be targeted in the development of new treatments.”
For some time, researchers have suspected that diabetes and Alzheimer disease (AD) are similar, but those similarities have been hard to evaluate. Insulin is not needed for glucose to enter the brain or to get into neurons. But NIH researchers may have, for the first time, uncovered a connection.
Using brain tissue samples from participants in the Baltimore Longitudinal Study of Aging, one of the longest-running aging studies, the researchers measured glucose levels in different brain regions, including those either vulnerable or resistant to AD.
The researchers found distinct abnormalities in the way the brain breaks down glucose, and say severity of the abnormalities correlated with the severity of AD pathology. Lower rates of glycolysis and higher brain glucose levels correlated to more severe plaques and tangles in the brains of patients with AD. More severe reductions in brain glycolysis also were related to symptoms of the disease during life, such as memory problems.
The researchers caution that it is not yet clear whether abnormalities in brain glucose metabolism are definitively linked to the severity of AD symptoms or the speed of disease progression. However, lead investigator Madhav Thambisetty, MD, PhD, says “these findings point to a novel mechanism that could be targeted in the development of new treatments.”
For some time, researchers have suspected that diabetes and Alzheimer disease (AD) are similar, but those similarities have been hard to evaluate. Insulin is not needed for glucose to enter the brain or to get into neurons. But NIH researchers may have, for the first time, uncovered a connection.
Using brain tissue samples from participants in the Baltimore Longitudinal Study of Aging, one of the longest-running aging studies, the researchers measured glucose levels in different brain regions, including those either vulnerable or resistant to AD.
The researchers found distinct abnormalities in the way the brain breaks down glucose, and say severity of the abnormalities correlated with the severity of AD pathology. Lower rates of glycolysis and higher brain glucose levels correlated to more severe plaques and tangles in the brains of patients with AD. More severe reductions in brain glycolysis also were related to symptoms of the disease during life, such as memory problems.
The researchers caution that it is not yet clear whether abnormalities in brain glucose metabolism are definitively linked to the severity of AD symptoms or the speed of disease progression. However, lead investigator Madhav Thambisetty, MD, PhD, says “these findings point to a novel mechanism that could be targeted in the development of new treatments.”
Fentanyl: A Major Culprit in Opioid Overdoses
Researchers examined 5,152 people who died due to opioid overdose in Maine, Massachusetts, Missouri, New Hampshire, New Mexico, Ohio, Oklahoma, Rhode Island, West Virginia, and Wisconsin and found that nearly 3,000 were fentanyl positive. In addition, > 700 tested positive for drugs with similar chemical structures to fentanyl, including an extremely potent analog, carfentanil, which is used to sedate large animals.
The findings are from the first report on data from the State Unintentional Drug Overdose Reporting System (SUDORS). According to the CDC, SUDORS makes it possible to use toxicology and death scene investigation data previously unavailable across states to provide insights into specific substances and circumstances driving overdoses. That information can help pinpoint changes in the opioid epidemic and inform interventions.
Starting in late 2017, the CDC’s Enhanced State Opioid Overdose Surveillance program is funding expanded forensic toxicology testing of opioid overdose deaths to detect fentanyl analogs and other illicitly manufactured synthetic opioid drugs.
Researchers examined 5,152 people who died due to opioid overdose in Maine, Massachusetts, Missouri, New Hampshire, New Mexico, Ohio, Oklahoma, Rhode Island, West Virginia, and Wisconsin and found that nearly 3,000 were fentanyl positive. In addition, > 700 tested positive for drugs with similar chemical structures to fentanyl, including an extremely potent analog, carfentanil, which is used to sedate large animals.
The findings are from the first report on data from the State Unintentional Drug Overdose Reporting System (SUDORS). According to the CDC, SUDORS makes it possible to use toxicology and death scene investigation data previously unavailable across states to provide insights into specific substances and circumstances driving overdoses. That information can help pinpoint changes in the opioid epidemic and inform interventions.
Starting in late 2017, the CDC’s Enhanced State Opioid Overdose Surveillance program is funding expanded forensic toxicology testing of opioid overdose deaths to detect fentanyl analogs and other illicitly manufactured synthetic opioid drugs.
Researchers examined 5,152 people who died due to opioid overdose in Maine, Massachusetts, Missouri, New Hampshire, New Mexico, Ohio, Oklahoma, Rhode Island, West Virginia, and Wisconsin and found that nearly 3,000 were fentanyl positive. In addition, > 700 tested positive for drugs with similar chemical structures to fentanyl, including an extremely potent analog, carfentanil, which is used to sedate large animals.
The findings are from the first report on data from the State Unintentional Drug Overdose Reporting System (SUDORS). According to the CDC, SUDORS makes it possible to use toxicology and death scene investigation data previously unavailable across states to provide insights into specific substances and circumstances driving overdoses. That information can help pinpoint changes in the opioid epidemic and inform interventions.
Starting in late 2017, the CDC’s Enhanced State Opioid Overdose Surveillance program is funding expanded forensic toxicology testing of opioid overdose deaths to detect fentanyl analogs and other illicitly manufactured synthetic opioid drugs.