User login
Over 20 Years, Pain Is on the Rise
Pain is becoming a fact of life for more and more people, and they are turning to opioids to treat it, according to a survey sponsored by the National Center for Complementary and Integrative Health.
Researchers looked at nearly 2 decades-worth of cumulative data from the Medical Expenditure Panel Survey (MEPS). They found that since 1997/1998, pain prevalence in US adults rose by 25%.
In 1997/1998, about 33% of American adults had at ≤ 1 painful health condition. In 2013/2014, that proportion was 41%. For about 68 million people, moderate-to-severe pain was interfering with normal work activities. And those people were turning more often to strong opioids—eg, fentanyl, morphine, oxycodone—for help. Use of opioids to manage pain more than doubled in just 10 years: from 4.1 million (11.5%) in 2001/2002 to 10.5 million (24.3%) in 2013/2014.
People with severe pain-related interference also were more likely to have had > 4 opioid prescriptions and to have visited a doctor’s office > 6 times for pain compared with those with minimal pain-related interference.
Opioid use peaked between 2005 and 2012, but since 2012, opioid use has slightly declined. The researchers say this ties to a reduction in use of weak opioids and in the number of patients reporting only 1 opioid prescription.
The survey also found some small downward shifts in health care visits. Ambulatory office visits plateaued between 2001/2002 and 2007/2008 and decreased through 2013/2014. The researchers also found small but statistically significant drops in pain-related emergency department visits and overnight hospital stays.
The researchers say their findings suggest more education about the risk/benefit ratio of opioids “appears warranted.”
Pain is becoming a fact of life for more and more people, and they are turning to opioids to treat it, according to a survey sponsored by the National Center for Complementary and Integrative Health.
Researchers looked at nearly 2 decades-worth of cumulative data from the Medical Expenditure Panel Survey (MEPS). They found that since 1997/1998, pain prevalence in US adults rose by 25%.
In 1997/1998, about 33% of American adults had at ≤ 1 painful health condition. In 2013/2014, that proportion was 41%. For about 68 million people, moderate-to-severe pain was interfering with normal work activities. And those people were turning more often to strong opioids—eg, fentanyl, morphine, oxycodone—for help. Use of opioids to manage pain more than doubled in just 10 years: from 4.1 million (11.5%) in 2001/2002 to 10.5 million (24.3%) in 2013/2014.
People with severe pain-related interference also were more likely to have had > 4 opioid prescriptions and to have visited a doctor’s office > 6 times for pain compared with those with minimal pain-related interference.
Opioid use peaked between 2005 and 2012, but since 2012, opioid use has slightly declined. The researchers say this ties to a reduction in use of weak opioids and in the number of patients reporting only 1 opioid prescription.
The survey also found some small downward shifts in health care visits. Ambulatory office visits plateaued between 2001/2002 and 2007/2008 and decreased through 2013/2014. The researchers also found small but statistically significant drops in pain-related emergency department visits and overnight hospital stays.
The researchers say their findings suggest more education about the risk/benefit ratio of opioids “appears warranted.”
Pain is becoming a fact of life for more and more people, and they are turning to opioids to treat it, according to a survey sponsored by the National Center for Complementary and Integrative Health.
Researchers looked at nearly 2 decades-worth of cumulative data from the Medical Expenditure Panel Survey (MEPS). They found that since 1997/1998, pain prevalence in US adults rose by 25%.
In 1997/1998, about 33% of American adults had at ≤ 1 painful health condition. In 2013/2014, that proportion was 41%. For about 68 million people, moderate-to-severe pain was interfering with normal work activities. And those people were turning more often to strong opioids—eg, fentanyl, morphine, oxycodone—for help. Use of opioids to manage pain more than doubled in just 10 years: from 4.1 million (11.5%) in 2001/2002 to 10.5 million (24.3%) in 2013/2014.
People with severe pain-related interference also were more likely to have had > 4 opioid prescriptions and to have visited a doctor’s office > 6 times for pain compared with those with minimal pain-related interference.
Opioid use peaked between 2005 and 2012, but since 2012, opioid use has slightly declined. The researchers say this ties to a reduction in use of weak opioids and in the number of patients reporting only 1 opioid prescription.
The survey also found some small downward shifts in health care visits. Ambulatory office visits plateaued between 2001/2002 and 2007/2008 and decreased through 2013/2014. The researchers also found small but statistically significant drops in pain-related emergency department visits and overnight hospital stays.
The researchers say their findings suggest more education about the risk/benefit ratio of opioids “appears warranted.”
How Are Schizophrenic Patients Treated After Myocardial Infarction?
Patients with schizophrenia may not always get the cardiac treatment they should following a myocardial infarction (MI), according to researchers from Aalborg University Hospital, Denmark.
Studies have already established that patients with schizophrenia have a higher prevalence of cardiovascular disease (CVD) and that there is a strong correlation between MI and schizophrenia, the researchers say. Patients with schizophrenia also undergo fewer cardiac procedures compared with the general population. To try to find out why that might be, the researchers focused on the 4-stage process from initial admission following MI: offer of examination, acceptance of examination, offer of treatment, and acceptance of treatment.
Of 141 patients with a first MI, 47 also had a diagnosis of schizophrenia.
The researchers say their data show a “clear difference” between the 2 groups studied. Patients with schizophrenia were statistically significantly less likely to be offered and accept examination and to be offered and accept treatment than were the psychiatrically healthy controls. However, when the researchers analyzed each stage separately, none of the secondary results were statistically significant. Still they say, as a whole the stages contribute to the primary outcome of less cardiac treatment for these patients.
The researchers did find 2 significant differences between the 2 groups: Patients with schizophrenia were more likely to be smokers and have a lower familial predisposition to CVD. They also were less likely to be in treatment for diabetes, hypercholesterolemia and hypertension at the first MI, although that did not reach statistical significance. The 2 groups also differed in the treatments offered. Patients with schizophrenia were less often offered invasive coronary angiography (CAG) and more often offered exercise-ECG. In contrast, the controls were more likely to be offered CAG.
Without statistical significance, the researchers could not pinpoint whether physician bias, patients’ unwillingness to receive health care, or both were at the root of the discrepancies. They note that the clinical manifestations of schizophrenia “may be seen as a complication for postoperative care” and influence decisions about cardiac procedures. Those decisions may be based on “tacit assumptions rather than on standard guidelines based on medical outcomes,” the researchers add. Three patients in the study reported that they had previously visited the hospital complaining of typical chest pain but were sent home without examination. The researchers cite another study that found patients with schizophrenia receive care only when their symptoms are “severe enough.”
However, patients with schizophrenia also are known to be more likely to decline treatment, perhaps in part because they do not understand the importance of treatment, the researchers say.
The researchers suggest that the way patients are handled by the treating doctor “needs to be reformed.” It is important, they say, that health care providers are aware of the limits of dealing with a double-diagnosed patient and of the possibility of unintentional bias. A “more personalized approach,” they conclude, might make patients with schizophrenia more willing to cooperate with offers of treatment.
Patients with schizophrenia may not always get the cardiac treatment they should following a myocardial infarction (MI), according to researchers from Aalborg University Hospital, Denmark.
Studies have already established that patients with schizophrenia have a higher prevalence of cardiovascular disease (CVD) and that there is a strong correlation between MI and schizophrenia, the researchers say. Patients with schizophrenia also undergo fewer cardiac procedures compared with the general population. To try to find out why that might be, the researchers focused on the 4-stage process from initial admission following MI: offer of examination, acceptance of examination, offer of treatment, and acceptance of treatment.
Of 141 patients with a first MI, 47 also had a diagnosis of schizophrenia.
The researchers say their data show a “clear difference” between the 2 groups studied. Patients with schizophrenia were statistically significantly less likely to be offered and accept examination and to be offered and accept treatment than were the psychiatrically healthy controls. However, when the researchers analyzed each stage separately, none of the secondary results were statistically significant. Still they say, as a whole the stages contribute to the primary outcome of less cardiac treatment for these patients.
The researchers did find 2 significant differences between the 2 groups: Patients with schizophrenia were more likely to be smokers and have a lower familial predisposition to CVD. They also were less likely to be in treatment for diabetes, hypercholesterolemia and hypertension at the first MI, although that did not reach statistical significance. The 2 groups also differed in the treatments offered. Patients with schizophrenia were less often offered invasive coronary angiography (CAG) and more often offered exercise-ECG. In contrast, the controls were more likely to be offered CAG.
Without statistical significance, the researchers could not pinpoint whether physician bias, patients’ unwillingness to receive health care, or both were at the root of the discrepancies. They note that the clinical manifestations of schizophrenia “may be seen as a complication for postoperative care” and influence decisions about cardiac procedures. Those decisions may be based on “tacit assumptions rather than on standard guidelines based on medical outcomes,” the researchers add. Three patients in the study reported that they had previously visited the hospital complaining of typical chest pain but were sent home without examination. The researchers cite another study that found patients with schizophrenia receive care only when their symptoms are “severe enough.”
However, patients with schizophrenia also are known to be more likely to decline treatment, perhaps in part because they do not understand the importance of treatment, the researchers say.
The researchers suggest that the way patients are handled by the treating doctor “needs to be reformed.” It is important, they say, that health care providers are aware of the limits of dealing with a double-diagnosed patient and of the possibility of unintentional bias. A “more personalized approach,” they conclude, might make patients with schizophrenia more willing to cooperate with offers of treatment.
Patients with schizophrenia may not always get the cardiac treatment they should following a myocardial infarction (MI), according to researchers from Aalborg University Hospital, Denmark.
Studies have already established that patients with schizophrenia have a higher prevalence of cardiovascular disease (CVD) and that there is a strong correlation between MI and schizophrenia, the researchers say. Patients with schizophrenia also undergo fewer cardiac procedures compared with the general population. To try to find out why that might be, the researchers focused on the 4-stage process from initial admission following MI: offer of examination, acceptance of examination, offer of treatment, and acceptance of treatment.
Of 141 patients with a first MI, 47 also had a diagnosis of schizophrenia.
The researchers say their data show a “clear difference” between the 2 groups studied. Patients with schizophrenia were statistically significantly less likely to be offered and accept examination and to be offered and accept treatment than were the psychiatrically healthy controls. However, when the researchers analyzed each stage separately, none of the secondary results were statistically significant. Still they say, as a whole the stages contribute to the primary outcome of less cardiac treatment for these patients.
The researchers did find 2 significant differences between the 2 groups: Patients with schizophrenia were more likely to be smokers and have a lower familial predisposition to CVD. They also were less likely to be in treatment for diabetes, hypercholesterolemia and hypertension at the first MI, although that did not reach statistical significance. The 2 groups also differed in the treatments offered. Patients with schizophrenia were less often offered invasive coronary angiography (CAG) and more often offered exercise-ECG. In contrast, the controls were more likely to be offered CAG.
Without statistical significance, the researchers could not pinpoint whether physician bias, patients’ unwillingness to receive health care, or both were at the root of the discrepancies. They note that the clinical manifestations of schizophrenia “may be seen as a complication for postoperative care” and influence decisions about cardiac procedures. Those decisions may be based on “tacit assumptions rather than on standard guidelines based on medical outcomes,” the researchers add. Three patients in the study reported that they had previously visited the hospital complaining of typical chest pain but were sent home without examination. The researchers cite another study that found patients with schizophrenia receive care only when their symptoms are “severe enough.”
However, patients with schizophrenia also are known to be more likely to decline treatment, perhaps in part because they do not understand the importance of treatment, the researchers say.
The researchers suggest that the way patients are handled by the treating doctor “needs to be reformed.” It is important, they say, that health care providers are aware of the limits of dealing with a double-diagnosed patient and of the possibility of unintentional bias. A “more personalized approach,” they conclude, might make patients with schizophrenia more willing to cooperate with offers of treatment.
U.S. sesame allergy prevalence estimated at 750,000
SAN FRANCISCO – The estimated roughly about 750,000 people, according to a recent, representative survey of more than 78,000 Americans, which shows sesame allergy apparently is common enough to prompt the Food and Drug Administration to require food labels that identify sesame as an ingredient or possible contaminant.
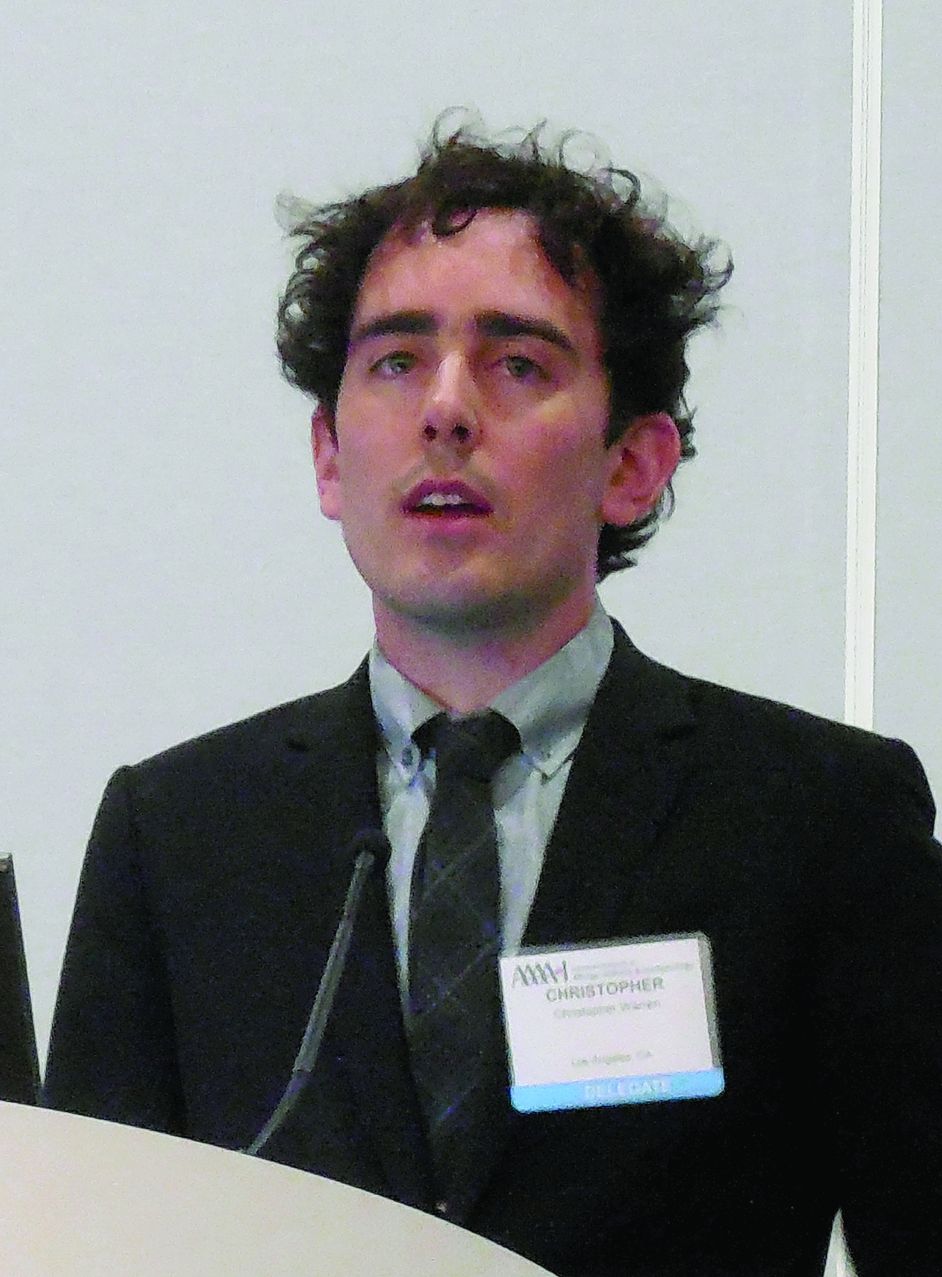
The sesame-allergy data also showed that sesame reactions were rated as having been severe by about a third of respondents, they caused about two-thirds of people who responded to sesame to go to an emergency department at least once (the highest rate for this outcome among all food allergies), and reactions had led to use of an epinephrine automated injector by about a quarter of people who responded to it, Christopher M. Warren said at the annual meeting of the American Academy of Allergy, Asthma, and Immunology.
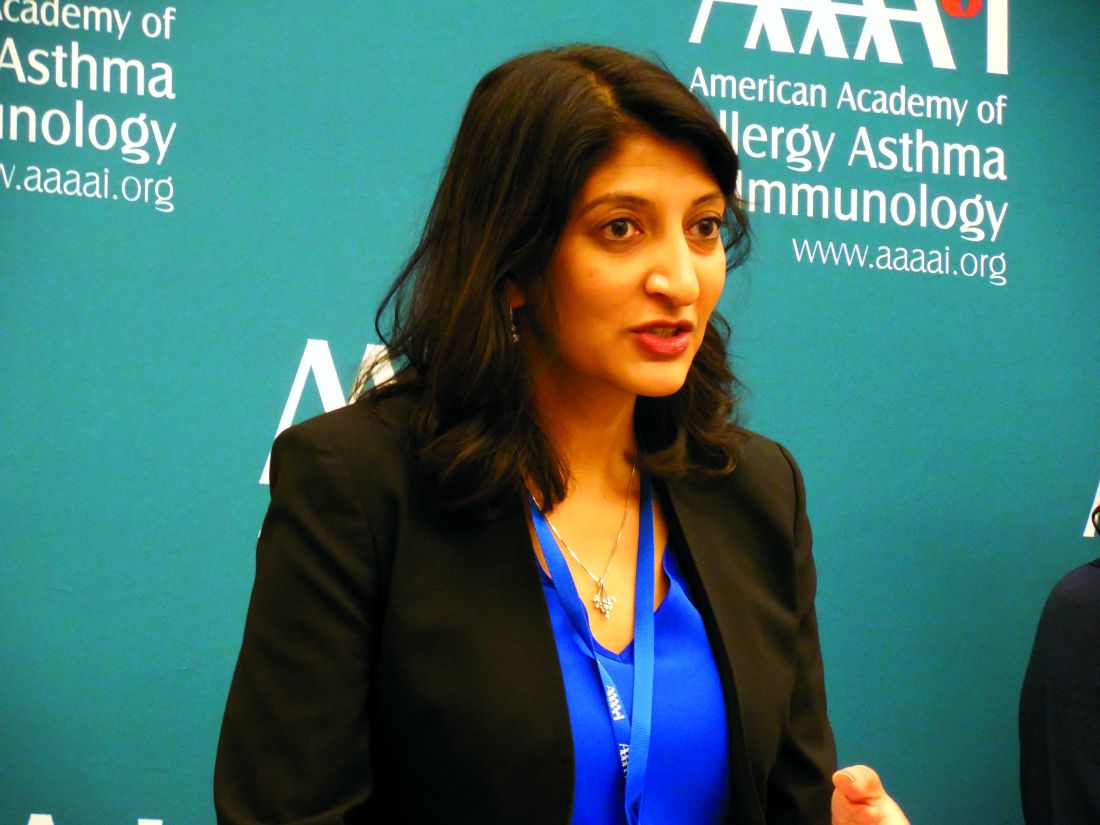
These findings document the public health importance of sesame allergy, which seems widespread and often severe enough to warrant making sesame the ninth allergen to require specific food labeling, said Ruchi S. Gupta, MD, senior author of the study and a professor of pediatrics and medicine at Northwestern University in Chicago.
“It seems to rank up with other food allergens regarding reaction severity,” Dr. Gupta said in a video interview. In October 2018, the FDA requested information on sesame allergy so that its staff could consider adding sesame to its list of major food allergens. The eight current major food allergens that require specific labeling are: peanut, tree nuts, eggs, milk, fish, shellfish, wheat, and soy. The 0.23% prevalence of sesame among U.S. residents makes it more common than certain tree nuts, and so the prevalence numbers also seem to justify adding sesame to the FDA’s labeling list because 750,000 is “a lot of people,” she noted.
An established surveying group based at the University of Chicago ran the data collection, which received responses from 53,575 U.S. household including 40,443 adults and 38,408 children. Dr. Gupta and her associates recently published information on the methods of the survey and other findings it made about U.S. food allergy rates (JAMA Network Open. 2019 Jan 4. doi: 10.1001/jamanetworkopen.2018.5630). The descriptions people provided about their food allergy diagnoses, and the effects these allergies had, underwent detailed review by a panel of experts who decide whether or not the evidence for an allergy was “convincing.” The 0.23% prevalence rate reported for sesame represented people for whom this allergy was convincingly demonstrated, reflected a confirmed physician diagnosis, or both, and hence it was a conservative estimate, Dr. Gupta said.
Mr. Warren had no disclosures. Dr. Gupta has been a consultant to Aimmune, Before Brands, DBV Technologies, Kaleo, Mylan, and Pfizer, and she has received research funding from Aimmune, Mylan, the National Confectioners Association, Rho, and Thermo Fisher.
SOURCE: Chadha AS et al. AAAAI 2019, Abstract 615.
SAN FRANCISCO – The estimated roughly about 750,000 people, according to a recent, representative survey of more than 78,000 Americans, which shows sesame allergy apparently is common enough to prompt the Food and Drug Administration to require food labels that identify sesame as an ingredient or possible contaminant.
The sesame-allergy data also showed that sesame reactions were rated as having been severe by about a third of respondents, they caused about two-thirds of people who responded to sesame to go to an emergency department at least once (the highest rate for this outcome among all food allergies), and reactions had led to use of an epinephrine automated injector by about a quarter of people who responded to it, Christopher M. Warren said at the annual meeting of the American Academy of Allergy, Asthma, and Immunology.
These findings document the public health importance of sesame allergy, which seems widespread and often severe enough to warrant making sesame the ninth allergen to require specific food labeling, said Ruchi S. Gupta, MD, senior author of the study and a professor of pediatrics and medicine at Northwestern University in Chicago.
“It seems to rank up with other food allergens regarding reaction severity,” Dr. Gupta said in a video interview. In October 2018, the FDA requested information on sesame allergy so that its staff could consider adding sesame to its list of major food allergens. The eight current major food allergens that require specific labeling are: peanut, tree nuts, eggs, milk, fish, shellfish, wheat, and soy. The 0.23% prevalence of sesame among U.S. residents makes it more common than certain tree nuts, and so the prevalence numbers also seem to justify adding sesame to the FDA’s labeling list because 750,000 is “a lot of people,” she noted.
An established surveying group based at the University of Chicago ran the data collection, which received responses from 53,575 U.S. household including 40,443 adults and 38,408 children. Dr. Gupta and her associates recently published information on the methods of the survey and other findings it made about U.S. food allergy rates (JAMA Network Open. 2019 Jan 4. doi: 10.1001/jamanetworkopen.2018.5630). The descriptions people provided about their food allergy diagnoses, and the effects these allergies had, underwent detailed review by a panel of experts who decide whether or not the evidence for an allergy was “convincing.” The 0.23% prevalence rate reported for sesame represented people for whom this allergy was convincingly demonstrated, reflected a confirmed physician diagnosis, or both, and hence it was a conservative estimate, Dr. Gupta said.
Mr. Warren had no disclosures. Dr. Gupta has been a consultant to Aimmune, Before Brands, DBV Technologies, Kaleo, Mylan, and Pfizer, and she has received research funding from Aimmune, Mylan, the National Confectioners Association, Rho, and Thermo Fisher.
SOURCE: Chadha AS et al. AAAAI 2019, Abstract 615.
SAN FRANCISCO – The estimated roughly about 750,000 people, according to a recent, representative survey of more than 78,000 Americans, which shows sesame allergy apparently is common enough to prompt the Food and Drug Administration to require food labels that identify sesame as an ingredient or possible contaminant.
The sesame-allergy data also showed that sesame reactions were rated as having been severe by about a third of respondents, they caused about two-thirds of people who responded to sesame to go to an emergency department at least once (the highest rate for this outcome among all food allergies), and reactions had led to use of an epinephrine automated injector by about a quarter of people who responded to it, Christopher M. Warren said at the annual meeting of the American Academy of Allergy, Asthma, and Immunology.
These findings document the public health importance of sesame allergy, which seems widespread and often severe enough to warrant making sesame the ninth allergen to require specific food labeling, said Ruchi S. Gupta, MD, senior author of the study and a professor of pediatrics and medicine at Northwestern University in Chicago.
“It seems to rank up with other food allergens regarding reaction severity,” Dr. Gupta said in a video interview. In October 2018, the FDA requested information on sesame allergy so that its staff could consider adding sesame to its list of major food allergens. The eight current major food allergens that require specific labeling are: peanut, tree nuts, eggs, milk, fish, shellfish, wheat, and soy. The 0.23% prevalence of sesame among U.S. residents makes it more common than certain tree nuts, and so the prevalence numbers also seem to justify adding sesame to the FDA’s labeling list because 750,000 is “a lot of people,” she noted.
An established surveying group based at the University of Chicago ran the data collection, which received responses from 53,575 U.S. household including 40,443 adults and 38,408 children. Dr. Gupta and her associates recently published information on the methods of the survey and other findings it made about U.S. food allergy rates (JAMA Network Open. 2019 Jan 4. doi: 10.1001/jamanetworkopen.2018.5630). The descriptions people provided about their food allergy diagnoses, and the effects these allergies had, underwent detailed review by a panel of experts who decide whether or not the evidence for an allergy was “convincing.” The 0.23% prevalence rate reported for sesame represented people for whom this allergy was convincingly demonstrated, reflected a confirmed physician diagnosis, or both, and hence it was a conservative estimate, Dr. Gupta said.
Mr. Warren had no disclosures. Dr. Gupta has been a consultant to Aimmune, Before Brands, DBV Technologies, Kaleo, Mylan, and Pfizer, and she has received research funding from Aimmune, Mylan, the National Confectioners Association, Rho, and Thermo Fisher.
SOURCE: Chadha AS et al. AAAAI 2019, Abstract 615.
REPORTING FROM AAAAI 2019
Key clinical point: The U.S. prevalence of allergy to sesame is roughly similar to other foods that require food labeling.
Major finding: The prevalence of sesame allergy was 0.23% of U.S. adults and children.
Study details: A detailed survey of food allergies completed for 53,575 U.S. households that included 78,851 people.
Disclosures: Mr. Warren had no disclosures. Dr. Gupta had been a consultant to Aimmune, Before Brands, DBV Technologies, Kaleo, Mylan, and Pfizer, and she had received research funding from Aimmune, Mylan, the National Confectioners Association, Rho, and Thermo Fisher.
Source: Chadha AS et al. AAAAI 2019, Abstract 615.
Protecting Older Women Against HIV Infection
Older women represent 56% of all women with HIV, and in a 2009 study, they had the highest rates of HIV- and AIDS-related deaths. But few HIV prevention and education programs focus on older women, says Christopher Coleman, PhD, MPH, department chair and professor, Department of Health Promotion and Disease Prevention, The University of Tennessee Health Science Center, College of Nursing. Moreover, sexual health studies mainly concentrate on younger women and reproductive health, not risk factors for HIV among older women.
Coleman says the “confluence of lack of knowledge and absent communication about HIV risk has created a significant health crisis” for this group. He reviewed 41 articles that provide some insight.
Ageism, biological factors, and lack of education all play a part. Some research has found that older women are less likely to engage in safe sex practices because they no longer use condoms to prevent pregnancy. The National AIDS Behavior Survey found that > 85% of respondents aged ≥ 50 years reported never using condoms or using them inconsistently. However, women in the postmenopausal age group are sexually active, and because they may be divorced or widowed, may not be in committed relationships. Also, age-related physical changes, such as thinning vaginal tissue and a weakened immune system, can make them more vulnerable to infection.
The problem is compounded when an older woman is unwilling to bring up the topic with health care providers—and health care providers are unwilling to believe that she is sexually active. Women aged > 50 years may also avoid seeking HIV testing due to social factors. And they may be prevented from traveling to health care or testing by poor physical health or other age-related issues.
We need new methods of reaching them, Coleman says. Existing HIV/AIDS instructional programs may not be effective tools for women with age-related comorbidities, such as cognitive, visual, or auditory deficits. Other options should be considered: For instance, small peer groups have been more successful than large groups, providing a sense of safety and belonging that encourages disclosure.
Health care providers should include education during routine office visits, Coleman advises, using non-ageist and nonstereotyping strategies and questions. Nurses are well positioned to educate women about the risks of HIV transmission; he says: discussing sexual activity with older women requires the “art of therapeutic communication without judgment.”
Older women represent 56% of all women with HIV, and in a 2009 study, they had the highest rates of HIV- and AIDS-related deaths. But few HIV prevention and education programs focus on older women, says Christopher Coleman, PhD, MPH, department chair and professor, Department of Health Promotion and Disease Prevention, The University of Tennessee Health Science Center, College of Nursing. Moreover, sexual health studies mainly concentrate on younger women and reproductive health, not risk factors for HIV among older women.
Coleman says the “confluence of lack of knowledge and absent communication about HIV risk has created a significant health crisis” for this group. He reviewed 41 articles that provide some insight.
Ageism, biological factors, and lack of education all play a part. Some research has found that older women are less likely to engage in safe sex practices because they no longer use condoms to prevent pregnancy. The National AIDS Behavior Survey found that > 85% of respondents aged ≥ 50 years reported never using condoms or using them inconsistently. However, women in the postmenopausal age group are sexually active, and because they may be divorced or widowed, may not be in committed relationships. Also, age-related physical changes, such as thinning vaginal tissue and a weakened immune system, can make them more vulnerable to infection.
The problem is compounded when an older woman is unwilling to bring up the topic with health care providers—and health care providers are unwilling to believe that she is sexually active. Women aged > 50 years may also avoid seeking HIV testing due to social factors. And they may be prevented from traveling to health care or testing by poor physical health or other age-related issues.
We need new methods of reaching them, Coleman says. Existing HIV/AIDS instructional programs may not be effective tools for women with age-related comorbidities, such as cognitive, visual, or auditory deficits. Other options should be considered: For instance, small peer groups have been more successful than large groups, providing a sense of safety and belonging that encourages disclosure.
Health care providers should include education during routine office visits, Coleman advises, using non-ageist and nonstereotyping strategies and questions. Nurses are well positioned to educate women about the risks of HIV transmission; he says: discussing sexual activity with older women requires the “art of therapeutic communication without judgment.”
Older women represent 56% of all women with HIV, and in a 2009 study, they had the highest rates of HIV- and AIDS-related deaths. But few HIV prevention and education programs focus on older women, says Christopher Coleman, PhD, MPH, department chair and professor, Department of Health Promotion and Disease Prevention, The University of Tennessee Health Science Center, College of Nursing. Moreover, sexual health studies mainly concentrate on younger women and reproductive health, not risk factors for HIV among older women.
Coleman says the “confluence of lack of knowledge and absent communication about HIV risk has created a significant health crisis” for this group. He reviewed 41 articles that provide some insight.
Ageism, biological factors, and lack of education all play a part. Some research has found that older women are less likely to engage in safe sex practices because they no longer use condoms to prevent pregnancy. The National AIDS Behavior Survey found that > 85% of respondents aged ≥ 50 years reported never using condoms or using them inconsistently. However, women in the postmenopausal age group are sexually active, and because they may be divorced or widowed, may not be in committed relationships. Also, age-related physical changes, such as thinning vaginal tissue and a weakened immune system, can make them more vulnerable to infection.
The problem is compounded when an older woman is unwilling to bring up the topic with health care providers—and health care providers are unwilling to believe that she is sexually active. Women aged > 50 years may also avoid seeking HIV testing due to social factors. And they may be prevented from traveling to health care or testing by poor physical health or other age-related issues.
We need new methods of reaching them, Coleman says. Existing HIV/AIDS instructional programs may not be effective tools for women with age-related comorbidities, such as cognitive, visual, or auditory deficits. Other options should be considered: For instance, small peer groups have been more successful than large groups, providing a sense of safety and belonging that encourages disclosure.
Health care providers should include education during routine office visits, Coleman advises, using non-ageist and nonstereotyping strategies and questions. Nurses are well positioned to educate women about the risks of HIV transmission; he says: discussing sexual activity with older women requires the “art of therapeutic communication without judgment.”
Influenza activity continues to increase
The 2018-2019 flu season is showing no signs of decline as activity measures continued to increase into mid-February, according to the Centers for Disease Control and Prevention.
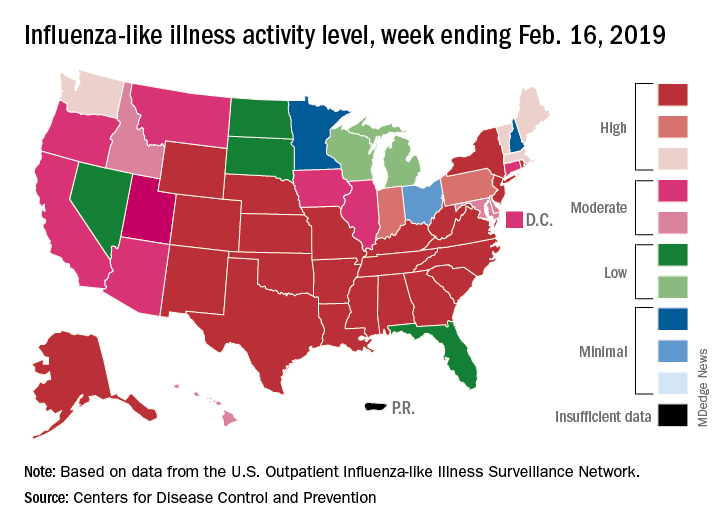
Eight of the last 10 flu seasons had already reached their peak before mid-February, but another rise brought the proportion of outpatient visits for influenza-like illness (ILI) to 5.1% for the week ending Feb. 16, compared with 4.8% the week before, the CDC’s influenza division reported Feb. 22. ILI is defined as fever (temperature of 100°F [37.8°C] or greater) and cough and/or sore throat.
The week also brought more ILI to more states, as the number reporting an activity level of 10 on the CDC’s 1-10 scale rose from 21 to 24 and the number in the high range of 8-10 increased from 26 to 30. Another seven states – including California, which was at level 5 the previous week – and the District of Columbia were at level 7 for the current reporting week, the CDC said.
Two flu-related pediatric deaths occurred during the week ending Feb. 16 and another five were reported from previous weeks, which brings the total to 41 for the 2018-2019 season. Data for influenza deaths at all ages, which are reported a week later, show that 205 occurred in the week ending Feb. 9, with reporting 75% complete. There were 236 total deaths for the week ending Feb. 2 (94% reporting) and 218 deaths during the week ending Jan. 26 (99% reporting), the CDC said.
The 2018-2019 flu season is showing no signs of decline as activity measures continued to increase into mid-February, according to the Centers for Disease Control and Prevention.
Eight of the last 10 flu seasons had already reached their peak before mid-February, but another rise brought the proportion of outpatient visits for influenza-like illness (ILI) to 5.1% for the week ending Feb. 16, compared with 4.8% the week before, the CDC’s influenza division reported Feb. 22. ILI is defined as fever (temperature of 100°F [37.8°C] or greater) and cough and/or sore throat.
The week also brought more ILI to more states, as the number reporting an activity level of 10 on the CDC’s 1-10 scale rose from 21 to 24 and the number in the high range of 8-10 increased from 26 to 30. Another seven states – including California, which was at level 5 the previous week – and the District of Columbia were at level 7 for the current reporting week, the CDC said.
Two flu-related pediatric deaths occurred during the week ending Feb. 16 and another five were reported from previous weeks, which brings the total to 41 for the 2018-2019 season. Data for influenza deaths at all ages, which are reported a week later, show that 205 occurred in the week ending Feb. 9, with reporting 75% complete. There were 236 total deaths for the week ending Feb. 2 (94% reporting) and 218 deaths during the week ending Jan. 26 (99% reporting), the CDC said.
The 2018-2019 flu season is showing no signs of decline as activity measures continued to increase into mid-February, according to the Centers for Disease Control and Prevention.
Eight of the last 10 flu seasons had already reached their peak before mid-February, but another rise brought the proportion of outpatient visits for influenza-like illness (ILI) to 5.1% for the week ending Feb. 16, compared with 4.8% the week before, the CDC’s influenza division reported Feb. 22. ILI is defined as fever (temperature of 100°F [37.8°C] or greater) and cough and/or sore throat.
The week also brought more ILI to more states, as the number reporting an activity level of 10 on the CDC’s 1-10 scale rose from 21 to 24 and the number in the high range of 8-10 increased from 26 to 30. Another seven states – including California, which was at level 5 the previous week – and the District of Columbia were at level 7 for the current reporting week, the CDC said.
Two flu-related pediatric deaths occurred during the week ending Feb. 16 and another five were reported from previous weeks, which brings the total to 41 for the 2018-2019 season. Data for influenza deaths at all ages, which are reported a week later, show that 205 occurred in the week ending Feb. 9, with reporting 75% complete. There were 236 total deaths for the week ending Feb. 2 (94% reporting) and 218 deaths during the week ending Jan. 26 (99% reporting), the CDC said.
A New Way to Measure How HIV Drugs Are Working
One of the tricky parts of HIV drug therapy is determining how well the drugs have worked. The HIV DNA (provirus) in resting cells is usually too defective to replicate itself the way intact provirus can. But most current tests cannot tell the difference between the two. However, researchers from Johns Hopkins University School of Medicine in Baltimore have developed an accurate and scalable assay to easily count the cells in the HIV reservoir.
A stable, latent reservoir for HIV-1 in resting CD4+ T cells is “the principle barrier to a cure,” the researchers say. Quantitative outgrowth assays and assays for cells that produce viral RNA after T-cell activation may underestimate the reservoir size because 1 round of activation does not induce all proviruses. Many studies, the researchers say, rely on simple assays based on polymerase chain reaction to detect proviral DNA regardless of transcriptional status, but the clinical relevance of those assays is unclear since the vast majority of proviruses are defective.
In their study, supported by the National Institute of Allergy and Infectious Diseases, the researchers analyzed DNA sequences from > 400 HIV proviruses from 28 people with HIV. They mapped 2 types of flaws: deletions and lethal mutations. They then developed strategically placed “genetic probes” that could distinguish between deleted or highly mutated proviruses and intact ones. Finally, they developed a nanotechnology-based method to analyze 1 provirus at a time to determine how many in a sample are intact.
The researchers say their findings show that the dynamics of cells that carry intact and defective proviruses are different in vitro and in vivo. Their hope is that their method will speed HIV research by allowing scientists to easily quantify the number of proviruses in an individual, which must be eliminated to achieve a cure.
One of the tricky parts of HIV drug therapy is determining how well the drugs have worked. The HIV DNA (provirus) in resting cells is usually too defective to replicate itself the way intact provirus can. But most current tests cannot tell the difference between the two. However, researchers from Johns Hopkins University School of Medicine in Baltimore have developed an accurate and scalable assay to easily count the cells in the HIV reservoir.
A stable, latent reservoir for HIV-1 in resting CD4+ T cells is “the principle barrier to a cure,” the researchers say. Quantitative outgrowth assays and assays for cells that produce viral RNA after T-cell activation may underestimate the reservoir size because 1 round of activation does not induce all proviruses. Many studies, the researchers say, rely on simple assays based on polymerase chain reaction to detect proviral DNA regardless of transcriptional status, but the clinical relevance of those assays is unclear since the vast majority of proviruses are defective.
In their study, supported by the National Institute of Allergy and Infectious Diseases, the researchers analyzed DNA sequences from > 400 HIV proviruses from 28 people with HIV. They mapped 2 types of flaws: deletions and lethal mutations. They then developed strategically placed “genetic probes” that could distinguish between deleted or highly mutated proviruses and intact ones. Finally, they developed a nanotechnology-based method to analyze 1 provirus at a time to determine how many in a sample are intact.
The researchers say their findings show that the dynamics of cells that carry intact and defective proviruses are different in vitro and in vivo. Their hope is that their method will speed HIV research by allowing scientists to easily quantify the number of proviruses in an individual, which must be eliminated to achieve a cure.
One of the tricky parts of HIV drug therapy is determining how well the drugs have worked. The HIV DNA (provirus) in resting cells is usually too defective to replicate itself the way intact provirus can. But most current tests cannot tell the difference between the two. However, researchers from Johns Hopkins University School of Medicine in Baltimore have developed an accurate and scalable assay to easily count the cells in the HIV reservoir.
A stable, latent reservoir for HIV-1 in resting CD4+ T cells is “the principle barrier to a cure,” the researchers say. Quantitative outgrowth assays and assays for cells that produce viral RNA after T-cell activation may underestimate the reservoir size because 1 round of activation does not induce all proviruses. Many studies, the researchers say, rely on simple assays based on polymerase chain reaction to detect proviral DNA regardless of transcriptional status, but the clinical relevance of those assays is unclear since the vast majority of proviruses are defective.
In their study, supported by the National Institute of Allergy and Infectious Diseases, the researchers analyzed DNA sequences from > 400 HIV proviruses from 28 people with HIV. They mapped 2 types of flaws: deletions and lethal mutations. They then developed strategically placed “genetic probes” that could distinguish between deleted or highly mutated proviruses and intact ones. Finally, they developed a nanotechnology-based method to analyze 1 provirus at a time to determine how many in a sample are intact.
The researchers say their findings show that the dynamics of cells that carry intact and defective proviruses are different in vitro and in vivo. Their hope is that their method will speed HIV research by allowing scientists to easily quantify the number of proviruses in an individual, which must be eliminated to achieve a cure.
Brain Biomarkers May Help Explain Severe PTSD Symptoms
A current theory holds that during a traumatic event, a person may learn to associate the people, locations, and objects in the situation with the trauma, and long after the event even the “safe” stimuli can trigger fearful and defensive responses. Experts believe it is an “overlearned response” to a threatening experience. But the way in which that learning happens is not well understood, say researchers from Yale University in New Haven, Connecticut, and the Icahn School of Medicine at Mount Sinai in New York City. Their study, though, may shed new light on how people with PTSD symptoms learn and unlearn fear.
In the study, funded in part by the National Institute of Mental Health, the researchers examined how the mental adjustments performed during learning and the way the brain tracks these adjustments relate to symptom severity.
They gave combat veterans with varying levels of PTSD symptom severity a reversal learning task. Participants were shown 2 mildly angry human faces and mildly shocked after viewing 1 face, but not the other. Then the task was reversed, with the aim of having the participants “unlearn” their original fear conditioning and testing their ability to relearn how to respond to negative surprises in the environment.
Although all participants were able to perform the reversal learning, the researchers found “pronounced differences in the ‘learning rates.’” Highly symptomatic veterans tended to overreact when what they expected to happen and what actually happened did not match up.
The researchers say they found biomarkers that could explain the different reactions. In the highly symptomatic veterans, 2 areas of the brain—the amygdala and striatum—were less able to track changes in threat level.
“One’s inability to adequately adjust expectations for potentially aversive outcomes has potential clinical relevance,” said Ilan Harpaz-Rotem, PhD, co-leader of the study, “as this deficit may lead to avoidance and depressive behavior.”
The researchers say their findings could give a “more fine-grained understanding of how learning processes may go awry in the aftermath of combat trauma.”
A current theory holds that during a traumatic event, a person may learn to associate the people, locations, and objects in the situation with the trauma, and long after the event even the “safe” stimuli can trigger fearful and defensive responses. Experts believe it is an “overlearned response” to a threatening experience. But the way in which that learning happens is not well understood, say researchers from Yale University in New Haven, Connecticut, and the Icahn School of Medicine at Mount Sinai in New York City. Their study, though, may shed new light on how people with PTSD symptoms learn and unlearn fear.
In the study, funded in part by the National Institute of Mental Health, the researchers examined how the mental adjustments performed during learning and the way the brain tracks these adjustments relate to symptom severity.
They gave combat veterans with varying levels of PTSD symptom severity a reversal learning task. Participants were shown 2 mildly angry human faces and mildly shocked after viewing 1 face, but not the other. Then the task was reversed, with the aim of having the participants “unlearn” their original fear conditioning and testing their ability to relearn how to respond to negative surprises in the environment.
Although all participants were able to perform the reversal learning, the researchers found “pronounced differences in the ‘learning rates.’” Highly symptomatic veterans tended to overreact when what they expected to happen and what actually happened did not match up.
The researchers say they found biomarkers that could explain the different reactions. In the highly symptomatic veterans, 2 areas of the brain—the amygdala and striatum—were less able to track changes in threat level.
“One’s inability to adequately adjust expectations for potentially aversive outcomes has potential clinical relevance,” said Ilan Harpaz-Rotem, PhD, co-leader of the study, “as this deficit may lead to avoidance and depressive behavior.”
The researchers say their findings could give a “more fine-grained understanding of how learning processes may go awry in the aftermath of combat trauma.”
A current theory holds that during a traumatic event, a person may learn to associate the people, locations, and objects in the situation with the trauma, and long after the event even the “safe” stimuli can trigger fearful and defensive responses. Experts believe it is an “overlearned response” to a threatening experience. But the way in which that learning happens is not well understood, say researchers from Yale University in New Haven, Connecticut, and the Icahn School of Medicine at Mount Sinai in New York City. Their study, though, may shed new light on how people with PTSD symptoms learn and unlearn fear.
In the study, funded in part by the National Institute of Mental Health, the researchers examined how the mental adjustments performed during learning and the way the brain tracks these adjustments relate to symptom severity.
They gave combat veterans with varying levels of PTSD symptom severity a reversal learning task. Participants were shown 2 mildly angry human faces and mildly shocked after viewing 1 face, but not the other. Then the task was reversed, with the aim of having the participants “unlearn” their original fear conditioning and testing their ability to relearn how to respond to negative surprises in the environment.
Although all participants were able to perform the reversal learning, the researchers found “pronounced differences in the ‘learning rates.’” Highly symptomatic veterans tended to overreact when what they expected to happen and what actually happened did not match up.
The researchers say they found biomarkers that could explain the different reactions. In the highly symptomatic veterans, 2 areas of the brain—the amygdala and striatum—were less able to track changes in threat level.
“One’s inability to adequately adjust expectations for potentially aversive outcomes has potential clinical relevance,” said Ilan Harpaz-Rotem, PhD, co-leader of the study, “as this deficit may lead to avoidance and depressive behavior.”
The researchers say their findings could give a “more fine-grained understanding of how learning processes may go awry in the aftermath of combat trauma.”
Crisis Communication for Multilingual Communities
Civil rights laws mandate that federally funded emergency response and recovery services must be accessible to all Americans. But at least 350 languages are spoken in the US, according to the US Census Bureau. And millions of people have hearing or vision problems or cannot read.
Recent devastating fires, hurricanes, and earthquakes have underscored the need for clear communication in disasters. Now the US Department of Health and Human Services (HHS) has unveiled a “plain language checklist” to help first responders make sure important information is shared.
The checklist, developed through the HHS Language Access Steering Committee, complements an emergency preparedness checklist released in 2016. It includes recommendations, action steps, and resources to help first responders provide on-the-ground language assistance. For example, a key recommendation is to not only identify languages and dialects spoken in the community, but specific types of sign language as well. The action steps include accessing state and local demographic data and identifying public spaces that serve people lacking English proficiency, such as libraries that offer language access resources.
The checklist also provides practical tips for working with interpreters, such as speaking directly in the first person to the individual (not the interpreter), avoiding idioms, acronyms, and double negatives. Red flags include interpreters who need repeated clarifications, who overuse English terms, and whose interpretations seem overly long or short compared with the statements being interpreted.
The HHS also recommends:
- Working with Centers for Independent Living and other groups who work with people with disabilities;
- Identifying local partners, such as hospitals, faith-based organizations, and legal services; and
- Coordinating with TV, print, radio, and online media to share plain-language, culturally appropriate emergency information.
The checklist is available at https://www.hhs.gov/about/news/2018/12/04/new-hhs-checklist-helps-first-responders-ensure-language-access-and-effective-communication-during-emergencies.html
Civil rights laws mandate that federally funded emergency response and recovery services must be accessible to all Americans. But at least 350 languages are spoken in the US, according to the US Census Bureau. And millions of people have hearing or vision problems or cannot read.
Recent devastating fires, hurricanes, and earthquakes have underscored the need for clear communication in disasters. Now the US Department of Health and Human Services (HHS) has unveiled a “plain language checklist” to help first responders make sure important information is shared.
The checklist, developed through the HHS Language Access Steering Committee, complements an emergency preparedness checklist released in 2016. It includes recommendations, action steps, and resources to help first responders provide on-the-ground language assistance. For example, a key recommendation is to not only identify languages and dialects spoken in the community, but specific types of sign language as well. The action steps include accessing state and local demographic data and identifying public spaces that serve people lacking English proficiency, such as libraries that offer language access resources.
The checklist also provides practical tips for working with interpreters, such as speaking directly in the first person to the individual (not the interpreter), avoiding idioms, acronyms, and double negatives. Red flags include interpreters who need repeated clarifications, who overuse English terms, and whose interpretations seem overly long or short compared with the statements being interpreted.
The HHS also recommends:
- Working with Centers for Independent Living and other groups who work with people with disabilities;
- Identifying local partners, such as hospitals, faith-based organizations, and legal services; and
- Coordinating with TV, print, radio, and online media to share plain-language, culturally appropriate emergency information.
The checklist is available at https://www.hhs.gov/about/news/2018/12/04/new-hhs-checklist-helps-first-responders-ensure-language-access-and-effective-communication-during-emergencies.html
Civil rights laws mandate that federally funded emergency response and recovery services must be accessible to all Americans. But at least 350 languages are spoken in the US, according to the US Census Bureau. And millions of people have hearing or vision problems or cannot read.
Recent devastating fires, hurricanes, and earthquakes have underscored the need for clear communication in disasters. Now the US Department of Health and Human Services (HHS) has unveiled a “plain language checklist” to help first responders make sure important information is shared.
The checklist, developed through the HHS Language Access Steering Committee, complements an emergency preparedness checklist released in 2016. It includes recommendations, action steps, and resources to help first responders provide on-the-ground language assistance. For example, a key recommendation is to not only identify languages and dialects spoken in the community, but specific types of sign language as well. The action steps include accessing state and local demographic data and identifying public spaces that serve people lacking English proficiency, such as libraries that offer language access resources.
The checklist also provides practical tips for working with interpreters, such as speaking directly in the first person to the individual (not the interpreter), avoiding idioms, acronyms, and double negatives. Red flags include interpreters who need repeated clarifications, who overuse English terms, and whose interpretations seem overly long or short compared with the statements being interpreted.
The HHS also recommends:
- Working with Centers for Independent Living and other groups who work with people with disabilities;
- Identifying local partners, such as hospitals, faith-based organizations, and legal services; and
- Coordinating with TV, print, radio, and online media to share plain-language, culturally appropriate emergency information.
The checklist is available at https://www.hhs.gov/about/news/2018/12/04/new-hhs-checklist-helps-first-responders-ensure-language-access-and-effective-communication-during-emergencies.html
Bag-mask ventilation during intubation reduces severe hypoxemia
, according to data presented at the Critical Care Congress, sponsored by the Society of Critical Care Medicine.
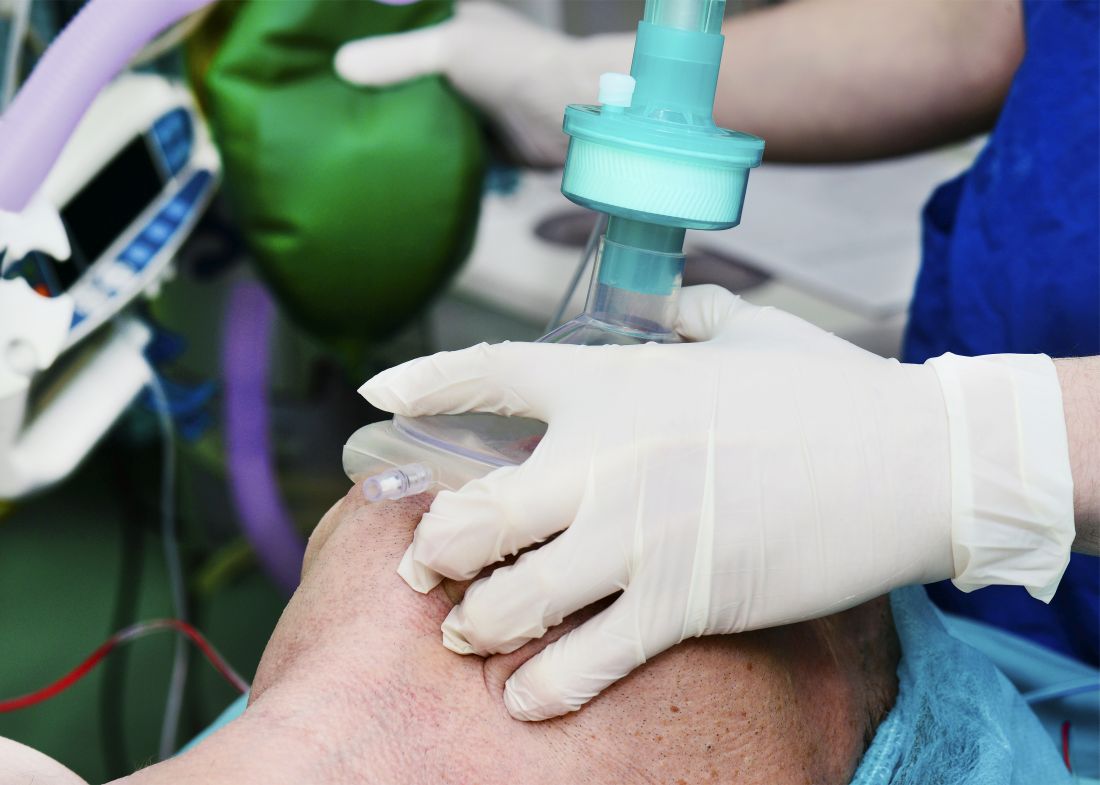
A multicenter study, published simultaneously in the Feb. 18 issue of the New England Journal of Medicine, randomized 401 critically-ill patients in the ICU who were undergoing tracheal intubation to receive either ventilation with a bag-mask device during induction for intubation or no ventilation.
The median lowest oxygen saturation between induction and 2 minutes after intubation was 96% in the bag-mask ventilated patients and 93% in the no-ventilation group, representing a 4.7% difference after adjusting for prespecified covariates (P = .01).
In a post-hoc analysis that adjusted for other factors such as the provision of preoxygenation, the preoxygenation device, pneumonia, and gastrointestinal bleeding, there was a 5.2% difference between the two groups in median lowest oxygen saturation, favoring the bag-mask group.
Bag-mask ventilation was also associated with almost a halving in the incidence of severe hypoxemia – defined as an oxygen saturation below 80% – compared with no-ventilation (10.9% vs. 22.8%; relative risk = 0.48). There was also a lower incidence of patients with an oxygen saturation below 90% and below 70% in the bag-mask ventilation group, compared with the no-ventilation group.
Overall, the median decrease in oxygen saturation from induction to the lowest point was 1% in the bag-mask group, and 5% in the no-ventilation group.
The study saw no effects of factors such as body-mass index, operator experience, or Acute Physiology and Chronic Health Evaluation (APACHE II) score. The patients had a median age of 60 years, about half had sepsis or septic shock, and close to 60% had hypoxemic respiratory failure as an indication for tracheal intubation.
Jonathan D. Casey, MD, of Vanderbilt University, Nashville, Tenn., and his coauthors wrote that their results suggested for every nine critically ill patients undergoing tracheal intubation, bag-mask ventilation would prevent severe hypoxemia in one patient.
“These findings are important because oxygen saturation is an established endpoint in airway management trials and is a contributing factor to periprocedural cardiac arrest and death,” they wrote.
They noted that there are conflicting guidelines on the use of bag-mask ventilation during tracheal intubation, with some recommending its use for all patients – even those who are not hypoxemic – and others advising their use only for patients with hypoxemia. This study excluded patients who were identified as hypoxemic or in whom bag-mask ventilation was contraindicated.
Despite concerns about bag-mask ventilation increasing the risk the aspiration, the study showed no significant difference between the two groups in the incidence of operator-reported aspiration or the presence of a new opacity on chest radiograph in the 48 hours after intubation.
The authors acknowledged that, given the low incidence of operator-reported aspiration during tracheal intubation, a much larger study would be needed to show whether bag-mask ventilation did increase the risk of aspiration.
“However, our trial provides some reassurance, since the incidence of operator-reported aspiration was numerically lower in the bag-mask ventilation group than in the no-ventilation group,” they wrote.
There were also no significant differences between the two groups in oxygen saturation, fraction of inspired oxygen or positive end-expiratory pressure in the 24 hours after intubation. Bag-mask ventilation was also associated with similar rates of in-hospital mortality, number of ventilator-free days, and days out of the ICU as no-ventilation.
The authors noted that their trial focused on critically-ill patients in the ICU, so the results may not be generalizable to patients in the emergency department or in a prehospital setting.
The study and some authors were supported by the National Institutes of Health. Two authors declared personal fees from the pharmaceutical industry unrelated to the study, and no other conflicts of interest were declared.
SOURCE: Casey J et al. N Engl J Med. 2019 Feb 18. doi: 10.1056/NEJMoa1812405
Debate around the question of whether to use bag-mask ventilation in critically-ill patients has been limited by the lack of high-quality evidence on the risk of aspiration or on the benefits of this approach. This study found no evidence of an increase in the incidence of aspiration, despite using multiple measures to detect it, which provide some reassurance that manual ventilation during tracheal intubation is not likely to cause significant harm.
One significant limitation of this trial, however, is that it did not standardize the preoxygenation strategy across the two groups, so significantly more patients in the bag-mask group received bag-mask ventilation before induction. Median oxygen saturation before induction was the same in the two groups, but this does not rule out the possibility of differences in the arterial pressure of oxygen.
This study may not settle the question of whether to use bag-mask ventilation during tracheal intubation, but it provides strong suggestion that the practice is not harmful.
Patricia A. Kritek, MD, and Andrew M. Luks, MD, are with the division of pulmonary, critical care, and sleep medicine at the University of Washington in Seattle. These comments are adapted from their editorial accompanying the paper by Casey et al. (N Engl J Med. 2019 Feb 18. doi: 10.1056/NEJMe1900708). Dr. Luks declared personal fees from private industry outside the submitted work. Dr. Kritek reported having nothing to disclose.
Debate around the question of whether to use bag-mask ventilation in critically-ill patients has been limited by the lack of high-quality evidence on the risk of aspiration or on the benefits of this approach. This study found no evidence of an increase in the incidence of aspiration, despite using multiple measures to detect it, which provide some reassurance that manual ventilation during tracheal intubation is not likely to cause significant harm.
One significant limitation of this trial, however, is that it did not standardize the preoxygenation strategy across the two groups, so significantly more patients in the bag-mask group received bag-mask ventilation before induction. Median oxygen saturation before induction was the same in the two groups, but this does not rule out the possibility of differences in the arterial pressure of oxygen.
This study may not settle the question of whether to use bag-mask ventilation during tracheal intubation, but it provides strong suggestion that the practice is not harmful.
Patricia A. Kritek, MD, and Andrew M. Luks, MD, are with the division of pulmonary, critical care, and sleep medicine at the University of Washington in Seattle. These comments are adapted from their editorial accompanying the paper by Casey et al. (N Engl J Med. 2019 Feb 18. doi: 10.1056/NEJMe1900708). Dr. Luks declared personal fees from private industry outside the submitted work. Dr. Kritek reported having nothing to disclose.
Debate around the question of whether to use bag-mask ventilation in critically-ill patients has been limited by the lack of high-quality evidence on the risk of aspiration or on the benefits of this approach. This study found no evidence of an increase in the incidence of aspiration, despite using multiple measures to detect it, which provide some reassurance that manual ventilation during tracheal intubation is not likely to cause significant harm.
One significant limitation of this trial, however, is that it did not standardize the preoxygenation strategy across the two groups, so significantly more patients in the bag-mask group received bag-mask ventilation before induction. Median oxygen saturation before induction was the same in the two groups, but this does not rule out the possibility of differences in the arterial pressure of oxygen.
This study may not settle the question of whether to use bag-mask ventilation during tracheal intubation, but it provides strong suggestion that the practice is not harmful.
Patricia A. Kritek, MD, and Andrew M. Luks, MD, are with the division of pulmonary, critical care, and sleep medicine at the University of Washington in Seattle. These comments are adapted from their editorial accompanying the paper by Casey et al. (N Engl J Med. 2019 Feb 18. doi: 10.1056/NEJMe1900708). Dr. Luks declared personal fees from private industry outside the submitted work. Dr. Kritek reported having nothing to disclose.
, according to data presented at the Critical Care Congress, sponsored by the Society of Critical Care Medicine.
A multicenter study, published simultaneously in the Feb. 18 issue of the New England Journal of Medicine, randomized 401 critically-ill patients in the ICU who were undergoing tracheal intubation to receive either ventilation with a bag-mask device during induction for intubation or no ventilation.
The median lowest oxygen saturation between induction and 2 minutes after intubation was 96% in the bag-mask ventilated patients and 93% in the no-ventilation group, representing a 4.7% difference after adjusting for prespecified covariates (P = .01).
In a post-hoc analysis that adjusted for other factors such as the provision of preoxygenation, the preoxygenation device, pneumonia, and gastrointestinal bleeding, there was a 5.2% difference between the two groups in median lowest oxygen saturation, favoring the bag-mask group.
Bag-mask ventilation was also associated with almost a halving in the incidence of severe hypoxemia – defined as an oxygen saturation below 80% – compared with no-ventilation (10.9% vs. 22.8%; relative risk = 0.48). There was also a lower incidence of patients with an oxygen saturation below 90% and below 70% in the bag-mask ventilation group, compared with the no-ventilation group.
Overall, the median decrease in oxygen saturation from induction to the lowest point was 1% in the bag-mask group, and 5% in the no-ventilation group.
The study saw no effects of factors such as body-mass index, operator experience, or Acute Physiology and Chronic Health Evaluation (APACHE II) score. The patients had a median age of 60 years, about half had sepsis or septic shock, and close to 60% had hypoxemic respiratory failure as an indication for tracheal intubation.
Jonathan D. Casey, MD, of Vanderbilt University, Nashville, Tenn., and his coauthors wrote that their results suggested for every nine critically ill patients undergoing tracheal intubation, bag-mask ventilation would prevent severe hypoxemia in one patient.
“These findings are important because oxygen saturation is an established endpoint in airway management trials and is a contributing factor to periprocedural cardiac arrest and death,” they wrote.
They noted that there are conflicting guidelines on the use of bag-mask ventilation during tracheal intubation, with some recommending its use for all patients – even those who are not hypoxemic – and others advising their use only for patients with hypoxemia. This study excluded patients who were identified as hypoxemic or in whom bag-mask ventilation was contraindicated.
Despite concerns about bag-mask ventilation increasing the risk the aspiration, the study showed no significant difference between the two groups in the incidence of operator-reported aspiration or the presence of a new opacity on chest radiograph in the 48 hours after intubation.
The authors acknowledged that, given the low incidence of operator-reported aspiration during tracheal intubation, a much larger study would be needed to show whether bag-mask ventilation did increase the risk of aspiration.
“However, our trial provides some reassurance, since the incidence of operator-reported aspiration was numerically lower in the bag-mask ventilation group than in the no-ventilation group,” they wrote.
There were also no significant differences between the two groups in oxygen saturation, fraction of inspired oxygen or positive end-expiratory pressure in the 24 hours after intubation. Bag-mask ventilation was also associated with similar rates of in-hospital mortality, number of ventilator-free days, and days out of the ICU as no-ventilation.
The authors noted that their trial focused on critically-ill patients in the ICU, so the results may not be generalizable to patients in the emergency department or in a prehospital setting.
The study and some authors were supported by the National Institutes of Health. Two authors declared personal fees from the pharmaceutical industry unrelated to the study, and no other conflicts of interest were declared.
SOURCE: Casey J et al. N Engl J Med. 2019 Feb 18. doi: 10.1056/NEJMoa1812405
, according to data presented at the Critical Care Congress, sponsored by the Society of Critical Care Medicine.
A multicenter study, published simultaneously in the Feb. 18 issue of the New England Journal of Medicine, randomized 401 critically-ill patients in the ICU who were undergoing tracheal intubation to receive either ventilation with a bag-mask device during induction for intubation or no ventilation.
The median lowest oxygen saturation between induction and 2 minutes after intubation was 96% in the bag-mask ventilated patients and 93% in the no-ventilation group, representing a 4.7% difference after adjusting for prespecified covariates (P = .01).
In a post-hoc analysis that adjusted for other factors such as the provision of preoxygenation, the preoxygenation device, pneumonia, and gastrointestinal bleeding, there was a 5.2% difference between the two groups in median lowest oxygen saturation, favoring the bag-mask group.
Bag-mask ventilation was also associated with almost a halving in the incidence of severe hypoxemia – defined as an oxygen saturation below 80% – compared with no-ventilation (10.9% vs. 22.8%; relative risk = 0.48). There was also a lower incidence of patients with an oxygen saturation below 90% and below 70% in the bag-mask ventilation group, compared with the no-ventilation group.
Overall, the median decrease in oxygen saturation from induction to the lowest point was 1% in the bag-mask group, and 5% in the no-ventilation group.
The study saw no effects of factors such as body-mass index, operator experience, or Acute Physiology and Chronic Health Evaluation (APACHE II) score. The patients had a median age of 60 years, about half had sepsis or septic shock, and close to 60% had hypoxemic respiratory failure as an indication for tracheal intubation.
Jonathan D. Casey, MD, of Vanderbilt University, Nashville, Tenn., and his coauthors wrote that their results suggested for every nine critically ill patients undergoing tracheal intubation, bag-mask ventilation would prevent severe hypoxemia in one patient.
“These findings are important because oxygen saturation is an established endpoint in airway management trials and is a contributing factor to periprocedural cardiac arrest and death,” they wrote.
They noted that there are conflicting guidelines on the use of bag-mask ventilation during tracheal intubation, with some recommending its use for all patients – even those who are not hypoxemic – and others advising their use only for patients with hypoxemia. This study excluded patients who were identified as hypoxemic or in whom bag-mask ventilation was contraindicated.
Despite concerns about bag-mask ventilation increasing the risk the aspiration, the study showed no significant difference between the two groups in the incidence of operator-reported aspiration or the presence of a new opacity on chest radiograph in the 48 hours after intubation.
The authors acknowledged that, given the low incidence of operator-reported aspiration during tracheal intubation, a much larger study would be needed to show whether bag-mask ventilation did increase the risk of aspiration.
“However, our trial provides some reassurance, since the incidence of operator-reported aspiration was numerically lower in the bag-mask ventilation group than in the no-ventilation group,” they wrote.
There were also no significant differences between the two groups in oxygen saturation, fraction of inspired oxygen or positive end-expiratory pressure in the 24 hours after intubation. Bag-mask ventilation was also associated with similar rates of in-hospital mortality, number of ventilator-free days, and days out of the ICU as no-ventilation.
The authors noted that their trial focused on critically-ill patients in the ICU, so the results may not be generalizable to patients in the emergency department or in a prehospital setting.
The study and some authors were supported by the National Institutes of Health. Two authors declared personal fees from the pharmaceutical industry unrelated to the study, and no other conflicts of interest were declared.
SOURCE: Casey J et al. N Engl J Med. 2019 Feb 18. doi: 10.1056/NEJMoa1812405
FROM CCC48
Key clinical point: Bag-mask ventilation during tracheal intubation reduces the risk of severe hypoxemia.
Major finding: For every nine patients who receive bag-mask ventilation during tracheal intubation, one case of severe hypoxemia is avoided.
Study details: Randomized, controlled trial in 401 critically-ill patients undergoing tracheal intubation.
Disclosures: The study and some authors were supported by the National Institutes of Health. Two authors declared personal fees from the pharmaceutical industry unrelated to the study.
Source: Casey J et al. N Engl J Med. 2019 Feb 18. doi: 10.1056/NEJMoa1812405
Flu season showing its staying power
Like an unwelcome guest, the 2018-2019 flu season seems to be settling in for a lengthy stay as three more states have reached the highest level of influenza-like illness (ILI) activity, according to the Centers for Disease Control and Prevention.
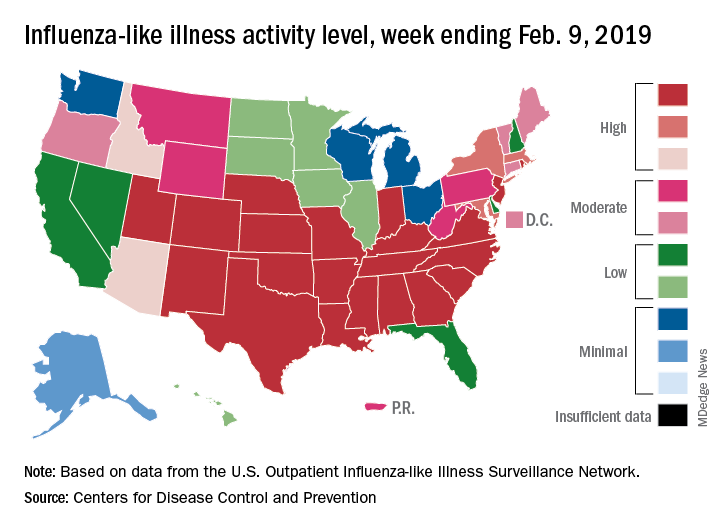
There are now 21 states at level 10 on the CDC’s 1-10 scale, with the South showing up almost solidly red on the flu activity map for the week ending Feb. 9. Another five states are at levels 8 and 9, bringing the total in the high range to 26 for the week, compared with 24 the previous week, the CDC’s influenza division reported Feb. 15.
National activity, reflected in the proportion of outpatient visits involving ILI, took a step up from 4.3% the week before to 4.8% for the week ending Feb. 9. The national baseline rate is 2.2% for ILI, which the CDC defines “as fever (temperature of 100°F [37.8°C] or greater) and cough and/or sore throat.”
Two flu-related pediatric deaths occurred during the week ending Feb. 9, and another four were reported from earlier weeks, which brings the total for the 2018-2019 season to 34, the CDC said. At the same point in last year’s flu season, there had been 84 flu-related deaths in children.
In a separate report, the CDC said that, based on data collected from Nov. 23, 2018 to Feb. 2, 2019, “the influenza vaccine has been 47% effective in preventing medically attended acute respiratory virus infection across all age groups and specifically was 46% effective in preventing medical visits associated with influenza A(H1N1)pdm09.” The effectiveness of the vaccine was 61% for children aged 6 months to 17 years, the CDC said (MMWR. 2019 Feb 15;68[6];135-9).
Flu vaccination during the 2017-2018 season prevented 7.1 million illnesses, 3.7 million medical visits, 109,000 hospitalizations, and 8,000 flu-related deaths, the CDC said, adding that “vaccination has been found to reduce deaths, intensive care unit admissions and length of stay, and overall duration of hospitalization among hospitalized influenza patients.”
Forecasts for the rest of the 2018-2019 season “predict that elevated influenza activity in parts of the United States will continue for several more weeks,” the CDC said.
Like an unwelcome guest, the 2018-2019 flu season seems to be settling in for a lengthy stay as three more states have reached the highest level of influenza-like illness (ILI) activity, according to the Centers for Disease Control and Prevention.
There are now 21 states at level 10 on the CDC’s 1-10 scale, with the South showing up almost solidly red on the flu activity map for the week ending Feb. 9. Another five states are at levels 8 and 9, bringing the total in the high range to 26 for the week, compared with 24 the previous week, the CDC’s influenza division reported Feb. 15.
National activity, reflected in the proportion of outpatient visits involving ILI, took a step up from 4.3% the week before to 4.8% for the week ending Feb. 9. The national baseline rate is 2.2% for ILI, which the CDC defines “as fever (temperature of 100°F [37.8°C] or greater) and cough and/or sore throat.”
Two flu-related pediatric deaths occurred during the week ending Feb. 9, and another four were reported from earlier weeks, which brings the total for the 2018-2019 season to 34, the CDC said. At the same point in last year’s flu season, there had been 84 flu-related deaths in children.
In a separate report, the CDC said that, based on data collected from Nov. 23, 2018 to Feb. 2, 2019, “the influenza vaccine has been 47% effective in preventing medically attended acute respiratory virus infection across all age groups and specifically was 46% effective in preventing medical visits associated with influenza A(H1N1)pdm09.” The effectiveness of the vaccine was 61% for children aged 6 months to 17 years, the CDC said (MMWR. 2019 Feb 15;68[6];135-9).
Flu vaccination during the 2017-2018 season prevented 7.1 million illnesses, 3.7 million medical visits, 109,000 hospitalizations, and 8,000 flu-related deaths, the CDC said, adding that “vaccination has been found to reduce deaths, intensive care unit admissions and length of stay, and overall duration of hospitalization among hospitalized influenza patients.”
Forecasts for the rest of the 2018-2019 season “predict that elevated influenza activity in parts of the United States will continue for several more weeks,” the CDC said.
Like an unwelcome guest, the 2018-2019 flu season seems to be settling in for a lengthy stay as three more states have reached the highest level of influenza-like illness (ILI) activity, according to the Centers for Disease Control and Prevention.
There are now 21 states at level 10 on the CDC’s 1-10 scale, with the South showing up almost solidly red on the flu activity map for the week ending Feb. 9. Another five states are at levels 8 and 9, bringing the total in the high range to 26 for the week, compared with 24 the previous week, the CDC’s influenza division reported Feb. 15.
National activity, reflected in the proportion of outpatient visits involving ILI, took a step up from 4.3% the week before to 4.8% for the week ending Feb. 9. The national baseline rate is 2.2% for ILI, which the CDC defines “as fever (temperature of 100°F [37.8°C] or greater) and cough and/or sore throat.”
Two flu-related pediatric deaths occurred during the week ending Feb. 9, and another four were reported from earlier weeks, which brings the total for the 2018-2019 season to 34, the CDC said. At the same point in last year’s flu season, there had been 84 flu-related deaths in children.
In a separate report, the CDC said that, based on data collected from Nov. 23, 2018 to Feb. 2, 2019, “the influenza vaccine has been 47% effective in preventing medically attended acute respiratory virus infection across all age groups and specifically was 46% effective in preventing medical visits associated with influenza A(H1N1)pdm09.” The effectiveness of the vaccine was 61% for children aged 6 months to 17 years, the CDC said (MMWR. 2019 Feb 15;68[6];135-9).
Flu vaccination during the 2017-2018 season prevented 7.1 million illnesses, 3.7 million medical visits, 109,000 hospitalizations, and 8,000 flu-related deaths, the CDC said, adding that “vaccination has been found to reduce deaths, intensive care unit admissions and length of stay, and overall duration of hospitalization among hospitalized influenza patients.”
Forecasts for the rest of the 2018-2019 season “predict that elevated influenza activity in parts of the United States will continue for several more weeks,” the CDC said.