User login
CAR T therapy to enter early testing in multiple myeloma
Janssen Biotech is launching a phase 1b/2 trial of an .
The trial, which was cleared by the Food and Drug Administration to begin in the second half of 2018, will evaluate the safety and efficacy of LCAR-B38M (JNJ-68284528). The CAR T therapy targets B-cell Maturation Antigen and expresses a CAR protein that is identical to a product that was developed by Legend Biotech and evaluated in a first-in-human clinical study in China.
The drug is being developed as part of a collaboration between Legend Biotech and Janssen Biotech.
Does Age of Exposure to Tackle Football Affect CTE Severity?
Younger age of exposure to tackle football is not associated with chronic traumatic encephalopathy (CTE) pathologic severity, Alzheimer’s disease pathology, or Lewy body pathology, according to data published online ahead of print April 30 in Annals of Neurology. Younger age of exposure does appear to predict earlier neurobehavioral symptom onset, however, the authors said.

“These findings suggest that exposure to repetitive head impacts from tackle football as a youth may reduce resiliency to diseases, including, but not limited to, CTE, that affect the brain in later life,” said Michael L. Alosco, PhD, Assistant Professor of Neurology at the the Boston University Alzheimer’s Disease and CTE Center. “This study adds to growing research suggesting that incurring repeated head impacts through tackle football in earlier life can lead to both short-term and long-term effects on the brain.”
Repetitive Head Impacts and Neurodevelopment
Previous research has linked younger age of first exposure to tackle football with smaller thalamic volume in former National Football League players. A recent study of 214 former and amateur football players found that age of first exposure to tackle football—before age 12, in particular—predicted increased odds of self-reported neuropsychiatric and executive impairment.
“Youth exposure to repetitive head impacts may disrupt neurodevelopment to lower the threshold for later clinical dysfunction,” said the researchers.
To examine the effect of age of first exposure to tackle football on CTE pathologic severity and age of neurobehavioral symptom onset in tackle football players with neuropathologically confirmed CTE, Dr. Alosco and colleagues analyzed a sample of 246 amateur and professional tackle football players whose brains had been donated to the Veteran’s Affairs–Boston University–Concussion Legacy Foundation Brain Bank. The researchers interviewed informants to ascertain players’ age of first exposure and age of onset of cognitive, behavioral, or mood symptoms. A total of 211 football players were diagnosed with CTE; 35 did not have CTE. Of the 211 participants with CTE, 126 had CTE only, and the other participants had comorbid neurodegenerative diseases.
Onset of Cognitive, Behavioral, and Mood Symptoms
Of the 211 participants with CTE, 183 developed cognitive and behavioral or mood symptoms prior to death, eight had only cognitive symptoms, 12 had only behavioral or mood symptoms, and seven did not endorse any symptoms examined in the study. Clinical data for one participant were not available.
Among tackle football players with CTE, every one year younger that they began to play tackle football predicted earlier onset of cognitive symptoms by 2.44 years and of behavioral or mood symptoms by 2.50 years. Exposure before age 12 predicted earlier cognitive and behavioral or mood symptom onset by 13.39 years and 13.28 years, respectively.
Secondary subset analyses indicated that younger age of exposure to tackle football was associated with earlier onset of functional impairment in participants who were determined to have had dementia. Researchers observed nearly identical effects in participants with CTE only.
Study limitations include the lack of an appropriate control or comparison group, the researchers noted. In addition, the results may not be generalizable to a broader tackle football population.
“Given the growing public health concerns for participation in tackle football, prospective studies of former tackle football players that include objective clinical assessments are needed to better understand the relationship between youth tackle football exposure and long-term neurobehavioral outcomes,” said the researchers.
“More research on this topic is needed before any clinical recommendations, as well as recommendations on policy or rule changes, can be made,” said Dr. Alosco.
“Boston University and sites across the country are currently conducting longitudinal studies on former football players, which will allow us to begin to study cognition and behavior and mood functioning over time.”
—Erica Tricarico
Suggested Reading
Alosco ML, Mez J, Tripodis Y, et al. Age of first exposure to tackle football and chronic traumatic encephalopathy. Ann Neurol. 2018 Apr 30 [Epub ahead of print].
Younger age of exposure to tackle football is not associated with chronic traumatic encephalopathy (CTE) pathologic severity, Alzheimer’s disease pathology, or Lewy body pathology, according to data published online ahead of print April 30 in Annals of Neurology. Younger age of exposure does appear to predict earlier neurobehavioral symptom onset, however, the authors said.
“These findings suggest that exposure to repetitive head impacts from tackle football as a youth may reduce resiliency to diseases, including, but not limited to, CTE, that affect the brain in later life,” said Michael L. Alosco, PhD, Assistant Professor of Neurology at the the Boston University Alzheimer’s Disease and CTE Center. “This study adds to growing research suggesting that incurring repeated head impacts through tackle football in earlier life can lead to both short-term and long-term effects on the brain.”
Repetitive Head Impacts and Neurodevelopment
Previous research has linked younger age of first exposure to tackle football with smaller thalamic volume in former National Football League players. A recent study of 214 former and amateur football players found that age of first exposure to tackle football—before age 12, in particular—predicted increased odds of self-reported neuropsychiatric and executive impairment.
“Youth exposure to repetitive head impacts may disrupt neurodevelopment to lower the threshold for later clinical dysfunction,” said the researchers.
To examine the effect of age of first exposure to tackle football on CTE pathologic severity and age of neurobehavioral symptom onset in tackle football players with neuropathologically confirmed CTE, Dr. Alosco and colleagues analyzed a sample of 246 amateur and professional tackle football players whose brains had been donated to the Veteran’s Affairs–Boston University–Concussion Legacy Foundation Brain Bank. The researchers interviewed informants to ascertain players’ age of first exposure and age of onset of cognitive, behavioral, or mood symptoms. A total of 211 football players were diagnosed with CTE; 35 did not have CTE. Of the 211 participants with CTE, 126 had CTE only, and the other participants had comorbid neurodegenerative diseases.
Onset of Cognitive, Behavioral, and Mood Symptoms
Of the 211 participants with CTE, 183 developed cognitive and behavioral or mood symptoms prior to death, eight had only cognitive symptoms, 12 had only behavioral or mood symptoms, and seven did not endorse any symptoms examined in the study. Clinical data for one participant were not available.
Among tackle football players with CTE, every one year younger that they began to play tackle football predicted earlier onset of cognitive symptoms by 2.44 years and of behavioral or mood symptoms by 2.50 years. Exposure before age 12 predicted earlier cognitive and behavioral or mood symptom onset by 13.39 years and 13.28 years, respectively.
Secondary subset analyses indicated that younger age of exposure to tackle football was associated with earlier onset of functional impairment in participants who were determined to have had dementia. Researchers observed nearly identical effects in participants with CTE only.
Study limitations include the lack of an appropriate control or comparison group, the researchers noted. In addition, the results may not be generalizable to a broader tackle football population.
“Given the growing public health concerns for participation in tackle football, prospective studies of former tackle football players that include objective clinical assessments are needed to better understand the relationship between youth tackle football exposure and long-term neurobehavioral outcomes,” said the researchers.
“More research on this topic is needed before any clinical recommendations, as well as recommendations on policy or rule changes, can be made,” said Dr. Alosco.
“Boston University and sites across the country are currently conducting longitudinal studies on former football players, which will allow us to begin to study cognition and behavior and mood functioning over time.”
—Erica Tricarico
Suggested Reading
Alosco ML, Mez J, Tripodis Y, et al. Age of first exposure to tackle football and chronic traumatic encephalopathy. Ann Neurol. 2018 Apr 30 [Epub ahead of print].
Retinal Changes Indicate Parkinson’s Disease Pathology Severity
The accumulation of phosphorylated α-synuclein in the retina may serve as a biomarker of brain pathology severity and aid in diagnosis and monitoring of Parkinson’s disease, according to data published online ahead of print May 8 in Movement Disorders.
“These data suggest that phosphorylated α-synuclein accumulates in the retina in parallel with that in the brain, including in early stages preceding development of clinical signs of parkinsonism or dementia,” said Nicolás Cuenca, PhD, Assistant Professor of Physiology, Genetics, and Microbiology at the University of Alicante in Spain, and colleagues.

Parkinson’s disease pathology is mainly characterized by the accumulation of pathologic α-synuclein deposits in the brain, but little is known about how synucleinopathy affects the retina.
Dr. Cuenca and colleagues used immunohistochemistry to evaluate the presence of phosphorylated α-synuclein deposits in the retina of nine autopsied subjects with Parkinson’s disease, four with incidental Lewy body disease, and six controls. Eligible subjects had motor parkinsonism, Lewy body pathology, and pigmented neuron loss in the substantia nigra at autopsy. For each subject, the researchers compared the amount of retinal synucleinopathy with indicators of brain disease severity.
All subjects with Parkinson’s disease and three subjects with incidental Lewy body disease had phosphorylated α-synuclein deposits in ganglion cell perikarya, dendrites, and axons. Some of the deposits resembled brain Lewy bodies and Lewy neurites. Cells that contained phosphorylated α-synuclein had different morphologies, soma sizes (ie, from 15 µm to 30 µm), dendritic lengths (ie, from 570 µm to 1,620 µm), and receptive fields. Control subjects did not show any phosphorylated α-synuclein immunoreactivity in their retinas, however.
The Lewy-type synucleinopathy density in the retina significantly correlated with Lewy-type synucleinopathy density in the brain, with the Unified Parkinson’s disease pathology stage, and with the motor subscale of the Unifed Parkinson’s Disease Rating Scale. Confirmation of disease by autopsy partly compensated for the small number of subjects, according to the authors.
“Further investigations of the eye in Parkinson’s disease are desirable, given that ocular structures are involved in the pathology of several neurodegenerative diseases,” said Dr. Cuenca and colleagues.
—Erica Tricarico
Suggested Reading
Ortuño-Lizarán I, Beach TG, Serrano GE, et al. Phosphorylated α-synuclein in the retina is a biomarker of Parkinson’s disease pathology severity. Mov Disord. 2018 May 8 [Epub ahead of print].
Ma LJ, Xu LL, Mao CJ, et al. Progressive changes in the retinal structure of patients with Parkinson’s disease. J Parkinsons Dis. 2018;8(1):85-92.
The accumulation of phosphorylated α-synuclein in the retina may serve as a biomarker of brain pathology severity and aid in diagnosis and monitoring of Parkinson’s disease, according to data published online ahead of print May 8 in Movement Disorders.
“These data suggest that phosphorylated α-synuclein accumulates in the retina in parallel with that in the brain, including in early stages preceding development of clinical signs of parkinsonism or dementia,” said Nicolás Cuenca, PhD, Assistant Professor of Physiology, Genetics, and Microbiology at the University of Alicante in Spain, and colleagues.
Parkinson’s disease pathology is mainly characterized by the accumulation of pathologic α-synuclein deposits in the brain, but little is known about how synucleinopathy affects the retina.
Dr. Cuenca and colleagues used immunohistochemistry to evaluate the presence of phosphorylated α-synuclein deposits in the retina of nine autopsied subjects with Parkinson’s disease, four with incidental Lewy body disease, and six controls. Eligible subjects had motor parkinsonism, Lewy body pathology, and pigmented neuron loss in the substantia nigra at autopsy. For each subject, the researchers compared the amount of retinal synucleinopathy with indicators of brain disease severity.
All subjects with Parkinson’s disease and three subjects with incidental Lewy body disease had phosphorylated α-synuclein deposits in ganglion cell perikarya, dendrites, and axons. Some of the deposits resembled brain Lewy bodies and Lewy neurites. Cells that contained phosphorylated α-synuclein had different morphologies, soma sizes (ie, from 15 µm to 30 µm), dendritic lengths (ie, from 570 µm to 1,620 µm), and receptive fields. Control subjects did not show any phosphorylated α-synuclein immunoreactivity in their retinas, however.
The Lewy-type synucleinopathy density in the retina significantly correlated with Lewy-type synucleinopathy density in the brain, with the Unified Parkinson’s disease pathology stage, and with the motor subscale of the Unifed Parkinson’s Disease Rating Scale. Confirmation of disease by autopsy partly compensated for the small number of subjects, according to the authors.
“Further investigations of the eye in Parkinson’s disease are desirable, given that ocular structures are involved in the pathology of several neurodegenerative diseases,” said Dr. Cuenca and colleagues.
—Erica Tricarico
Suggested Reading
Ortuño-Lizarán I, Beach TG, Serrano GE, et al. Phosphorylated α-synuclein in the retina is a biomarker of Parkinson’s disease pathology severity. Mov Disord. 2018 May 8 [Epub ahead of print].
Ma LJ, Xu LL, Mao CJ, et al. Progressive changes in the retinal structure of patients with Parkinson’s disease. J Parkinsons Dis. 2018;8(1):85-92.
Mild TBI May Increase Risk of Parkinson’s Disease Among Military Veterans
Among military veterans, mild traumatic brain injury (TBI) is associated with a 56% increased risk of developing Parkinson’s disease over 12 years of follow-up, according to data published online ahead of print April 18 in Neurology. Prior TBI also is associated with a diagnosis of Parkinson’s disease two years earlier than among controls.
“Our findings highlight the critical importance of unraveling mechanisms subserving the association between TBI and Parkinson’s disease to inform treatment and prevention of post-TBI Parkinson’s disease,” said Raquel C. Gardner, MD, Assistant Professor of Neurology at the University of California, San Francisco.
A Longitudinal Cohort Study
Every year, mild TBI affects an estimated 42 million people worldwide. It is especially common among athletes and military personnel and is a growing epidemic among the elderly. In 2008, the Institute of Medicine found sufficient evidence to suggest an association between moderate to severe TBI and a clinical diagnosis of Parkinson’s disease, but limited evidence for an association between mild TBI with loss of consciousness and a clinical diagnosis of Parkinson’s disease. One small case–control study assessed the risk of Parkinson’s disease following mild TBI among military veterans, but the results were inconclusive, said the authors.

Dr. Gardner and colleagues conducted a longitudinal cohort study to evaluate the risk of Parkinson’s disease following TBI, including mild TBI, among patients in the Veterans Health Administration (VHA). They analyzed data from three nationwide VHA health care system databases and identified patients with a diagnosis of TBI from October 2002 to September 2014. Participants were age 18 or older without Parkinson’s disease or dementia at baseline and were age-matched 1:1 to a random sample of patients without TBI.
Researchers defined moderate to severe TBI as a loss of consciousness for more than 30 minutes, alteration of consciousness for more than 24 hours, or amnesia for more than 24 hours. They defined mild TBI as loss of consciousness for zero to 30 minutes, alteration of consciousness for a moment to 24 hours, or amnesia for zero to 24 hours.
TBI exposure and severity were determined via detailed clinical assessments or ICD-9 codes using Department of Defense and Defense and Veterans Brain Injury Center criteria. Baseline comorbidities and incident Parkinson’s disease at more than one year post TBI were identified using ICD-9 codes. In addition, investigators used Cox proportional hazard models adjusted for demographics and medical and psychiatric comorbidities to assess risk of Parkinson’s disease after TBI.
Prior TBI Was Associated With Minority Status
A total of 325,870 patients were included in the study with an average age of 47.9 and an average follow-up of 4.6 years. In all, 1,462 patients were diagnosed with Parkinson’s disease during follow-up. After adjusting for age, sex, race, education, and other health conditions, the researchers found that patients with any severity of TBI had a 71% increased risk of Parkinson’s disease; participants with moderate to severe TBI had an 83% increased risk.
Overall, patients with prior TBI were diagnosed with Parkinson’s disease at a significantly younger age, had significantly higher prevalence of non-Hispanic black and Hispanic race or ethnicity, and had significantly higher prevalence of all medical and psychiatric comorbidities, compared with those without prior TBI.
“Given the growing evidence for several potentially modifiable risk factors for Parkinson’s disease, an important area for future research will be to determine whether improved management of specific highly prevalent comorbidities among TBI-exposed veterans may reduce risk of subsequent Parkinson’s disease,” said the researchers.
Strengths of this study include the use of physicians’ diagnosis of TBI and Parkinson’s disease, a longitudinal cohort design, and a large sample size. One of the study’s limitations was the use of ICD-9 codes for the diagnosis of TBI and Parkinson’s disease, which may have overlooked some cases, such as TBI with polytrauma or mild
—Erica Tricarico
Suggested Reading
Gardner RC, Byers AL, Barnes DE, et al. Mild TBI and risk of Parkinson disease: a chronic effects of neurotrauma consortium study. Neurology. 2018 Apr 18 [Epub ahead of print].
Among military veterans, mild traumatic brain injury (TBI) is associated with a 56% increased risk of developing Parkinson’s disease over 12 years of follow-up, according to data published online ahead of print April 18 in Neurology. Prior TBI also is associated with a diagnosis of Parkinson’s disease two years earlier than among controls.
“Our findings highlight the critical importance of unraveling mechanisms subserving the association between TBI and Parkinson’s disease to inform treatment and prevention of post-TBI Parkinson’s disease,” said Raquel C. Gardner, MD, Assistant Professor of Neurology at the University of California, San Francisco.
A Longitudinal Cohort Study
Every year, mild TBI affects an estimated 42 million people worldwide. It is especially common among athletes and military personnel and is a growing epidemic among the elderly. In 2008, the Institute of Medicine found sufficient evidence to suggest an association between moderate to severe TBI and a clinical diagnosis of Parkinson’s disease, but limited evidence for an association between mild TBI with loss of consciousness and a clinical diagnosis of Parkinson’s disease. One small case–control study assessed the risk of Parkinson’s disease following mild TBI among military veterans, but the results were inconclusive, said the authors.
Dr. Gardner and colleagues conducted a longitudinal cohort study to evaluate the risk of Parkinson’s disease following TBI, including mild TBI, among patients in the Veterans Health Administration (VHA). They analyzed data from three nationwide VHA health care system databases and identified patients with a diagnosis of TBI from October 2002 to September 2014. Participants were age 18 or older without Parkinson’s disease or dementia at baseline and were age-matched 1:1 to a random sample of patients without TBI.
Researchers defined moderate to severe TBI as a loss of consciousness for more than 30 minutes, alteration of consciousness for more than 24 hours, or amnesia for more than 24 hours. They defined mild TBI as loss of consciousness for zero to 30 minutes, alteration of consciousness for a moment to 24 hours, or amnesia for zero to 24 hours.
TBI exposure and severity were determined via detailed clinical assessments or ICD-9 codes using Department of Defense and Defense and Veterans Brain Injury Center criteria. Baseline comorbidities and incident Parkinson’s disease at more than one year post TBI were identified using ICD-9 codes. In addition, investigators used Cox proportional hazard models adjusted for demographics and medical and psychiatric comorbidities to assess risk of Parkinson’s disease after TBI.
Prior TBI Was Associated With Minority Status
A total of 325,870 patients were included in the study with an average age of 47.9 and an average follow-up of 4.6 years. In all, 1,462 patients were diagnosed with Parkinson’s disease during follow-up. After adjusting for age, sex, race, education, and other health conditions, the researchers found that patients with any severity of TBI had a 71% increased risk of Parkinson’s disease; participants with moderate to severe TBI had an 83% increased risk.
Overall, patients with prior TBI were diagnosed with Parkinson’s disease at a significantly younger age, had significantly higher prevalence of non-Hispanic black and Hispanic race or ethnicity, and had significantly higher prevalence of all medical and psychiatric comorbidities, compared with those without prior TBI.
“Given the growing evidence for several potentially modifiable risk factors for Parkinson’s disease, an important area for future research will be to determine whether improved management of specific highly prevalent comorbidities among TBI-exposed veterans may reduce risk of subsequent Parkinson’s disease,” said the researchers.
Strengths of this study include the use of physicians’ diagnosis of TBI and Parkinson’s disease, a longitudinal cohort design, and a large sample size. One of the study’s limitations was the use of ICD-9 codes for the diagnosis of TBI and Parkinson’s disease, which may have overlooked some cases, such as TBI with polytrauma or mild
—Erica Tricarico
Suggested Reading
Gardner RC, Byers AL, Barnes DE, et al. Mild TBI and risk of Parkinson disease: a chronic effects of neurotrauma consortium study. Neurology. 2018 Apr 18 [Epub ahead of print].
Older CLL and NHL patients are more vulnerable to toxicities
Older patients with chronic lymphocytic leukemia (CLL) and non-Hodgkin lymphoma (NHL) have an increased odds of experiencing treatment-related toxicities, even when treated with novel agents, according to findings reported in the Journal of Geriatric Oncology.
An analysis of 1,199 patients showed that CLL patients aged 65 years and older had significantly higher odds than younger patients of developing a grade three or four hematologic toxicity (adjusted odds ratio, 1.70; P = .009; 95% confidence interval, 1.57-1.84) or nonhematologic toxicity (OR, 1.47; P = .022; 95% CI, 1.39-1.55).
Investigators analyzed data obtained from the Alliance for Clinical Trials in Oncology to compare the incidence of toxicities between age groups. Of the 1,199 patients included in the analysis, 409 were 65 years of age or older, and 790 were younger than 65 years. Among these patients, 438 received only therapy with novel agents including biologic combinations, monoclonal antibodies, cell cycle inhibitors, chemoimmunotherapy, and immunomodulators, and 761 received novel agents in addition to chemotherapy.
Overall, 68% of CLL patients and 35% of NHL patients had at least one grade three or four hematologic toxicity, compared with 48% and 54% for nonhematologic toxicities, respectively.
Older CLL patients with at least one grade three or four toxicity in the first 3 months had similar overall survival (OS) and progression-free survival (PFS) as those without a toxicity. In contrast, older NHL patients with at least one grade three or four hematologic toxicity in the first 3 months had worse OS (HR, 3.14; P = .006; 95% CI, 2.25-4.39) and PFS (HR, 3.06; P = .011; 95% CI, 2.10-4.45) than patients without these toxicities. Nonhematologic toxicities were not significantly associated with survival outcomes for patients with NHL.
“The observed associations between hematologic toxicity and OS/PFS among older patients with NHL require further investigation,” the researchers wrote. “These findings could represent a direct effect of toxicity due to decreased physiologic reserve, decreased drug clearance, or an increased sensitivity of tissue to novel agents.”
The study was supported by a National Institutes of Health grant. Researchers reported relationships with Bartlett, KITE, Pfizer, Seattle Genetics, Roche-Genentech, Celgene, Pharmacyclics, and Gilead.
SOURCE: Tallarico M et al. J Geriatr Oncol. 2018 Apr 16. pii: S1879-4068(18)30131-0.
FROM THE JOURNAL OF GERIATRIC ONCOLOGY
Key clinical point:
Major finding: Older CLL patients had significantly higher odds of developing a grade three or four hematologic toxicity (adjusted odds ratio, 1.70; P = .009; 95% confidence interval, 1.57-1.84) or nonhematologic toxicity (OR, 1.47; P = .022; 95% CI 1.39-1.55).
Study details: An analysis of data from 1,199 CLL and NHL patients in the Alliance for Clinical Trials in Oncology.
Disclosures: The study was supported by a National Institutes of Health grant. Researchers reported relationships with Bartlett, KITE, Pfizer, Seattle Genetics, Roche-Genentech, Celgene, Pharmacyclics, and Gilead.
Source: Tallarico M et al. J Geriatr Oncol. 2018 Apr 16. pii: S1879-4068(18)30131-0.

Call for AVAHO Abstracts
The Association of VA Hematology/Oncology (AVAHO) is now accepting abstracts for its annual meeting, September 28-30, 2018 in Chicago, Illinois. Authors must submit abstracts electronically through the AVAHO website and adhere to the following stipulations:
- The abstract should not exceed 350 words, excluding the title;
- The title cannot exceed 20 words;
- At least 1 author must be a member of AVAHO;
- The copy should not include illustrations or bullet points; and
- All names of the contributing authors and their affiliated institutions must be provided.
All abstracts must be submitted by June 29, 2018. Accepted abstracts will be published by Federal Practitioner and mailed to AVAHO members. The abstracts also will be available at the conference for attendees. Click here for the 2016 and 2017 Abstracts.
More information on the submission process and abstract submission form can be found here.
Cancer Care Collaborative Approach to Optimize Clinical Care (FULL)
A collaboration between clinicians and industrial engineers resulted in significant improvements in cancer screening, the development of toolkits, and more efficient care for hepatocellular carcinoma and breast, colorectal, lung, head and neck, and prostate cancers.
Cancer is one of the most common causes of premature death and disability that requires long-term follow-up surveillance and oftentimes ongoing treatment for survivors that can lead to important health, psychosocial
Like other cancer treatment systems, the VA faces some challenges in timeliness, surveillance, and quality of the cancer care process.12-18 Although implementation of cancer patientcentered home care and other efforts were developed to improve delivery and efficiency of cancer care in VA and non-VA facilities, the patient continuum of care remains convoluted.2,19-23
In 2004, the Clinical Cancer Care Collaborative (C4), a national VA program, was launched to improve timeliness, quality, access improvement, efficiency, and the “sustainability and spread” of successful programs at the VA. This program included representatives throughout the VA and encompassed cancer care coordinators (clinical nurse navigators), advisory panels, and a multidisciplinary team of clinicians.
In 2009, the VA promoted the Cancer Care Collaborative (CCC) to focus on optimizing the timeliness and quality of colorectal, breast, lung, prostate, and hematologic cancer care throughout the VA health care system. The VA Office of Systems Redesign (SR) partnered with the VA-Center for Applied Systems Engineering (VA-CASE) Veteran Engineering Resource Center (VERC), including industrial engineers (IEs) to provide their expertise and support. The CCC provided a forum to develop teams; set aims; and map, measure, analyze, and implement changes to assure timely diagnosis and initiation of evidence-based treatment and subsequently sustain the practices that led to improvements in these areas.
The CCC structure was separated into 6 distinct support areas: (1) industrial/systems engineering support; (2) informatics and clinical application support; (3) development and dissemination of improvement resource guides; (4) real-time and rapid-cycle evaluation tools and approaches; (5) application of advanced operational systems engineering techniques, such as simulation and modeling to inform further system optimization; and (6) advisory panels focused on quality topics that were identified, developed, implemented, and evaluated by the participants with support from the CCC faculty.
Here the authors describe the framework of the CCC model developed by VA-CASE, demonstrate the performance improvement results of teams focusing on several types of cancer, and highlight the key indicators to best practices.
Methods
Figure 1 outlines the CCC 3-Phase Conceptual Model. Phase 1 included diagnosis (screening and symptoms); phase 2 included treatment (from diagnosis to beyond treatment); and phase 3 was designed for hub and spoke facilities where screening/diagnosis occurs in a smaller (spoke) facility and treatment occurs in the larger (hub) facility.
In the first phase, 18 facility-based teams were selected through an application and interview process and immediately applied SR to their team’s specific improvement projects, which included the following cancers: breast, colorectal, lung, and prostate.
In addition to the cancer types covered in the initial phase, phase 2 also included hepatocellular carcinoma (HCC) and head and neck cancers. National VHA Toolkits were products that developed from and for use in lung and colorectal cancers (CRCs) (phases 1 and 2). These were organized and disseminated throughout the entire VA, offering specific knowledge and tools that could be applied to improving cancer care. The toolkit included guidance documents, specific process examples, and items that could be downloaded into Microsoft SharePoint (Redmond, WA) for adaptation and use by VA facilities. The toolkit contents were primarily developed and/or identified by CCC participants and funded by the VA Office of Quality and Performance (OQP) and SR. The toolkits included links to the following resources for each cancer type in phase 2: quality indicators, tool tables, timeliness measures, understanding the continuum of care, and a resource entitled, “How Can the Quality Metrics Help Me?” (eAppendix 1, available at fedprac.com/AVAHO).
The phase 3 collaborative was designed for hub and spoke facilities by focusing on current state vs ideal state processes, communication patterns, and care coordination between the hub and spoke facilities. There were 10 facilities in which all teams focused on lung cancer. Each facility was made up of 1 hub and had the ability to send up to 8 participants (from either the hub or the spoke facility) to the CCC workgroup meetings. Participants were specialists, radiologists, primary care providers, pathologists, nurses, nurse practitioners, or physician assistants.
Conceptual Model Deployment
The deployment of the CCC 3-phase conceptual model was based on the Institute for Healthcare Improvement (IHI) Breakthrough Series Collaborative Model.24,25 Implementation was carried out over 3 phases (2005-2011) after proper teaching, coaching, and learning sessions (LS)
Each LS incorporated instruction in basic systems engineering and Lean Six Sigma principles (an approach to quality improvement that focuses on reducing waste and variability) with practical, health care-based examples, case studies, and immediate application of the VA-TAMMCS (vision/analyze, team/aim, map, measure, change, sustain) SR organizational framework (Figure 2), tools, and methodologies to the process under investigation.26 The VA-TAMMCS (eAppendix 2, available at fedprac.com/AVAHO)
The CCC encouraged joint facilitation. A SR clinical coach, a VERC IE, and participating facilities were required to work together intensively (mentor and support) for 10 to 12 months. The mix of clinicians and engineers helped the facilities by bringing in diverse perspectives, which led to better decisions in the improvement of cancer care.28 During the CCC, the IEs partnered with and supported clinicians, using Lean Six Sigma and SR tools and approaches to health care quality improvement to quickly make improvements in efficiency and quality (eAppendix 3a, 3b, and 3c, available at fedprac.com/AVAHO).26,29 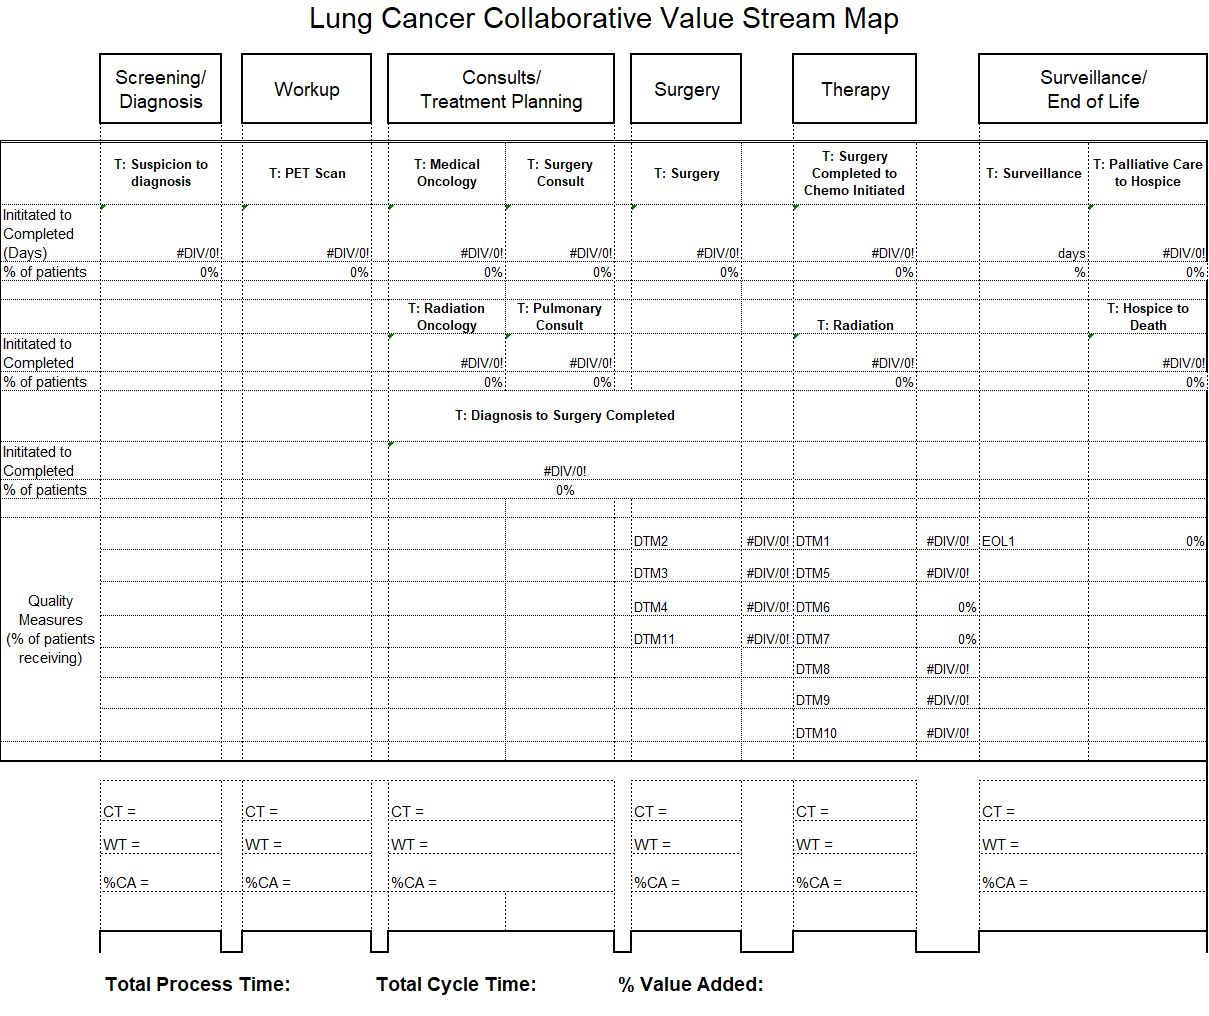
![]()
The IEs provided on-site support at all participating VAMCs during all 3 phases by providing the clinical teams with a variety of VA-TAMMCS process improvement tools to support the analysis and improvement of their organizations.
Data Collection
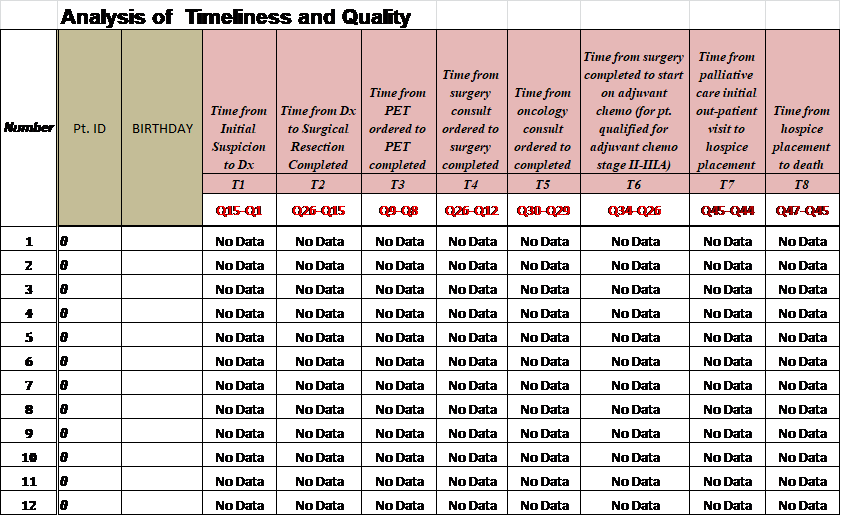
As part of the overall improvement process, the facilities worked on several aim statements in order to improve a primary constraint; such as timeliness and quality of care. An aim statement communicates what you want to do (eg, reduce, improve, or eliminate), by how much, and when. In order to improve timeliness, the CCC focused on measures from first evidence to tissue diagnosis, from diagnosis to treatment, and also intermediate measures, such as time from positron emission tomography scan ordered to completion. While working on overall quality of care unique to cancer, the CCC focused on measures related to documentation compliance and consistency of care provided to patients.
Phase 1
Facilities were to optimize their process (time from initial suspicion to diagnosis). Hence, participating facilities were allowed to simply identify their aim statement and pick and choose the area of focus.
Phases 2 and 3
Timeliness Aims. These aims were addressed through improvements in information technology in the Computerized Patient Record System (CPRS) electronic medical record by creating electronic order sets containing codes that alert providers daily to retrieve and follow up on abnormal test results. Primary care physicians and front desk staff also were educated on the use of these order sets and to schedule a follow-up test or specialist consult within 3 to 7 days.
Aim 1: Reduce to 15 days the time from initial suspicion to diagnosis within 1 year.
Aim 2: Reduce to 30 days the time from diagnosis to start of treatment within 1 year.
Quality Aim. Improve the compliance rate of identified quality indicators to 100% within 1 year.
Measurement Tools
The Cancer Care Measurement Tools were designed to support the OQP performance metric (Figure 3). The OQP creates and collects data on evidence-based national benchmarks to measure the quality of preventive and therapeutic health care services at the facility, VISN, and national levels. These metrics may be performance measures, performance monitors, quality indicators, and special studies, among other measures, to support clinicians, managers, and employees in improving care to veterans.
For each of the 3 CCC phases, VA-CASE IEs facilitated the development of standardized measurement and tracking tools for each cancer type. The tools identified key timeliness and quality measures as a function of entered patient data (eAppendixes 4-7, available at fedprac.com/AVAHO).
Quality Improvement Toolkit Series
The Quality Improvement Toolkit Series (QITS) was created for VA clinical managers and policy makers to improve diagnosis, treatment, and patient outcomes for high-priority conditions. The goal of the QITS is to serve as the cancer care improvement resource guide to produce and disseminate the National Quality Improvement Toolkit resource.
Each tool included in the QITS is matched to 1 or more metrics of the OQP (such as a performance measure or quality indicator). For example, the types of tools include CPRS order sets and templates, enhanced registries and patient databases, service agreements, and care process flow maps. Each toolkit served as a resource for improving facility performance on a specific set of established performance measures and/or quality indicators. Toolkits that helped VA facilities improve performance on OQP quality indicators and performance measures were based on the VA-TAMMCS model and continuous improvement that was tailored to the structure and needs of the VA system. The VA-CASE staff provided guidance on the criteria for inclusion in the toolkits to promote best practice and quality in clinical practice. The criteria used by a condition-specific expert panel were based on whether or not it was (1) not already part of VA routine care nationwide; (2) can be matched to 1 or more VA quality metrics/indicators; and (3) currently in use at a health care facility (innovative VA colleagues nationwide and by non-VA health care organizations).
Evaluation
After each LS, VA CCC evaluation data were collected using standardized 5-point Likert scale questions.
Results
Industrial engineers provided > 1,200 days of on-site support across the 60 teams and built 63 flow maps and 47 customized tools based on the team’s requests throughout the implementation period. Throughout the 3-phase CCC, the IEs developed standardized measurement and tracking tools for each cancer type (lung, colorectal, prostate, head and neck, and HCC). Outcomes included the sharing of best practices that spread across programs (uploaded to the national QITS site, available only to VA employees); as well as enterprisewide development of the special interest group (eg, VHA survivorship), which led to a national survivorship toolkit.
The table illustrates the overall collaborative impact across the CCC. In phase 1, 78% of the 64 aims (breast, CRC, lung, prostate) were met at 18 facilities. In phase 2, 72% of the 94 aims (CRC; HCC; and head and neck, lung, and prostate cancers) were met at 21 facilities. In phase 3, 47% of the 64 aims for head and neck and lung cancer were met at 11 facilities. The difference in the percentage of aims met during each phase was due to the variations in complexity of cancer types as well as additional logistic barriers at each institution.
Discussion
Overall, the CCC had a positive impact that improved timeliness, accessibility, and quality of the cancer care process in participating VAMCs. The majority of VAMCs focused on optimizing the lung cancer care process in all the phases of the collaborative, given that lung cancer suspicion-to-treatment process is highly complex, requiring multiple departments to coordinate workup and care, leading to the greatest room for improvement.
Industrial engineers introduced a variety of approaches to improvement to the collaborative teams, and they were integral to the development of standardized measurement and tracking tools for each type of cancer, introducing advanced SR methods for specific aims and performing appropriate data analysis. The ability of the VA system to recognize where improvements were needed was complemented by the efforts of VA clinicians and administration with direction from VERC IEs and their toolkits. Improvements were made, sometimes decreasing time from diagnosis to treatment by 50%. The VA facilities were encouraged to sustain this improvement using the toolkits with continued data gathering and implementation. In phase 1, lung cancer improvements included (1) establishing the multidisciplinary clinic, multidisciplinary rounds, and improved communication among key service lines; (2) developing a database (measurement tool) to prospectively track all cancer patients; (3) scheduling weekly multidisciplinary meetings to provide a mechanism to rapidly review patients and triage to appropriate pathways in the treatment algorithm; and (4) increasing physician participation, including oncologists, surgeons, radiologists, and radiation oncologists, to identify methods and process
changes that could eliminate wasteful steps and improve access for expediting diagnosis and treatment of patients with lung cancer who require surgery, chemotherapy, and/or radiation. The overall impact on time from abnormal CT to lung cancer surgery was reduced by > 5 months from 180 to 20 days. Substantial improvements were made in timeliness and reliability in caring for veterans with lung cancer.12
Groundbreaking work and exceptional results continued in the second phase for lung cancer care. In addition, the creation of a prostate cancer care web-based clinical measurement tool helped to improve the ability to proactively manage patients. The tool included same-day scheduling of biopsy and urology appointments for veterans with possible prostate cancer and the development of a protocol for expedited high-risk patients with metastatic disease. Ultimately, the wait time from urology consult to diagnosis was cut from 96 to 46 days for veterans with prostate cancer (Figure 4).
Once the face-to-face CCC process was established, tested, refined, and replicated successfully, the virtual team proved to be a cost-effective model. The virtual team did not travel to LSs, a major source of expense, so a process was set in place for their participation in all other facets of the collaborative. This led to the pilot testing of national virtual collaboratives (eg, specialty and surgical care collaboratives).
The toolkits for lung and CRC (phases 1 and 2) were organized, standardized, and disseminated throughout the VA to provide specific knowledge and tools to improve cancer care. The content of toolkits was primarily developed and/or identified by CCC participants. Funding for the toolkits was secured by OQP and SR, which led to the creation of the integration and crosswalk documents (eAppendix 7, available at fedprac.com/AVAHO).
In phase 3, lung cancer care teams showed the most improvement among all 3 phases of the collaborative. Aims statements in lung cancer process showed an increased percentage of improvement in all phases. Weekly multidisciplinary meetings provided a mechanism to rapidly review patients and triage appropriate pathways in the treatment algorithm. Open communication among sites and disciplines was vital and increased participation by physicians to identify ways to expedite diagnosis and treatment of lung cancer. In addition to access and timeliness of care (accommodating patients’ preference for scheduling), the teams identified areas they deemed important for successful programs and developed advisory panels that focused on quality, such as tumor boards, clinical trials, patient education, cancer care coordinator/navigator, survivorship, standard order sets and progress notes, reliable handoff, chemotherapy and radiation make/buy tools, head and neck toolkit, clinical documentation, chemotherapy efficiency, and Veterans Equitable Resource Allocation recovery for metastatic cancer.
Based on the evaluation results, participants gave their highest average ratings to items that asked about the general potential of SR to improve patient care and patient satisfaction, team dynamics, site leadership support; confidence in self, team, and coach; and the general potential of SR to improve staff satisfaction. Participants gave their lowest ratings to questions that asked about having the necessary time and resources to implement SR initiatives at their site as well as the level of active engagement by site leadership in SR work.
Click here to read the digital edition.
1. Klemp JR. Breast cancer prevention across the cancer care continuum. Semin Oncol Nurs. 2015;31(2):89-99.
2. Tralongo P, Ferraù F, Borsellino N, et al. Cancer patientcentered home care: a new model for health care in oncology. Ther Clin Risk Manag. 2011;7:387-392.
3. Institute of Medicine of the National Academy of Sciences. Delivering high-quality cancer care: charting a new course for a system in crisis. http://nationalacademies.org/hmd/~/media/Files/Report%20Files/2013/Quality-Cancer-Care/qualitycancercare_rb.pdf. Published September 2013. Accessed April 6, 2017.
4. Jemal A, Bray F, Center MM, Ferlay J, Ward E, Forman D. Global cancer statistics. CA Cancer J Clin. 2011;61(2):69-90.
5. Jabaaij L, van den Akker M, Schellevis FG. Excess of health care use in general practice and of comorbid chronic conditions in cancer patients compared to controls. BMC Fam Pract. 2012;13:60
6. Brazil K, Whelan T, O’Brien MA, Sussman J, Pyette N, Bainbridge D. Towards improving the co-ordination of supportive cancer care services in the community. Health Policy. 2004;70(1):125-131.
7. Husain A, Barbera L, Howell D, Moineddin R, Bezjak A, Sussman J. Advanced lung cancer patients’ experience with continuity of care and supportive care needs. Support Care Cancer. 2013;21(5):1351-1358.
8. Sayed S, Moloo Z, Bird P, et al. Breast cancer diagnosis in a resource poor environment through a collaborative multidisciplinary approach: the Kenyan experience. J Clin Pathol. 2013;66(4):307-311.
9. Morgan PA, Murray S, Moffatt CJ, Honnor A. The challenges of managing complex lymphoedema/chronic oedema in the UK and Canada. Int Wound J. 2011;9(1):54-69.
10. Renshaw M. Lymphorrhoea: ‘leaky legs’ are not just the nurse’s problem. Br J Community Nurs. 2007;12(4):S18-S21.
11. Morgan PA. Health professionals’ ideal roles in lympoedema management. Br J Community Nurs. 2006;11(suppl):5-8.
12. Hunnibell LS, Rose MG, Connery DM, et al. Using nurse navigation to improve timeliness of lung cancer care at a veterans hospital. Clin J Oncol Nurs. 2012;16(1):29-36.
13. Schultz EM, Powell AA, McMillan A, et al. Hospital characteristics associated with timeliness of care in veterans with lung cancer. Am J Respir Crit Care Med. 2009;179(7):
595-600.
14. Gould MK, Ghaus SJ, Olsson JK, Schultz EM. Timeliness of care in veterans with non-small cell lung cancer. Chest. 2008;133(5):1167-1173.
15. Jackson GL, Melton LD, Abbott DH, et al. Quality of nonmetastatic colorectal cancer care in the Department of Veterans Affairs. J Clin Oncol. 2010;28(19):3176-3181.
16. Walling AM, Tisnado D, Asch SM, et al. The quality of supportive cancer care in the Veterans Affairs system and targets for improvement. JAMA Intern Med. 2013;173(22):2071-2079.
17. Keating NL, Landrum MB, Lamont EB, et al. Quality of care for older patients with cancer in the Veterans Health Administration versus the private sector: a cohort study. Ann Intern Med. 2011;154(11):727-736.
18. Kaiser AM, Nunoo-Mensah JW, Wasserberg N. Surgical volume and long-term survival following surgery for colorectal cancer in the Veterans Affairs Health-Care System. Am J Gastroenterol. 2005;100(1):250.
19. Abrahams E, Foti M, Kean MA. Accelerating the delivery of patient-centered, high-quality cancer care. Clin Cancer Res. 2015;21(10):2263-2267.
20. Taplin SH, Weaver S, Salas E, et al. Reviewing cancer care team effectiveness. J Oncol Pract. 2015;11(3):239-246.
21. Kosty MP, Bruinooge SS, Cox JV. Intentional approach to team-based oncology care: evidence-based teamwork to improve collaboration and patient engagement. J Oncol Pract. 2015;11(3):247-248.
22. Ko NY, Darnell JS, Calhoun E, et al. Can patient navigation improve receipt of recommended breast cancer care? Evidence from the National Patient Navigation Research Program. J Clin Oncol. 2014;32(25):2758-2764.
23. Zapka JG, Taplin SH, Solberg LI, Manos MM. A framework for improving the quality of cancer care: the case of breast and cervical cancer screening. Cancer Epidemiol Biomarkers Prev. 2003;12(1):4-13.
24. Institute for Healthcare Improvement. The Breakthrough Series: IHI’s Collaborative Model for Achieving Breakthrough Improvement. IHI Innovation Series white paper. Boston, MA: Institute for Healthcare Improvement; 2003.
25. Boushon B, Provost L, Gagnon J, Carver P. Using a virtual breakthrough series collaborative to improve access in primary care. Jt Comm J Qual Patient Saf. 2006;32(10):573-584.
26. Womack JP, Jones DT. Lean Thinking: Banish Waste and Create Wealth in Your Corporation. New York, NY: Simon & Schuster; 1996.
27. Bidassie B, Davies ML, Stark R, Boushon B. VA experience in implementing patient-centered medical home using a breakthrough series collaborative. J Gen Intern Med. 2014;29(suppl 2):S563-S5671.
28. Bidassie B, Williams LS, Woodward-Hagg H, Matthias MS, Damush TM. Key components of external facilitation in an acute stroke quality improvement collaborative in the Veterans Health Administration. Implement Sci. 2015;10(1):69.
29. Woodward-Hagg H, Workman-Germann J, Flanagan M, et al. Implementation of systems redesign: approaches to spread and sustain adoption. In: Henriksen K, Battles J, Keyes M, Grady ML, eds. Advances in Patient Safety: New Directions and Alternative Approaches: Vol. 2: Culture and Redesign. Rockville, MD: Agency for Healthcare Research and Quality; 2008.
30. American Cancer Society. National roundtable recognizes leaders in colorectal cancer prevention effort with 80% by 2018 National Achievement Award. [press release]. http://pressroom.cancer.org/2017-02-01-National-Colorectal-Cancer-Roundtable-Recognizes-Leaders-in-Colorectal-Cancer-Prevention-Effort-with-80-by-2018-National-Achievement-Award. Published February 1, 2017. Accessed March 29, 2017.
31. Margolis PA, Lannon CM, Stuart JM, Fried BJ, Keyes-Elstein L, Moore DE Jr. Practice based education to improve delivery systems for prevention in primary care: randomized trial. BMJ. 2004;328(7436):388.
A collaboration between clinicians and industrial engineers resulted in significant improvements in cancer screening, the development of toolkits, and more efficient care for hepatocellular carcinoma and breast, colorectal, lung, head and neck, and prostate cancers.
Cancer is one of the most common causes of premature death and disability that requires long-term follow-up surveillance and oftentimes ongoing treatment for survivors that can lead to important health, psychosocial
Like other cancer treatment systems, the VA faces some challenges in timeliness, surveillance, and quality of the cancer care process.12-18 Although implementation of cancer patientcentered home care and other efforts were developed to improve delivery and efficiency of cancer care in VA and non-VA facilities, the patient continuum of care remains convoluted.2,19-23
In 2004, the Clinical Cancer Care Collaborative (C4), a national VA program, was launched to improve timeliness, quality, access improvement, efficiency, and the “sustainability and spread” of successful programs at the VA. This program included representatives throughout the VA and encompassed cancer care coordinators (clinical nurse navigators), advisory panels, and a multidisciplinary team of clinicians.
In 2009, the VA promoted the Cancer Care Collaborative (CCC) to focus on optimizing the timeliness and quality of colorectal, breast, lung, prostate, and hematologic cancer care throughout the VA health care system. The VA Office of Systems Redesign (SR) partnered with the VA-Center for Applied Systems Engineering (VA-CASE) Veteran Engineering Resource Center (VERC), including industrial engineers (IEs) to provide their expertise and support. The CCC provided a forum to develop teams; set aims; and map, measure, analyze, and implement changes to assure timely diagnosis and initiation of evidence-based treatment and subsequently sustain the practices that led to improvements in these areas.
The CCC structure was separated into 6 distinct support areas: (1) industrial/systems engineering support; (2) informatics and clinical application support; (3) development and dissemination of improvement resource guides; (4) real-time and rapid-cycle evaluation tools and approaches; (5) application of advanced operational systems engineering techniques, such as simulation and modeling to inform further system optimization; and (6) advisory panels focused on quality topics that were identified, developed, implemented, and evaluated by the participants with support from the CCC faculty.
Here the authors describe the framework of the CCC model developed by VA-CASE, demonstrate the performance improvement results of teams focusing on several types of cancer, and highlight the key indicators to best practices.
Methods
Figure 1 outlines the CCC 3-Phase Conceptual Model. Phase 1 included diagnosis (screening and symptoms); phase 2 included treatment (from diagnosis to beyond treatment); and phase 3 was designed for hub and spoke facilities where screening/diagnosis occurs in a smaller (spoke) facility and treatment occurs in the larger (hub) facility.
In the first phase, 18 facility-based teams were selected through an application and interview process and immediately applied SR to their team’s specific improvement projects, which included the following cancers: breast, colorectal, lung, and prostate.
In addition to the cancer types covered in the initial phase, phase 2 also included hepatocellular carcinoma (HCC) and head and neck cancers. National VHA Toolkits were products that developed from and for use in lung and colorectal cancers (CRCs) (phases 1 and 2). These were organized and disseminated throughout the entire VA, offering specific knowledge and tools that could be applied to improving cancer care. The toolkit included guidance documents, specific process examples, and items that could be downloaded into Microsoft SharePoint (Redmond, WA) for adaptation and use by VA facilities. The toolkit contents were primarily developed and/or identified by CCC participants and funded by the VA Office of Quality and Performance (OQP) and SR. The toolkits included links to the following resources for each cancer type in phase 2: quality indicators, tool tables, timeliness measures, understanding the continuum of care, and a resource entitled, “How Can the Quality Metrics Help Me?” (eAppendix 1, available at fedprac.com/AVAHO).
The phase 3 collaborative was designed for hub and spoke facilities by focusing on current state vs ideal state processes, communication patterns, and care coordination between the hub and spoke facilities. There were 10 facilities in which all teams focused on lung cancer. Each facility was made up of 1 hub and had the ability to send up to 8 participants (from either the hub or the spoke facility) to the CCC workgroup meetings. Participants were specialists, radiologists, primary care providers, pathologists, nurses, nurse practitioners, or physician assistants.
Conceptual Model Deployment
The deployment of the CCC 3-phase conceptual model was based on the Institute for Healthcare Improvement (IHI) Breakthrough Series Collaborative Model.24,25 Implementation was carried out over 3 phases (2005-2011) after proper teaching, coaching, and learning sessions (LS)
Each LS incorporated instruction in basic systems engineering and Lean Six Sigma principles (an approach to quality improvement that focuses on reducing waste and variability) with practical, health care-based examples, case studies, and immediate application of the VA-TAMMCS (vision/analyze, team/aim, map, measure, change, sustain) SR organizational framework (Figure 2), tools, and methodologies to the process under investigation.26 The VA-TAMMCS (eAppendix 2, available at fedprac.com/AVAHO)
The CCC encouraged joint facilitation. A SR clinical coach, a VERC IE, and participating facilities were required to work together intensively (mentor and support) for 10 to 12 months. The mix of clinicians and engineers helped the facilities by bringing in diverse perspectives, which led to better decisions in the improvement of cancer care.28 During the CCC, the IEs partnered with and supported clinicians, using Lean Six Sigma and SR tools and approaches to health care quality improvement to quickly make improvements in efficiency and quality (eAppendix 3a, 3b, and 3c, available at fedprac.com/AVAHO).26,29
![]()
The IEs provided on-site support at all participating VAMCs during all 3 phases by providing the clinical teams with a variety of VA-TAMMCS process improvement tools to support the analysis and improvement of their organizations.
Data Collection
As part of the overall improvement process, the facilities worked on several aim statements in order to improve a primary constraint; such as timeliness and quality of care. An aim statement communicates what you want to do (eg, reduce, improve, or eliminate), by how much, and when. In order to improve timeliness, the CCC focused on measures from first evidence to tissue diagnosis, from diagnosis to treatment, and also intermediate measures, such as time from positron emission tomography scan ordered to completion. While working on overall quality of care unique to cancer, the CCC focused on measures related to documentation compliance and consistency of care provided to patients.
Phase 1
Facilities were to optimize their process (time from initial suspicion to diagnosis). Hence, participating facilities were allowed to simply identify their aim statement and pick and choose the area of focus.
Phases 2 and 3
Timeliness Aims. These aims were addressed through improvements in information technology in the Computerized Patient Record System (CPRS) electronic medical record by creating electronic order sets containing codes that alert providers daily to retrieve and follow up on abnormal test results. Primary care physicians and front desk staff also were educated on the use of these order sets and to schedule a follow-up test or specialist consult within 3 to 7 days.
Aim 1: Reduce to 15 days the time from initial suspicion to diagnosis within 1 year.
Aim 2: Reduce to 30 days the time from diagnosis to start of treatment within 1 year.
Quality Aim. Improve the compliance rate of identified quality indicators to 100% within 1 year.
Measurement Tools
The Cancer Care Measurement Tools were designed to support the OQP performance metric (Figure 3). The OQP creates and collects data on evidence-based national benchmarks to measure the quality of preventive and therapeutic health care services at the facility, VISN, and national levels. These metrics may be performance measures, performance monitors, quality indicators, and special studies, among other measures, to support clinicians, managers, and employees in improving care to veterans.
For each of the 3 CCC phases, VA-CASE IEs facilitated the development of standardized measurement and tracking tools for each cancer type. The tools identified key timeliness and quality measures as a function of entered patient data (eAppendixes 4-7, available at fedprac.com/AVAHO).
Quality Improvement Toolkit Series
The Quality Improvement Toolkit Series (QITS) was created for VA clinical managers and policy makers to improve diagnosis, treatment, and patient outcomes for high-priority conditions. The goal of the QITS is to serve as the cancer care improvement resource guide to produce and disseminate the National Quality Improvement Toolkit resource.
Each tool included in the QITS is matched to 1 or more metrics of the OQP (such as a performance measure or quality indicator). For example, the types of tools include CPRS order sets and templates, enhanced registries and patient databases, service agreements, and care process flow maps. Each toolkit served as a resource for improving facility performance on a specific set of established performance measures and/or quality indicators. Toolkits that helped VA facilities improve performance on OQP quality indicators and performance measures were based on the VA-TAMMCS model and continuous improvement that was tailored to the structure and needs of the VA system. The VA-CASE staff provided guidance on the criteria for inclusion in the toolkits to promote best practice and quality in clinical practice. The criteria used by a condition-specific expert panel were based on whether or not it was (1) not already part of VA routine care nationwide; (2) can be matched to 1 or more VA quality metrics/indicators; and (3) currently in use at a health care facility (innovative VA colleagues nationwide and by non-VA health care organizations).
Evaluation
After each LS, VA CCC evaluation data were collected using standardized 5-point Likert scale questions.
Results
Industrial engineers provided > 1,200 days of on-site support across the 60 teams and built 63 flow maps and 47 customized tools based on the team’s requests throughout the implementation period. Throughout the 3-phase CCC, the IEs developed standardized measurement and tracking tools for each cancer type (lung, colorectal, prostate, head and neck, and HCC). Outcomes included the sharing of best practices that spread across programs (uploaded to the national QITS site, available only to VA employees); as well as enterprisewide development of the special interest group (eg, VHA survivorship), which led to a national survivorship toolkit.
The table illustrates the overall collaborative impact across the CCC. In phase 1, 78% of the 64 aims (breast, CRC, lung, prostate) were met at 18 facilities. In phase 2, 72% of the 94 aims (CRC; HCC; and head and neck, lung, and prostate cancers) were met at 21 facilities. In phase 3, 47% of the 64 aims for head and neck and lung cancer were met at 11 facilities. The difference in the percentage of aims met during each phase was due to the variations in complexity of cancer types as well as additional logistic barriers at each institution.
Discussion
Overall, the CCC had a positive impact that improved timeliness, accessibility, and quality of the cancer care process in participating VAMCs. The majority of VAMCs focused on optimizing the lung cancer care process in all the phases of the collaborative, given that lung cancer suspicion-to-treatment process is highly complex, requiring multiple departments to coordinate workup and care, leading to the greatest room for improvement.
Industrial engineers introduced a variety of approaches to improvement to the collaborative teams, and they were integral to the development of standardized measurement and tracking tools for each type of cancer, introducing advanced SR methods for specific aims and performing appropriate data analysis. The ability of the VA system to recognize where improvements were needed was complemented by the efforts of VA clinicians and administration with direction from VERC IEs and their toolkits. Improvements were made, sometimes decreasing time from diagnosis to treatment by 50%. The VA facilities were encouraged to sustain this improvement using the toolkits with continued data gathering and implementation. In phase 1, lung cancer improvements included (1) establishing the multidisciplinary clinic, multidisciplinary rounds, and improved communication among key service lines; (2) developing a database (measurement tool) to prospectively track all cancer patients; (3) scheduling weekly multidisciplinary meetings to provide a mechanism to rapidly review patients and triage to appropriate pathways in the treatment algorithm; and (4) increasing physician participation, including oncologists, surgeons, radiologists, and radiation oncologists, to identify methods and process
changes that could eliminate wasteful steps and improve access for expediting diagnosis and treatment of patients with lung cancer who require surgery, chemotherapy, and/or radiation. The overall impact on time from abnormal CT to lung cancer surgery was reduced by > 5 months from 180 to 20 days. Substantial improvements were made in timeliness and reliability in caring for veterans with lung cancer.12
Groundbreaking work and exceptional results continued in the second phase for lung cancer care. In addition, the creation of a prostate cancer care web-based clinical measurement tool helped to improve the ability to proactively manage patients. The tool included same-day scheduling of biopsy and urology appointments for veterans with possible prostate cancer and the development of a protocol for expedited high-risk patients with metastatic disease. Ultimately, the wait time from urology consult to diagnosis was cut from 96 to 46 days for veterans with prostate cancer (Figure 4).
Once the face-to-face CCC process was established, tested, refined, and replicated successfully, the virtual team proved to be a cost-effective model. The virtual team did not travel to LSs, a major source of expense, so a process was set in place for their participation in all other facets of the collaborative. This led to the pilot testing of national virtual collaboratives (eg, specialty and surgical care collaboratives).
The toolkits for lung and CRC (phases 1 and 2) were organized, standardized, and disseminated throughout the VA to provide specific knowledge and tools to improve cancer care. The content of toolkits was primarily developed and/or identified by CCC participants. Funding for the toolkits was secured by OQP and SR, which led to the creation of the integration and crosswalk documents (eAppendix 7, available at fedprac.com/AVAHO).
In phase 3, lung cancer care teams showed the most improvement among all 3 phases of the collaborative. Aims statements in lung cancer process showed an increased percentage of improvement in all phases. Weekly multidisciplinary meetings provided a mechanism to rapidly review patients and triage appropriate pathways in the treatment algorithm. Open communication among sites and disciplines was vital and increased participation by physicians to identify ways to expedite diagnosis and treatment of lung cancer. In addition to access and timeliness of care (accommodating patients’ preference for scheduling), the teams identified areas they deemed important for successful programs and developed advisory panels that focused on quality, such as tumor boards, clinical trials, patient education, cancer care coordinator/navigator, survivorship, standard order sets and progress notes, reliable handoff, chemotherapy and radiation make/buy tools, head and neck toolkit, clinical documentation, chemotherapy efficiency, and Veterans Equitable Resource Allocation recovery for metastatic cancer.
Based on the evaluation results, participants gave their highest average ratings to items that asked about the general potential of SR to improve patient care and patient satisfaction, team dynamics, site leadership support; confidence in self, team, and coach; and the general potential of SR to improve staff satisfaction. Participants gave their lowest ratings to questions that asked about having the necessary time and resources to implement SR initiatives at their site as well as the level of active engagement by site leadership in SR work.
Click here to read the digital edition.
1. Klemp JR. Breast cancer prevention across the cancer care continuum. Semin Oncol Nurs. 2015;31(2):89-99.
2. Tralongo P, Ferraù F, Borsellino N, et al. Cancer patientcentered home care: a new model for health care in oncology. Ther Clin Risk Manag. 2011;7:387-392.
3. Institute of Medicine of the National Academy of Sciences. Delivering high-quality cancer care: charting a new course for a system in crisis. http://nationalacademies.org/hmd/~/media/Files/Report%20Files/2013/Quality-Cancer-Care/qualitycancercare_rb.pdf. Published September 2013. Accessed April 6, 2017.
4. Jemal A, Bray F, Center MM, Ferlay J, Ward E, Forman D. Global cancer statistics. CA Cancer J Clin. 2011;61(2):69-90.
5. Jabaaij L, van den Akker M, Schellevis FG. Excess of health care use in general practice and of comorbid chronic conditions in cancer patients compared to controls. BMC Fam Pract. 2012;13:60
6. Brazil K, Whelan T, O’Brien MA, Sussman J, Pyette N, Bainbridge D. Towards improving the co-ordination of supportive cancer care services in the community. Health Policy. 2004;70(1):125-131.
7. Husain A, Barbera L, Howell D, Moineddin R, Bezjak A, Sussman J. Advanced lung cancer patients’ experience with continuity of care and supportive care needs. Support Care Cancer. 2013;21(5):1351-1358.
8. Sayed S, Moloo Z, Bird P, et al. Breast cancer diagnosis in a resource poor environment through a collaborative multidisciplinary approach: the Kenyan experience. J Clin Pathol. 2013;66(4):307-311.
9. Morgan PA, Murray S, Moffatt CJ, Honnor A. The challenges of managing complex lymphoedema/chronic oedema in the UK and Canada. Int Wound J. 2011;9(1):54-69.
10. Renshaw M. Lymphorrhoea: ‘leaky legs’ are not just the nurse’s problem. Br J Community Nurs. 2007;12(4):S18-S21.
11. Morgan PA. Health professionals’ ideal roles in lympoedema management. Br J Community Nurs. 2006;11(suppl):5-8.
12. Hunnibell LS, Rose MG, Connery DM, et al. Using nurse navigation to improve timeliness of lung cancer care at a veterans hospital. Clin J Oncol Nurs. 2012;16(1):29-36.
13. Schultz EM, Powell AA, McMillan A, et al. Hospital characteristics associated with timeliness of care in veterans with lung cancer. Am J Respir Crit Care Med. 2009;179(7):
595-600.
14. Gould MK, Ghaus SJ, Olsson JK, Schultz EM. Timeliness of care in veterans with non-small cell lung cancer. Chest. 2008;133(5):1167-1173.
15. Jackson GL, Melton LD, Abbott DH, et al. Quality of nonmetastatic colorectal cancer care in the Department of Veterans Affairs. J Clin Oncol. 2010;28(19):3176-3181.
16. Walling AM, Tisnado D, Asch SM, et al. The quality of supportive cancer care in the Veterans Affairs system and targets for improvement. JAMA Intern Med. 2013;173(22):2071-2079.
17. Keating NL, Landrum MB, Lamont EB, et al. Quality of care for older patients with cancer in the Veterans Health Administration versus the private sector: a cohort study. Ann Intern Med. 2011;154(11):727-736.
18. Kaiser AM, Nunoo-Mensah JW, Wasserberg N. Surgical volume and long-term survival following surgery for colorectal cancer in the Veterans Affairs Health-Care System. Am J Gastroenterol. 2005;100(1):250.
19. Abrahams E, Foti M, Kean MA. Accelerating the delivery of patient-centered, high-quality cancer care. Clin Cancer Res. 2015;21(10):2263-2267.
20. Taplin SH, Weaver S, Salas E, et al. Reviewing cancer care team effectiveness. J Oncol Pract. 2015;11(3):239-246.
21. Kosty MP, Bruinooge SS, Cox JV. Intentional approach to team-based oncology care: evidence-based teamwork to improve collaboration and patient engagement. J Oncol Pract. 2015;11(3):247-248.
22. Ko NY, Darnell JS, Calhoun E, et al. Can patient navigation improve receipt of recommended breast cancer care? Evidence from the National Patient Navigation Research Program. J Clin Oncol. 2014;32(25):2758-2764.
23. Zapka JG, Taplin SH, Solberg LI, Manos MM. A framework for improving the quality of cancer care: the case of breast and cervical cancer screening. Cancer Epidemiol Biomarkers Prev. 2003;12(1):4-13.
24. Institute for Healthcare Improvement. The Breakthrough Series: IHI’s Collaborative Model for Achieving Breakthrough Improvement. IHI Innovation Series white paper. Boston, MA: Institute for Healthcare Improvement; 2003.
25. Boushon B, Provost L, Gagnon J, Carver P. Using a virtual breakthrough series collaborative to improve access in primary care. Jt Comm J Qual Patient Saf. 2006;32(10):573-584.
26. Womack JP, Jones DT. Lean Thinking: Banish Waste and Create Wealth in Your Corporation. New York, NY: Simon & Schuster; 1996.
27. Bidassie B, Davies ML, Stark R, Boushon B. VA experience in implementing patient-centered medical home using a breakthrough series collaborative. J Gen Intern Med. 2014;29(suppl 2):S563-S5671.
28. Bidassie B, Williams LS, Woodward-Hagg H, Matthias MS, Damush TM. Key components of external facilitation in an acute stroke quality improvement collaborative in the Veterans Health Administration. Implement Sci. 2015;10(1):69.
29. Woodward-Hagg H, Workman-Germann J, Flanagan M, et al. Implementation of systems redesign: approaches to spread and sustain adoption. In: Henriksen K, Battles J, Keyes M, Grady ML, eds. Advances in Patient Safety: New Directions and Alternative Approaches: Vol. 2: Culture and Redesign. Rockville, MD: Agency for Healthcare Research and Quality; 2008.
30. American Cancer Society. National roundtable recognizes leaders in colorectal cancer prevention effort with 80% by 2018 National Achievement Award. [press release]. http://pressroom.cancer.org/2017-02-01-National-Colorectal-Cancer-Roundtable-Recognizes-Leaders-in-Colorectal-Cancer-Prevention-Effort-with-80-by-2018-National-Achievement-Award. Published February 1, 2017. Accessed March 29, 2017.
31. Margolis PA, Lannon CM, Stuart JM, Fried BJ, Keyes-Elstein L, Moore DE Jr. Practice based education to improve delivery systems for prevention in primary care: randomized trial. BMJ. 2004;328(7436):388.
Ocrelizumab safety update: Encouraging rates of serious infection, malignancy
LOS ANGELES – No new safety signals have emerged in multiple sclerosis patients treated with ocrelizumab, according to ongoing follow-up and postmarketing surveillance.
As of September 2017, patients with relapsing or primary progressive MS who were part of the pivotal OPERA I and II and ORATORIO trials – including phases 2 and 3 and open-label extensions – as well as an all-exposure population that included patients from prior studies, had nearly 9,500 patient-years of exposure to ocrelizumab (Ocrevus), a humanized anti-CD20 monoclonal antibody. The all-exposure population contributed about 1,500 of those patient-years, Stephen Hauser, MD, reported at the annual meeting of the American Academy of Neurology.
Postmarketing experience in approximately 37,000 treated patients with an additional 14,000 patient-years shows a fatality rate of 0.28/100 patient-years (49 fatalities) as of March 2018, he said.
“If one compares this to at least two reports of epidemiologic mortality estimates in MS, this is in line with – and in fact a little bit lower than – those estimates that range between 0.37 and 0.9, compared with 0.28,” he said. “So ... the updated safety profile in this all-exposure ocrelizumab population was generally consistent with what was seen during the controlled treatment period, and rates of serious infections fluctuated over time without any sustained increase.”
Only one serious opportunistic infection (Pasteurella) occurred in the controlled trials, and three more (two varicella zoster, one herpes simplex) occurred during open-marketing experience.
The rate of malignancies has been very encouraging, as well, as it appears to continue to align with population expectations, Dr. Hauser said.
Trial participants received 600-mg doses intravenously every 24 weeks in all three trials; in OPERA I/II, they received 96 weeks of treatment with the first dose given as two 300-mg infusions split by 14 days, and, in ORATORIO, they received at least 120 weeks of treatment with all doses split, Dr. Hauser said.
In the phase 2 study, they received split doses of 600-mg or 2,000-mg infusions through week 24; then through week 96, they received either 600-mg or 1,000-mg doses; those receiving 600 mg included those who started at that dose and those who received placebo or interferon beta-1a 30 mcg, and those receiving 1,000 mg were those who started on ocrelizumab at 2,000 mg.
The comparators were placebo in the ORATORIO and phase 2 trials, and interferon beta-1a given at a dose of 44 mcg subcutaneously three times weekly (OPERA I and II) or 30 mcg intramuscularly each week in the phase 2 trial.
All patients were offered enrollment into open-label extension studies, and “there was rather massive interest in joining the open-label extension and continuing open-label extension in both trials,” he said.
“And earlier here at the AAN [meeting] we presented the clinical efficacy data from the open-label extension, now 2 years completed – so 4 years from onset of the study – in patients who received ocrelizumab continuously for [relapsing-remitting] MS during that time period, or who switched from three-times-weekly interferon beta-1a to ocrelizumab ... and the data continue to show the positive outcomes reported in the original trials,” he added.
Further, follow-up data on MRI outcomes from the open-label extensions demonstrate that the effects on focal disease activity and on progression persists and is durable with ongoing treatment, he noted.
“In conclusion, there is no pattern of serious infections or malignancies that has emerged thus far with increased exposure, but obviously long-term follow-up and postmarketing requirement studies are needed to monitor long-term patient safety and rare events that couldn’t be captured here,” he said.
This study was sponsored by F. Hoffmann-La Roche. Dr. Hauser has received personal compensation for consulting, serving on a scientific advisory board, speaking, or other activities with Symbiotix, Annexon Biosciences, Bionure, Molecular Stethoscope, and for serving on the Board of Directors of Neurona Therapeutics.
SOURCE: Hauser S et al. Neurology. 2018 Apr 9;(15 Suppl.):S36.001.
REPORTING FROM AAN 2018
Key clinical point: Follow-up and postmarketing surveillance show no new safety signals with ocrelizumab.
Major finding: The fatality rate was 0.28/100 patient-years as of March 2018.
Study details: Follow-up of patients with nearly 9,500 patient-years of experience with ocrelizumab and postmarketing surveillance in patients with more than 14,000 patient-years of experience.
Disclosures: This study was sponsored by F. Hoffmann-La Roche. Dr. Hauser has received personal compensation for consulting, serving on a scientific advisory board, speaking, or other activities with Symbiotix, Annexon Biosciences, Bionure, Molecular Stethoscope, and for serving on the board of directors of Neurona Therapeutics.
Source: Hauser S et al. Neurology. 2018 Apr 9;(15 Suppl.):S36.001.
Using Dermoscopy to Identify Melanoma and Improve Diagnostic Discrimination (FULL)
From 1982 to 2011, the melanoma incidence rate doubled in the US.1 In 2018, an estimated 87,290 cases of melanoma in situ and 91,270 cases of invasive melanoma will be diagnosed in the US, and 9,320 deaths will be attributable to melanoma.2 Early detection of melanoma is critically important to reduce melanoma-related mortality, with 5-year survival rates as high as 97% at stage 1A vs a 20% 5-year survival when there is distant metastasis.2,3 Melanoma is particularly relevant for medical providers working with veterans because melanoma disproportionately affects service members with an incidence rate ratio of 1.62 (95% confidence interval [CI], 1.40-1.86) compared with that of the general population.4
Biopsy is the definitive diagnostic tool for melanoma. Histologic analysis differentiates melanoma from seborrheic keratoses, pigmented nevi, dermatofibromas, and other pigmented lesions that can resemble melanoma on clinical examination. However, biopsy must be used judiciously as unnecessary biopsies contribute to health care costs and leave scars, which can have psychosocial implications. With benign nevi outnumbering melanoma about 2 million to 1, biopsy is indicated once a threshold of suspicion is obtained.5
Dermoscopic Tool
Dermoscopy is a microscopy-based tool to improve noninvasive diagnostic discrimination of skin lesions based on color and structure analysis. Coloration provides an indication of the composition of elements present in the skin with keratin appearing yellow, blood appearing red, and collagen appearing white. Coloration also suggests pigment depth as melanin appears black when located in the stratum corneum, brown when located deeper in the epidermis, and blue when located in the dermis.6 Finally, characteristic histopathologic alterations in the dermoepidermal junction, rete ridges, pigment-containing cells, and/or melanocyte granules that occur in melanoma are recognizable with dermoscopy.6
In 2001, Bafounta and colleagues performed the first meta-analysis on the efficacy of dermoscopy compared with that of clinical evaluation, finding that dermoscopy performed specifically by dermatology-trained clinicians improved the accuracy of identifying melanoma from an odds ratio of 16 (95% CI, 9-31) with naked eye examination to 76 (95% CI, 25-223) with dermoscopy.7
More recently, Terushkin and colleagues demonstrated that diagnosis specificity improves when a general dermatologist is trained in dermoscopic pattern recognition. Naked eye examination produced a benign to malignant ratio (BMR) of 18.4:1, indicating that about 18 of 19 biopsies considered suspicious for melanoma ultimately yielded benign melanocytic lesions. Although the BMR for the general dermatologist experienced an increase after dermoscopy training, the ratio eventually decreased to 7.9:1.8
Dermoscopic Analysis
Some of the common patterns recognized in melanoma are demonstrated in Figures 1 and 2. Figure 1 is a close-up of a patient’s upper back showing a solitary asymmetric melanocytic lesion containing multiple red, brown, black, and blue hues. 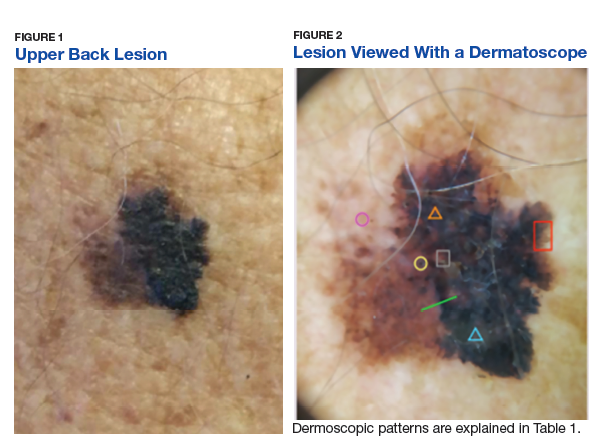
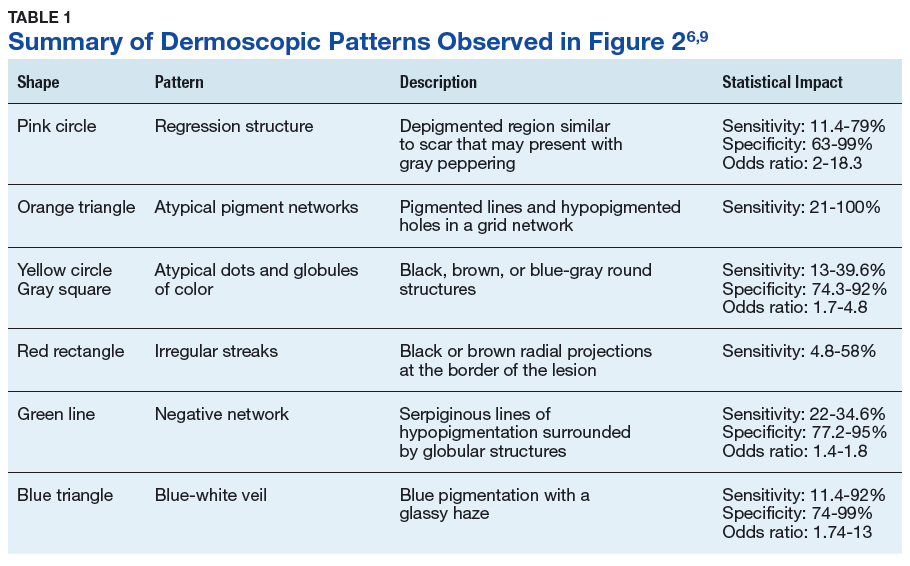
Pattern analysis, the dermoscopic interpretation method preferred by pigmented lesion specialists, requires simultaneously assessing numerous lesion patterns that vary depending on body site.10 Alternative dermoscopic algorithms that focus on the most common features of melanoma have been developed to aid practitioners with the interpretation of dermoscopy findings: the 7-point checklist, the Menzies method, the ABCD rule, and the CASH algorithm (Tables 2, 3, 4, and 5). 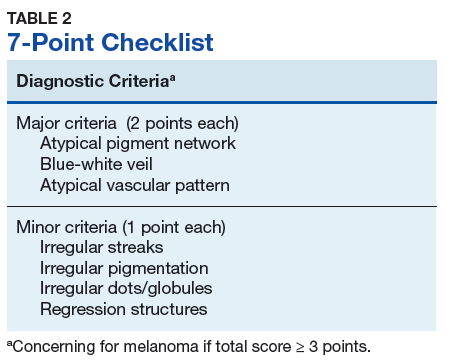
Argenziano and colleagues developed the 7-point checklist in 1998. Two points are assigned to the lesion for each of the major criteria and 1 point for each minor criteria. 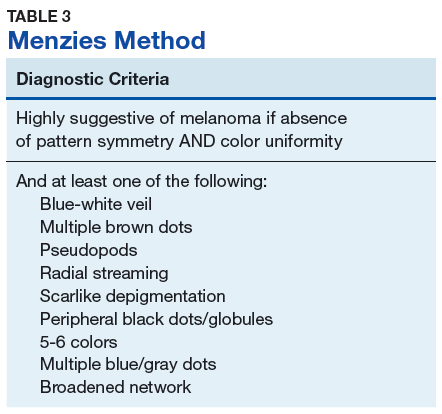
The Menzies method was developed by Menzies and colleagues in 1996. To be classified as melanoma, the pigmented lesion must show an absence of pattern symmetry and color uniformity while simultaneously exhibiting at least one of the following: blue-white veil, multiple brown dots, pseudopods, radial streaming, scarlike depigmentation, peripheral block dots/globules, 5 to 6 colors, multiple blue/gray dots, and a broadened network.12 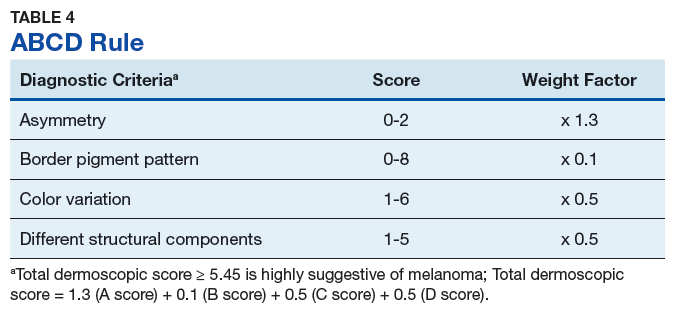
The ABCD rule is a more technical dermoscopic evaluation algorithm developed in 1994 by Stolz and colleagues. This method yields a numeric value called the total dermoscopic score (TDS) based on Asymmetry, Border pigment pattern, Color variation, and 5 Different structural components. 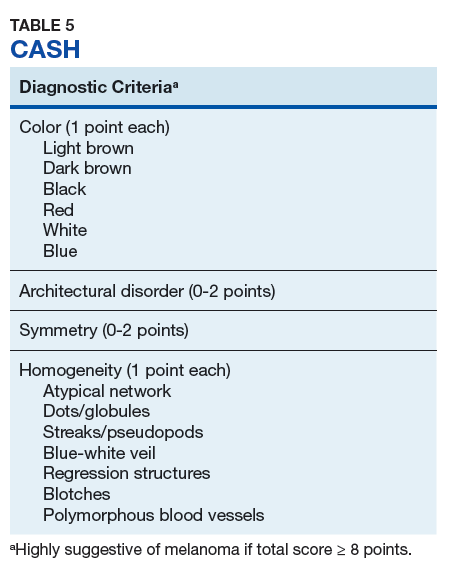
Henning and colleagues developed the CASH algorithm in 2006 with the intention of assisting less experienced dermoscopy users with lesion evaluation.14 This algorithm tallies points for Color, Architectural disorder, Symmetry, and Homogeneity. One point is attributed to a lesion for each light brown, dark brown, black, red, white, and/or blue region present. Architectural disorder is assigned a point value between 0 and 2, with 0 indicating the absence of or minimal architectural disorder, 1 indicating moderate disorder, and 2 indicating marked disorder. Symmetry is assigned a point value between 0 and 2, with 0 points assigned to a lesion that exhibits biaxial symmetry, 1 point assigned to a lesion that exhibits monoaxial symmetry, and 2 points assigned to a lesion that exhibits biaxial asymmetry. Finally, 1 point is attributed to a lesion for evidence of each of the following: atypical network, dots/globules, streaks/pseudopods, blue-white veil, regression structures, blotches > 10% of the overall lesion size, and polymorphous blood vessels. The lesion in Figure 2 scores 16 points out of the maximum total CASH score of 17. Any lesion scoring 8 or more is suggestive of malignant melanoma.14
Finally, the TADA method was developed by Rogers and colleagues in 2016.15 This method uses sequential questions to evaluate lesions. First, “Does the lesion exhibit clear dermoscopic evidence of an angioma, dermatofibroma, or seborrheic keratosis?” If “yes,” then no additional dermoscopic evaluation is necessary, and it is recommended to monitor the lesion. If the answer to the first question is “no,” then ask, “Does the lesion exhibit architectural disorder?” The presence of architectural disorder is based on an overall impression of the lesion, which includes symmetry with regard to structures and colors. Any lesion deemed to exhibit architectural disorder should be biopsied. If the lesion has no architectural disorder, the third question is, “Does the lesion contain any starburst patterns, blue-black or gray coloration, shiny white structures, negative networks, ulcers or erosions, and/or vessels?” If “yes,” then the lesion should be biopsied. Since the lesion in Figure 2 exhibits marked architectural disorder in terms of symmetry and color, analysis of the lesion with the TADA method would yield a recommendation for biopsy.15
Dermoscopy in Practice
A. Bernard Ackerman, MD, a key figure in the modern era of dermatopathology, wrote an editorial for the Journal of the American Academy of Dermatology in 1985 titled “No one should die of malignant melanoma.” The editorial highlighted that the visual changes associated with melanoma often manifest years prior to malignant invasion and advocated that all physicians should have competence in melanoma detection, specifically mentioning the importance of training primary care physicians (PCPs), dermatologists, and pathologists in this regard.16 This sentiment is equally as true now as it was in 1985.
Naked eye examination paired with an evaluation of patient risk factors for melanoma, including fair skin types, significant sun exposure history, history of sunburn, geographic location, and personal and family history of melanoma, are the foundation of melanoma detection efforts.17 Studies suggest that the triage skills of PCPs could be improved in regard to the evaluation of pigmented lesions. Primary care residents, for instance, did not accurately diagnose 40% of malignant melanoma cases.18,19 Additionally, a meta-analysis demonstrated that PCP accuracy when diagnosing malignant melanoma ranged between 49% and 80%, significantly less than the 85% to 89% exhibited by practicing dermatologists.19 Dermoscopy could be incorporated as an element of the skin examination to enhance lesion discrimination among PCPs, as it has proven use in dermatologic practice.
Dermoscopy is not readily used by PCPs. A survey study of 705 family practitioners in the US performed by Morris and colleagues demonstrated that only 8.3% of participants currently use a dermatoscope to evaluate pigmented lesions.20 The most common barriers to dermoscopy use cited by PCPs in the US include the cost of the dermatoscope, the time required to acquire proficiency, and the lack of financial reimbursement.16 True utilization of dermoscopy among PCPs is higher than this figure suggests due to the number of PCPs who access dermoscopic evaluations via teledermatology. All 21 Veterans Integrated Services Networks of the Veterans Health Administration (VHA) system, for instance, participate in teledermatology and jointly employ more than 1,150 trained telehealth clinical technicians who created a collective 107,000 teledermatology encounters with and without dermoscopy for evaluation by dermatologists in the most recent fiscal year(Martin Weinstock, written communication, October 2017). Nonetheless, it is necessary to determine the contribution that wider utilization of dermoscopy among PCPs would have on melanoma surveillance.
Studies show that dermoscopic algorithms improve the sensitivity while slightly decreasing the specificity of PCPs to detect melanoma compared with that of the naked eye examination. Dolianitis and colleagues demonstrated that a baseline sensitivity of 60.9% for melanoma detection improved to 85.4% with the 7-point checklist, 85.4% with Menzies method, and 77.5% with the ABCD rule, while the baseline specificity of 85.4% moderated to 73.0%, 77.7%, and 80.4%, respectively, among 61 medical practitioners after studying dermoscopy techniques from 2 CDs.21 Westerhoff and colleagues performed a randomized controlled trial with 74 PCPs to determine the effect of a minimal intervention on melanoma diagnostic accuracy. The intervention consisted of providing participants in the experimental group with an atlas of microscopic features common to melanoma to be read at the participants’ leisure, a 1-hour presentation on microscopy, and a 25-questionpractice quiz. Participants randomized to the intervention group improved their diagnostic accuracy from 57.8% to 75.9% with the use of dermoscopy. This group also experiencedimproved accuracy in its clinical diagnosis of melanoma from 54.6% to 62.7%.22
Argenziano and colleagues demonstrated similar results after PCPs attended a 4-hour workshop on dermoscopy. The 73 PCPs in this study evaluated 2,522 lesions randomized to naked eye examination or dermoscopy. The BMR, calculated from the data provided, improved from 12.6:1 to 10.5:1, respectively, when dermoscopy was incorporated into lesion analysis, while the sensitivity increased from 54.1% to 79.2% and the negative predictive value increased from 95.8% to 98.1%. It is important to note that the BMR and negative predictive value improved in tandem, indicating that PCPs were more discriminatory with their referrals for evaluation by dermatology while capturing a greater percentage of melanomas.23
These studies are not without limitations that preclude broad generalizations. For example, Dolianitis and colleagues and Westerhoff and colleagues provided participants with dermoscopic images of the lesions to be evaluated instead of requiring personal use of a dermatoscope, whereas the study by Argenziano and colleagues incorporated only 6 histopathologically proven malignant melanomas into each of the naked eye examination and the experimental dermoscopy groups.21-23 Yet these studies suggest that broader use of dermoscopy among PCPs could improve the accuracy of melanoma detection given clinically relevant training.
Several additional studies identify positive correlations associated with dermoscopy use among PCPs. A recent survey of 425 French general practitioners found that 8% of the study participants acknowledged owning a dermatoscope. Dermatoscope owners spent a statistically significant longer time analyzing each pigmented skin lesions, exhibited greater confidence in their analysis of pigmented lesions, and issued fewer overall referrals to dermatologists.24
Similarly, Rosendahl and colleagues evaluated the number needed to treat (NNT) (equivalent to the BMR) among 193 Australian PCPs and found that the NNT was inversely correlated to the frequency with which the physicians used dermoscopy. However, it was difficult to determine the definitive cause of the reduced NNT in this study because a similar effect was observed when NNT was evaluated based on general practitioner subspecialization.25 Again, despite limitations, these studies suggest that increased dermoscopy use among PCPs could reduce the morbidity of lifelong scarring as well as the short-term anxiety associated with a possible melanoma diagnosis.
Limitations
Even in the hands of a trained dermatologist, dermoscopy has limitations. Featureless melanoma is a term applied to melanoma lesions bereft of classical findings on both naked eye examination and dermoscopy. Menzies, a dermatologic pioneer in dermoscopy, acknowledged this limitation in 1996 while showing that 8% of melanomas evaded dermoscopic detection. He proceeded to discuss the importance of clinical history in melanoma detection because all of the featureless melanomas exhibited recent changes in size, shape, and/or color.26 More recently, sequential dermoscopy (mole mapping) imaging has been implemented to successfully identify these lesions.27 Thus, dermoscopy cannot replace dermatologists trained in the art of visual assessment with honed clinical diagnostic acumen. Rather, dermoscopy is a tool to enhance the assessment of clinically suspicious lesions and aid diagnostic discrimination of uncertain pigmented lesions.
Conclusion
Primary care physicians are on the frontline of medicine and often the first to have the opportunity to detect the presence of melanoma. Notably, 52.2% of the 884.7 million medical office visits performed annually in the US are with PCPs.28 Despite the benefits, dermoscopy is not uniformly used by dermatologists in the US. Of dermatologists practicing for more than 20 years, 76.2% use dermoscopy compared with 97.8% of dermatologists in practice for less than 5 years. This illustrates an increased use in tandem with dermatology residencies integrating dermoscopy training as a component of the curriculum, showing the importance of incorporating dermoscopy into medical school and residency training for PCPs..29-31 Guidelines regarding dermoscopy training and dermoscopic evaluation algorithms should be established, routinely taught in medical education, and actively incorporated into training curriculum for PCPs in order to improve patient care and realize the potential health care savings associated with the early diagnosis and treatment of melanoma. Dermoscopic-teledermatology consultations present a viable opportunity within the VHA to expedite access to care for veterans and simultaneously offer evaluative feedback on lesions to referring PCPs, as skilled, dermoscopy-trained dermatologists render the diagnoses. Given the devastating mortality rate of melanoma, continued multidisciplinary education on identifying melanoma is of the utmost importance for patient care. Widespread implementation of dermoscopy and dermoscopic-teledermatology consultations could save lives and slow the ever-increasing economic burden associated with melanoma treatment, costing $1.467 billion in 2016.32
1. Guy GP Jr, Thomas CC, Thompson T, Watson M, Massetti GM, Richardson LC. Vital signs: melanoma incidence and mortality trends and projections-United States, 1982-2030. MMWR Morb Mortal Wkly Rep. 2015;64(21):591-596.
2. Siegel RL, Miller KD, Jemal A. Cancer statistics, 2018. CA Cancer J Clin. 2018;68(1):7-30.
3. American Cancer Society. Cancer facts & figures 2017. Atlanta: American Cancer Society; 2017. https://www.cancer.org/content/dam/cancer-org/research/cancer-facts-and-statistics/annual-cancer-facts-and-figures/2017/cancer-facts-and-figures-2017.pdf. Accessed April 19, 2018.
4. Lea CS, Efird JT, Toland AE, Lewis DR, Phillips CJ. Melanoma incidence rates in active duty military personnel compared with a population-based registry in the United States, 2000-2007. Mil Med. 2014;179(3):247-253.
5. Thomas L, Puig S. Dermoscopy, digital dermoscopy and other diagnostic tools in the early detection of melanoma and follow-up of high-risk skin cancer patients. Acta Derm Venereol. 2017;97(218):14-21.
6. Marghoob AA, Usatine RP, Jaimes N. Dermoscopy for the family physician. Am Fam Physician. 2013;88(7):441-450.
7. Bafounta ML, Beauchet A, Aegerter P, Saiag P. Is dermoscopy (epiluminescence microscopy) useful for the diagnosis of melanoma? Results of a meta-analysis using techniques adapted to the evaluation of diagnostic tests. Arch Dermatol. 2001;137(10):1343-1350.
8. Terushkin V, Warycha M, Levy M, Kopf AW, Cohen DE, Polsky D. Analysis of the benign to malignant ratio of lesions biopsied by a general dermatologist before and after the adoption of dermoscopy. Arch Dermatol. 2010;146(3):343-344.
9. Wolner ZJ, Yélamos O, Liopyris K, Rogers T, Marchetti MA, Marghoob AA. Enhancing skin cancer diagnosis with dermoscopy. Dermatol Clin. 2017;35(4):417-437.
10. Carli P, Quercioli E, Sestini S, et al. Pattern analysis, not simplified algorithms, is the most reliable method for teaching dermoscopy for melanoma diagnosis to residents in dermatology. Br J Dermatol. 2003;148(5):981-984.
11. Argenziano G, Fabbrocini G, Carli P, De Giorgi V, Sammarco E, Delfino M. Epiluminescence microscopy for the diagnosis of doubtful melanocytic skin lesions. Comparison of the ABCD rule of dermatoscopy and a new 7-point checklist based on pattern analysis. Arch Dermatol. 1998;134(12):1563-1570.
12. Menzies SW, Ingvar C, Crotty KA, McCarthy WH. Frequency and morphologic characteristics of invasive melanomas lacking specific surface microscopic features. Arch Dermatol. 1996;132(10):1178-1182.
13. Nachbar F, Stolz W, Merkle T, et al. The ABCD rule of dermatoscopy. High prospective value in the diagnosis of doubtful melanocytic skin lesions. J Am Acad Dermatol. 1994;30(4):551-559.
14. Henning JS, Dusza SW, Wang SQ, et al. The CASH (color, architecture, symmetry, and homogeneity) algorithm for dermoscopy. J Am Acad Dermatol. 2007;56(1):45-52.
15. Rogers T, Marino M, Dusza SW, Bajaj S, Marchetti MA, Marghoob A. Triage amalgamated dermoscopic algorithm (TADA) for skin cancer screening. Dermatol Pract Concept. 2017;7(2):39-46.
16. Ackerman AB. No one should die of malignant melanoma. J Am Acad Dermatol. 1985;12(1):115-116.
17. Gandini S, Sera F, Cattaruzza MS, et al. Meta-analysis of risk factors for cutaneous melanoma: II: sun exposure. Eur J Cancer. 2005;41(1):45-60.
18. Gerbert B, Maurer T, Berger T, et al. Primary care physicians as gatekeepers in managed care. Primary care physicians’ and dermatologists’ skills at secondary prevention of skin cancer. Arch Dermatol. 1996;132(9):1030-1038.
19. Corbo MD, Wismer J. Agreement between dermatologists and primary care practitioners in the diagnosis of malignant melanoma: review of the literature. J Cutan Med Surg. 2012;16(5):306-310.
20. Morris JB, Alfonso SV, Hernandez N, Fernández MI. Examining the factors associated with past and present dermoscopy use among family physicians. Dermatol Pract Concept. 2017;7(4):63-70.
21. Dolianitis C, Kelly J, Wolfe R, Simpson P. Comparative performance of 4 dermoscopic algorithms by nonexperts for the diagnosis of melanocytic lesions. Arch Dermatol. 2005;141(8):1008-1014.
22. Westerhoff K, Mccarthy WH, Menzies SW. Increase in the sensitivity for melanoma diagnosis by primary care physicians using skin surface microscopy. Br J Dermatol. 2000;143(5):1016-1020.
23. Argenziano G, Puig S, Zalaudek I, et al. Dermoscopy improves accuracy of primary care physicians to triage lesions suggestive of skin cancer. J Clin Oncol. 2006;24(12):1877-1882.
24. Chappuis P, Duru G, Marchal O, Girier P, Dalle S, Thomas L. Dermoscopy, a useful tool for general practitioners in melanoma screening: a nationwide survey. Br J Dermatol. 2016;175(4):744-750.
25. Rosendahl C, Williams G, Eley D, et al. The impact of subspecialization and dermatoscopy use on accuracy of melanoma diagnosis among primary care doctors in Australia. J Am Acad Dermatol. 2012;67(5):846-852.
26. Menzies SW, Ingvar C, Crotty KA, McCarthy WH. Frequency and morphologic characteristics of invasive melanomas lacking specific surface microscopic features. Arch Dermatol. 1996;132(10):1178-1182.
27. Kittler H, Guitera P, Riedl E, et al. Identification of clinically featureless incipient melanoma using sequential dermoscopy imaging. Arch Dermatol. 2006;142(9):1113-1119.
28. Centers for Disease Control and Prevention. Ambulatory care use and physician office visits. https://www.cdc.gov/nchs/fastats/physician-visits.htm. Updated May 3, 2017. Accessed April 10, 2018.
29. Murzaku EC, Hayan S, Rao BK. Methods and rates of dermoscopy usage: a cross-sectional survey of US dermatologists stratified by years in practice. J Am Acad Dermatol. 2014;71(2):393-395.
30. Nehal KS, Oliveria SA, Marghoob AA, et al. Use of and beliefs about dermoscopy in the management of patients with pigmented lesions: a survey of dermatology residency programmes in the United States. Melanoma Res. 2002;12(6):601-605.
31. Wu TP, Newlove T, Smith L, Vuong CH, Stein JA, Polsky D. The importance of dedicated dermoscopy training during residency: a survey of US dermatology chief residents. J Am Acad Dermatol. 2013;68(6):1000-1005.
32. Lim HW, Collins SAB, Resneck JS Jr, et al. The burden of skin disease in the United States. J Am Acad Dermatol. 2017;76(5):958-972
From 1982 to 2011, the melanoma incidence rate doubled in the US.1 In 2018, an estimated 87,290 cases of melanoma in situ and 91,270 cases of invasive melanoma will be diagnosed in the US, and 9,320 deaths will be attributable to melanoma.2 Early detection of melanoma is critically important to reduce melanoma-related mortality, with 5-year survival rates as high as 97% at stage 1A vs a 20% 5-year survival when there is distant metastasis.2,3 Melanoma is particularly relevant for medical providers working with veterans because melanoma disproportionately affects service members with an incidence rate ratio of 1.62 (95% confidence interval [CI], 1.40-1.86) compared with that of the general population.4
Biopsy is the definitive diagnostic tool for melanoma. Histologic analysis differentiates melanoma from seborrheic keratoses, pigmented nevi, dermatofibromas, and other pigmented lesions that can resemble melanoma on clinical examination. However, biopsy must be used judiciously as unnecessary biopsies contribute to health care costs and leave scars, which can have psychosocial implications. With benign nevi outnumbering melanoma about 2 million to 1, biopsy is indicated once a threshold of suspicion is obtained.5
Dermoscopic Tool
Dermoscopy is a microscopy-based tool to improve noninvasive diagnostic discrimination of skin lesions based on color and structure analysis. Coloration provides an indication of the composition of elements present in the skin with keratin appearing yellow, blood appearing red, and collagen appearing white. Coloration also suggests pigment depth as melanin appears black when located in the stratum corneum, brown when located deeper in the epidermis, and blue when located in the dermis.6 Finally, characteristic histopathologic alterations in the dermoepidermal junction, rete ridges, pigment-containing cells, and/or melanocyte granules that occur in melanoma are recognizable with dermoscopy.6
In 2001, Bafounta and colleagues performed the first meta-analysis on the efficacy of dermoscopy compared with that of clinical evaluation, finding that dermoscopy performed specifically by dermatology-trained clinicians improved the accuracy of identifying melanoma from an odds ratio of 16 (95% CI, 9-31) with naked eye examination to 76 (95% CI, 25-223) with dermoscopy.7
More recently, Terushkin and colleagues demonstrated that diagnosis specificity improves when a general dermatologist is trained in dermoscopic pattern recognition. Naked eye examination produced a benign to malignant ratio (BMR) of 18.4:1, indicating that about 18 of 19 biopsies considered suspicious for melanoma ultimately yielded benign melanocytic lesions. Although the BMR for the general dermatologist experienced an increase after dermoscopy training, the ratio eventually decreased to 7.9:1.8
Dermoscopic Analysis
Some of the common patterns recognized in melanoma are demonstrated in Figures 1 and 2. Figure 1 is a close-up of a patient’s upper back showing a solitary asymmetric melanocytic lesion containing multiple red, brown, black, and blue hues.
Pattern analysis, the dermoscopic interpretation method preferred by pigmented lesion specialists, requires simultaneously assessing numerous lesion patterns that vary depending on body site.10 Alternative dermoscopic algorithms that focus on the most common features of melanoma have been developed to aid practitioners with the interpretation of dermoscopy findings: the 7-point checklist, the Menzies method, the ABCD rule, and the CASH algorithm (Tables 2, 3, 4, and 5).
Argenziano and colleagues developed the 7-point checklist in 1998. Two points are assigned to the lesion for each of the major criteria and 1 point for each minor criteria.
The Menzies method was developed by Menzies and colleagues in 1996. To be classified as melanoma, the pigmented lesion must show an absence of pattern symmetry and color uniformity while simultaneously exhibiting at least one of the following: blue-white veil, multiple brown dots, pseudopods, radial streaming, scarlike depigmentation, peripheral block dots/globules, 5 to 6 colors, multiple blue/gray dots, and a broadened network.12
The ABCD rule is a more technical dermoscopic evaluation algorithm developed in 1994 by Stolz and colleagues. This method yields a numeric value called the total dermoscopic score (TDS) based on Asymmetry, Border pigment pattern, Color variation, and 5 Different structural components.
Henning and colleagues developed the CASH algorithm in 2006 with the intention of assisting less experienced dermoscopy users with lesion evaluation.14 This algorithm tallies points for Color, Architectural disorder, Symmetry, and Homogeneity. One point is attributed to a lesion for each light brown, dark brown, black, red, white, and/or blue region present. Architectural disorder is assigned a point value between 0 and 2, with 0 indicating the absence of or minimal architectural disorder, 1 indicating moderate disorder, and 2 indicating marked disorder. Symmetry is assigned a point value between 0 and 2, with 0 points assigned to a lesion that exhibits biaxial symmetry, 1 point assigned to a lesion that exhibits monoaxial symmetry, and 2 points assigned to a lesion that exhibits biaxial asymmetry. Finally, 1 point is attributed to a lesion for evidence of each of the following: atypical network, dots/globules, streaks/pseudopods, blue-white veil, regression structures, blotches > 10% of the overall lesion size, and polymorphous blood vessels. The lesion in Figure 2 scores 16 points out of the maximum total CASH score of 17. Any lesion scoring 8 or more is suggestive of malignant melanoma.14
Finally, the TADA method was developed by Rogers and colleagues in 2016.15 This method uses sequential questions to evaluate lesions. First, “Does the lesion exhibit clear dermoscopic evidence of an angioma, dermatofibroma, or seborrheic keratosis?” If “yes,” then no additional dermoscopic evaluation is necessary, and it is recommended to monitor the lesion. If the answer to the first question is “no,” then ask, “Does the lesion exhibit architectural disorder?” The presence of architectural disorder is based on an overall impression of the lesion, which includes symmetry with regard to structures and colors. Any lesion deemed to exhibit architectural disorder should be biopsied. If the lesion has no architectural disorder, the third question is, “Does the lesion contain any starburst patterns, blue-black or gray coloration, shiny white structures, negative networks, ulcers or erosions, and/or vessels?” If “yes,” then the lesion should be biopsied. Since the lesion in Figure 2 exhibits marked architectural disorder in terms of symmetry and color, analysis of the lesion with the TADA method would yield a recommendation for biopsy.15
Dermoscopy in Practice
A. Bernard Ackerman, MD, a key figure in the modern era of dermatopathology, wrote an editorial for the Journal of the American Academy of Dermatology in 1985 titled “No one should die of malignant melanoma.” The editorial highlighted that the visual changes associated with melanoma often manifest years prior to malignant invasion and advocated that all physicians should have competence in melanoma detection, specifically mentioning the importance of training primary care physicians (PCPs), dermatologists, and pathologists in this regard.16 This sentiment is equally as true now as it was in 1985.
Naked eye examination paired with an evaluation of patient risk factors for melanoma, including fair skin types, significant sun exposure history, history of sunburn, geographic location, and personal and family history of melanoma, are the foundation of melanoma detection efforts.17 Studies suggest that the triage skills of PCPs could be improved in regard to the evaluation of pigmented lesions. Primary care residents, for instance, did not accurately diagnose 40% of malignant melanoma cases.18,19 Additionally, a meta-analysis demonstrated that PCP accuracy when diagnosing malignant melanoma ranged between 49% and 80%, significantly less than the 85% to 89% exhibited by practicing dermatologists.19 Dermoscopy could be incorporated as an element of the skin examination to enhance lesion discrimination among PCPs, as it has proven use in dermatologic practice.
Dermoscopy is not readily used by PCPs. A survey study of 705 family practitioners in the US performed by Morris and colleagues demonstrated that only 8.3% of participants currently use a dermatoscope to evaluate pigmented lesions.20 The most common barriers to dermoscopy use cited by PCPs in the US include the cost of the dermatoscope, the time required to acquire proficiency, and the lack of financial reimbursement.16 True utilization of dermoscopy among PCPs is higher than this figure suggests due to the number of PCPs who access dermoscopic evaluations via teledermatology. All 21 Veterans Integrated Services Networks of the Veterans Health Administration (VHA) system, for instance, participate in teledermatology and jointly employ more than 1,150 trained telehealth clinical technicians who created a collective 107,000 teledermatology encounters with and without dermoscopy for evaluation by dermatologists in the most recent fiscal year(Martin Weinstock, written communication, October 2017). Nonetheless, it is necessary to determine the contribution that wider utilization of dermoscopy among PCPs would have on melanoma surveillance.
Studies show that dermoscopic algorithms improve the sensitivity while slightly decreasing the specificity of PCPs to detect melanoma compared with that of the naked eye examination. Dolianitis and colleagues demonstrated that a baseline sensitivity of 60.9% for melanoma detection improved to 85.4% with the 7-point checklist, 85.4% with Menzies method, and 77.5% with the ABCD rule, while the baseline specificity of 85.4% moderated to 73.0%, 77.7%, and 80.4%, respectively, among 61 medical practitioners after studying dermoscopy techniques from 2 CDs.21 Westerhoff and colleagues performed a randomized controlled trial with 74 PCPs to determine the effect of a minimal intervention on melanoma diagnostic accuracy. The intervention consisted of providing participants in the experimental group with an atlas of microscopic features common to melanoma to be read at the participants’ leisure, a 1-hour presentation on microscopy, and a 25-questionpractice quiz. Participants randomized to the intervention group improved their diagnostic accuracy from 57.8% to 75.9% with the use of dermoscopy. This group also experiencedimproved accuracy in its clinical diagnosis of melanoma from 54.6% to 62.7%.22
Argenziano and colleagues demonstrated similar results after PCPs attended a 4-hour workshop on dermoscopy. The 73 PCPs in this study evaluated 2,522 lesions randomized to naked eye examination or dermoscopy. The BMR, calculated from the data provided, improved from 12.6:1 to 10.5:1, respectively, when dermoscopy was incorporated into lesion analysis, while the sensitivity increased from 54.1% to 79.2% and the negative predictive value increased from 95.8% to 98.1%. It is important to note that the BMR and negative predictive value improved in tandem, indicating that PCPs were more discriminatory with their referrals for evaluation by dermatology while capturing a greater percentage of melanomas.23
These studies are not without limitations that preclude broad generalizations. For example, Dolianitis and colleagues and Westerhoff and colleagues provided participants with dermoscopic images of the lesions to be evaluated instead of requiring personal use of a dermatoscope, whereas the study by Argenziano and colleagues incorporated only 6 histopathologically proven malignant melanomas into each of the naked eye examination and the experimental dermoscopy groups.21-23 Yet these studies suggest that broader use of dermoscopy among PCPs could improve the accuracy of melanoma detection given clinically relevant training.
Several additional studies identify positive correlations associated with dermoscopy use among PCPs. A recent survey of 425 French general practitioners found that 8% of the study participants acknowledged owning a dermatoscope. Dermatoscope owners spent a statistically significant longer time analyzing each pigmented skin lesions, exhibited greater confidence in their analysis of pigmented lesions, and issued fewer overall referrals to dermatologists.24
Similarly, Rosendahl and colleagues evaluated the number needed to treat (NNT) (equivalent to the BMR) among 193 Australian PCPs and found that the NNT was inversely correlated to the frequency with which the physicians used dermoscopy. However, it was difficult to determine the definitive cause of the reduced NNT in this study because a similar effect was observed when NNT was evaluated based on general practitioner subspecialization.25 Again, despite limitations, these studies suggest that increased dermoscopy use among PCPs could reduce the morbidity of lifelong scarring as well as the short-term anxiety associated with a possible melanoma diagnosis.
Limitations
Even in the hands of a trained dermatologist, dermoscopy has limitations. Featureless melanoma is a term applied to melanoma lesions bereft of classical findings on both naked eye examination and dermoscopy. Menzies, a dermatologic pioneer in dermoscopy, acknowledged this limitation in 1996 while showing that 8% of melanomas evaded dermoscopic detection. He proceeded to discuss the importance of clinical history in melanoma detection because all of the featureless melanomas exhibited recent changes in size, shape, and/or color.26 More recently, sequential dermoscopy (mole mapping) imaging has been implemented to successfully identify these lesions.27 Thus, dermoscopy cannot replace dermatologists trained in the art of visual assessment with honed clinical diagnostic acumen. Rather, dermoscopy is a tool to enhance the assessment of clinically suspicious lesions and aid diagnostic discrimination of uncertain pigmented lesions.
Conclusion
Primary care physicians are on the frontline of medicine and often the first to have the opportunity to detect the presence of melanoma. Notably, 52.2% of the 884.7 million medical office visits performed annually in the US are with PCPs.28 Despite the benefits, dermoscopy is not uniformly used by dermatologists in the US. Of dermatologists practicing for more than 20 years, 76.2% use dermoscopy compared with 97.8% of dermatologists in practice for less than 5 years. This illustrates an increased use in tandem with dermatology residencies integrating dermoscopy training as a component of the curriculum, showing the importance of incorporating dermoscopy into medical school and residency training for PCPs..29-31 Guidelines regarding dermoscopy training and dermoscopic evaluation algorithms should be established, routinely taught in medical education, and actively incorporated into training curriculum for PCPs in order to improve patient care and realize the potential health care savings associated with the early diagnosis and treatment of melanoma. Dermoscopic-teledermatology consultations present a viable opportunity within the VHA to expedite access to care for veterans and simultaneously offer evaluative feedback on lesions to referring PCPs, as skilled, dermoscopy-trained dermatologists render the diagnoses. Given the devastating mortality rate of melanoma, continued multidisciplinary education on identifying melanoma is of the utmost importance for patient care. Widespread implementation of dermoscopy and dermoscopic-teledermatology consultations could save lives and slow the ever-increasing economic burden associated with melanoma treatment, costing $1.467 billion in 2016.32
1. Guy GP Jr, Thomas CC, Thompson T, Watson M, Massetti GM, Richardson LC. Vital signs: melanoma incidence and mortality trends and projections-United States, 1982-2030. MMWR Morb Mortal Wkly Rep. 2015;64(21):591-596.
2. Siegel RL, Miller KD, Jemal A. Cancer statistics, 2018. CA Cancer J Clin. 2018;68(1):7-30.
3. American Cancer Society. Cancer facts & figures 2017. Atlanta: American Cancer Society; 2017. https://www.cancer.org/content/dam/cancer-org/research/cancer-facts-and-statistics/annual-cancer-facts-and-figures/2017/cancer-facts-and-figures-2017.pdf. Accessed April 19, 2018.
4. Lea CS, Efird JT, Toland AE, Lewis DR, Phillips CJ. Melanoma incidence rates in active duty military personnel compared with a population-based registry in the United States, 2000-2007. Mil Med. 2014;179(3):247-253.
5. Thomas L, Puig S. Dermoscopy, digital dermoscopy and other diagnostic tools in the early detection of melanoma and follow-up of high-risk skin cancer patients. Acta Derm Venereol. 2017;97(218):14-21.
6. Marghoob AA, Usatine RP, Jaimes N. Dermoscopy for the family physician. Am Fam Physician. 2013;88(7):441-450.
7. Bafounta ML, Beauchet A, Aegerter P, Saiag P. Is dermoscopy (epiluminescence microscopy) useful for the diagnosis of melanoma? Results of a meta-analysis using techniques adapted to the evaluation of diagnostic tests. Arch Dermatol. 2001;137(10):1343-1350.
8. Terushkin V, Warycha M, Levy M, Kopf AW, Cohen DE, Polsky D. Analysis of the benign to malignant ratio of lesions biopsied by a general dermatologist before and after the adoption of dermoscopy. Arch Dermatol. 2010;146(3):343-344.
9. Wolner ZJ, Yélamos O, Liopyris K, Rogers T, Marchetti MA, Marghoob AA. Enhancing skin cancer diagnosis with dermoscopy. Dermatol Clin. 2017;35(4):417-437.
10. Carli P, Quercioli E, Sestini S, et al. Pattern analysis, not simplified algorithms, is the most reliable method for teaching dermoscopy for melanoma diagnosis to residents in dermatology. Br J Dermatol. 2003;148(5):981-984.
11. Argenziano G, Fabbrocini G, Carli P, De Giorgi V, Sammarco E, Delfino M. Epiluminescence microscopy for the diagnosis of doubtful melanocytic skin lesions. Comparison of the ABCD rule of dermatoscopy and a new 7-point checklist based on pattern analysis. Arch Dermatol. 1998;134(12):1563-1570.
12. Menzies SW, Ingvar C, Crotty KA, McCarthy WH. Frequency and morphologic characteristics of invasive melanomas lacking specific surface microscopic features. Arch Dermatol. 1996;132(10):1178-1182.
13. Nachbar F, Stolz W, Merkle T, et al. The ABCD rule of dermatoscopy. High prospective value in the diagnosis of doubtful melanocytic skin lesions. J Am Acad Dermatol. 1994;30(4):551-559.
14. Henning JS, Dusza SW, Wang SQ, et al. The CASH (color, architecture, symmetry, and homogeneity) algorithm for dermoscopy. J Am Acad Dermatol. 2007;56(1):45-52.
15. Rogers T, Marino M, Dusza SW, Bajaj S, Marchetti MA, Marghoob A. Triage amalgamated dermoscopic algorithm (TADA) for skin cancer screening. Dermatol Pract Concept. 2017;7(2):39-46.
16. Ackerman AB. No one should die of malignant melanoma. J Am Acad Dermatol. 1985;12(1):115-116.
17. Gandini S, Sera F, Cattaruzza MS, et al. Meta-analysis of risk factors for cutaneous melanoma: II: sun exposure. Eur J Cancer. 2005;41(1):45-60.
18. Gerbert B, Maurer T, Berger T, et al. Primary care physicians as gatekeepers in managed care. Primary care physicians’ and dermatologists’ skills at secondary prevention of skin cancer. Arch Dermatol. 1996;132(9):1030-1038.
19. Corbo MD, Wismer J. Agreement between dermatologists and primary care practitioners in the diagnosis of malignant melanoma: review of the literature. J Cutan Med Surg. 2012;16(5):306-310.
20. Morris JB, Alfonso SV, Hernandez N, Fernández MI. Examining the factors associated with past and present dermoscopy use among family physicians. Dermatol Pract Concept. 2017;7(4):63-70.
21. Dolianitis C, Kelly J, Wolfe R, Simpson P. Comparative performance of 4 dermoscopic algorithms by nonexperts for the diagnosis of melanocytic lesions. Arch Dermatol. 2005;141(8):1008-1014.
22. Westerhoff K, Mccarthy WH, Menzies SW. Increase in the sensitivity for melanoma diagnosis by primary care physicians using skin surface microscopy. Br J Dermatol. 2000;143(5):1016-1020.
23. Argenziano G, Puig S, Zalaudek I, et al. Dermoscopy improves accuracy of primary care physicians to triage lesions suggestive of skin cancer. J Clin Oncol. 2006;24(12):1877-1882.
24. Chappuis P, Duru G, Marchal O, Girier P, Dalle S, Thomas L. Dermoscopy, a useful tool for general practitioners in melanoma screening: a nationwide survey. Br J Dermatol. 2016;175(4):744-750.
25. Rosendahl C, Williams G, Eley D, et al. The impact of subspecialization and dermatoscopy use on accuracy of melanoma diagnosis among primary care doctors in Australia. J Am Acad Dermatol. 2012;67(5):846-852.
26. Menzies SW, Ingvar C, Crotty KA, McCarthy WH. Frequency and morphologic characteristics of invasive melanomas lacking specific surface microscopic features. Arch Dermatol. 1996;132(10):1178-1182.
27. Kittler H, Guitera P, Riedl E, et al. Identification of clinically featureless incipient melanoma using sequential dermoscopy imaging. Arch Dermatol. 2006;142(9):1113-1119.
28. Centers for Disease Control and Prevention. Ambulatory care use and physician office visits. https://www.cdc.gov/nchs/fastats/physician-visits.htm. Updated May 3, 2017. Accessed April 10, 2018.
29. Murzaku EC, Hayan S, Rao BK. Methods and rates of dermoscopy usage: a cross-sectional survey of US dermatologists stratified by years in practice. J Am Acad Dermatol. 2014;71(2):393-395.
30. Nehal KS, Oliveria SA, Marghoob AA, et al. Use of and beliefs about dermoscopy in the management of patients with pigmented lesions: a survey of dermatology residency programmes in the United States. Melanoma Res. 2002;12(6):601-605.
31. Wu TP, Newlove T, Smith L, Vuong CH, Stein JA, Polsky D. The importance of dedicated dermoscopy training during residency: a survey of US dermatology chief residents. J Am Acad Dermatol. 2013;68(6):1000-1005.
32. Lim HW, Collins SAB, Resneck JS Jr, et al. The burden of skin disease in the United States. J Am Acad Dermatol. 2017;76(5):958-972
Adding bortezomib does not improve MCL outcomes
Bortezomib added to an alternating chemoimmunotherapy regimen did not improve time to treatment failure in patients with newly diagnosed mantle cell lymphoma (MCL), results of a phase 2 study have suggested.
Response rates and time to treatment failure were similar to what has been seen historically without the addition of bortezomib, according to study investigator Jorge E. Romaguera, MD, of the University of Texas MD Anderson Cancer Center, Houston, and his colleagues.
The phase 2 study included 95 patients with newly diagnosed MCL treated with alternating cycles of bortezomib added to rituximab plus hyperfractionated cyclophosphamide, vincristine, doxorubicin, and dexamethasone (BzR-hyperCVAD) and bortezomib added to rituximab plus high-dose methotrexate and high-dose cytarabine (BzR-MA).
Of 87 patients evaluable for response, alternating BzR-hyperCVAD/BzR-MA resulted in an overall response rate of 100% and a complete response rate of 82%, Dr. Romaguera and his colleagues reported in the journal Cancer. At a median follow-up of 44 months, median time to treatment failure was 55 months, and median overall survival had not yet been reached, according to the report.
Dr. Romaguera and his coauthors compared these results with those from a previous study of alternating R-hyperCVAD/R-MA, in which the median time to treatment failure was 56.4 months. “This suggests that the addition of bortezomib does not improve the outcome,” they wrote in the current report.
Although more follow-up is needed, the landscape of MCL treatment is changing quickly, they added. In particular, lenalidomide and ibrutinib, already approved for relapsed/refractory MCL, are now being evaluated as part of first-line MCL regimens. “These drugs will offer strategies of either consolidation or maintenance after induction and will hopefully help continue to improve the duration of the initial response and the overall outcome,” the researchers wrote.
In the current phase 2 study, the fact that 100% of patients achieved complete response suggested that relapses come from minimal residual disease, which “has clearly become a clinical factor for the outcomes of patients with MCL and will likely become the next endpoint,” they wrote.
The researchers reported having no financial disclosures related to the study, which was supported by Takeda Oncology.
SOURCE: Romaguera JE et al. Cancer. 2018 May 3. doi: 10.1002/cncr.31361.
FROM CANCER
Key clinical point:
Major finding: Rates of overall and complete response were 100% and 82%, respectively, while time to treatment failure was 55 months.
Study details: A phase 2 trial that included 95 patients treated with alternating cycles of bortezomib added to rituximab plus hyperfractionated cyclophosphamide, vincristine, doxorubicin, and dexamethasone (BzR-hyperCVAD) and bortezomib added to rituximab plus high-dose methotrexate and high-dose cytarabine (BzR-MA).
Disclosures: The study was supported by Takeda Oncology. The researchers reported having no financial disclosures related to the study.
Source: Romaguera JE et al. Cancer. 2018 May 3. doi: 10.1002/cncr.31361