User login
Thermal Therapy is Associated With Decreased Pain Treatment Use: A Retrospective Cohort Study
Thermal Therapy is Associated With Decreased Pain Treatment Use: A Retrospective Cohort Study
Growing recognition of the limitations of long-term opioid therapy for chronic noncancer pain has highlighted the importance of nonpharmacologic approaches to pain treatment.1,2 These treatments are varied and may include psychological and behavioral therapies (eg, cognitive behavioral therapy for chronic pain), exercise and movement therapies (eg, yoga), and manual therapies (eg, chiropractic). Body surface cold therapy, while predominantly used to reduce postoperative pain and inflammation,3,4 pain subsequent to acute musculoskeletal injury,5 and pain related to muscle soreness,6 is a nonpharmacologic treatment that has shown pain-reducing benefits for chronic low back pain and knee osteoarthritis, as has its counterpart, superficial heat therapy.7-9 Heat therapy has also been shown to improve strength, flexibility, and activities of daily living in patients with chronic low back pain.10,11 Cold and heat therapies are commonly used complementarily. Cold therapies aim to reduce blood flow and inflammation and are often used immediately following trauma to an affected area, whereas heat therapies increase blood flow and metabolic activity and are commonly used to promote healing.5
Heat and cold therapies (also known as thermal therapies) benefit resource-limited health care systems, as most devices require a single expenditure and can be self-administered by patients at home as part of their pain self-management plan. In addition, these pain self-management tools may attenuate the need for more expensive specialty pain care and ongoing analgesic pharmacotherapy. Despite their potential, few studies have characterized the benefits of thermal therapies for patients with heterogeneous chronic pain syndromes.
The purpose of this retrospective cohort study was to examine the potential clinical and health system benefits of patient-administered thermal therapy. Our primary hypothesis was that patients with chronic musculoskeletal pain who received a thermal therapy self-management device would have fewer days of opioid prescriptions compared with a sample of matched control patients. Secondarily, we hypothesized that patients who received a thermal therapy device would have lower utilization of specialty pain care, fewer potentially hazardous opioid prescriptions (eg, high-dose opioid therapy and concurrent opioid and benzodiazepine prescriptions), fewer prescriptions for nonopioid analgesic medications, and decreased pain intensity when compared with matched controls.
Methods
This retrospective cohort study compared pain pharmacotherapy, pain treatment utilization, and pain intensity outcomes between patients who received a thermal therapy device and matched patients who did not. The study was approved by the US Department of Veterans Affairs (VA) Portland Health Care System Institutional Review Board and was granted a waiver of informed consent to access patient electronic health records (EHRs).
Pain Care
The VA uses ThermaZone thermal therapy devices (Innovative Medical Equipment) for chronic pain treatment. The device uses thermoelectric technology to provide point-of-contact cooling and heating therapy through site-specific pads (eg, ankle, knee, hip, back, elbow, shoulder). Patients place pads on sites where they experience pain, and temperature regulated water circulates through the device and to the pad, providing consistent, localized thermal therapy. The pads range in temperature from 1 °C to 52 °C, and temperatures are self-monitored and controlled by the patient.
Standard pain care in this study followed the VA stepped model of pain care, which builds on a foundation of patient education for pain self-management approaches (eg, exercise, mindfulness, relaxation, social support).12 According to the VA stepped model of pain care, all patients with chronic pain should engage in these foundational self-management approaches. However, some patients require more intensive care. The VA stepped-up treatment engages primary and specialty care services—such as physical therapy, pharmacy, complementary and integrative health approaches, mental health, and substance use services—and, when indicated, may escalate treatment to interdisciplinary pain teams or tertiary pain centers. In this retrospective cohort study, treatment patients received a thermal therapy device and standard of care, whereas control patients received standard care only.
Sample Selection
Eligible patients were aged ≥ 18 years, had a musculoskeletal pain diagnosis documented in the EHR in the year prior to thermal therapy device receipt (or during the same period for a treatment patient’s matched control), and were enrolled in VA health care during the study period. Patients who died during the study period were excluded. Treatment patients received a thermal therapy device from the VA between January 1, 2017, and December 31, 2018, when complete data on thermal therapy devices were available. For control patients, the VA Corporate Data Warehouse (CDW) was used to identify VA patients with characteristics similar to those of treated patients.
We modeled the probability that a patient would receive a thermal therapy device using logistic regression. Predictor variables were measured in the year prior to device receipt and included variables associated with pain treatment utilization and analgesic pharmacotherapy receipt, as recommended by Brookhart et al.13 These included age, sex, race, ethnicity, VA service-connected disability status, comorbidities, receipt of medications for opioid use disorder, pain diagnoses, mental health diagnoses, and substance use disorder diagnoses.14-19
The resulting propensity scores (eg, predicted probabilities) were used to match treatment patients 1:1 with control patients using a nearest-neighbor matching algorithm.20 This procedure matches a control patient with the closest propensity score to that of the corresponding treatment patient. An exact match on VA facility was required (eg, treatment patients and matched controls received care at the same VA facility). Standardized differences were used to assess covariate balance between the matched groups, and kernel density plots of propensity scores tested for sufficient overlap.21 Control patients were selected from a pool of 1,150,149 patients.
Study Variables
The index date was the date the thermal therapy device was released to treatment patients or the same date for the matched controls. Data were extracted from the CDW over a 24-month period: 12 months prior to the index date through 12 months afterwards. Collecting data in the 12 months prior to treatment initiation allowed us to adjust for covariates and provided greater precision, as recommended for observational study designs.22
Treatment conditions were defined dichotomously as receipt vs nonreceipt of a thermal therapy device. The primary outcome was the number of days of opioid use in the 12 months following the index date. Additional outcomes included days of high-dose opioid therapy (≥ 50 mg morphine equivalent [MME] daily), concurrent opioid and benzodiazepine prescriptions, and nonopioid analgesic pharmacotherapy (eg, nonsteroidal anti-inflammatory drugs, acetaminophen, muscle relaxants). All prescription data were based on medication fills obtained from VA pharmacy records. Additional outcomes included the number of visits to physical therapy, occupational therapy, physical medicine and rehabilitation, and interdisciplinary pain clinics, including interventional pain medicine.
Pain intensity ratings were collected as part of routine VA care using a numeric scale from 0 (no pain) to 10 (worst possible pain). Pain intensity trajectories were computed using all available EHR-derived pain intensity score data for each patient in the 12 months prior to and following the index date.
Covariates were extracted from the EHR and evaluated in the year prior to the index date, unless otherwise noted. They included age at the index date; self-reported sex, and race and ethnicity; service-connected disability status (disability awarded as a result of military service-related trauma or injury); Charlson Comorbidity Index; and diagnoses of opioid use disorder, alcohol use disorder, other substance use disorder, mood disorder, posttraumatic stress disorder, other anxiety disorder, psychotic disorder, neuropathic pain, and headache pain.23 All diagnoses were coded as yes if identified in the EHR as a focus of treatment during any clinical encounter in the year prior to the index date or no if not identified as a focus of treatment.
The number of days patients had been living with pain was calculated and defined as the number of days from the first pain diagnosis available in a patient’s EHR to the index date. Finally, the number of pain-related surgeries (eg, surgeries with ≥ 1 pain diagnoses associated with the clinical encounter) and average pain intensity were computed for the pre- and postindex date evaluation periods and included as model covariates.
Statistical Analyses
For the 4 pharmacotherapy and 4 nonpharmacologic treatment usage outcomes, we tested the fit of linear models and several models with count distributions using the Bayesian information criterion.24 Count distributions included Poisson, zero-inflated Poisson, negative binomial, and zero-inflated negative binomial. With 1 exception (days of high-dose opioid use), a negative binomial distribution best fit the data. For days of high-dose opioid use, a Gaussian distribution best fit the data.
Eight separate mixed-effects regression analyses compared changes in each outcome from the 12-month preindex period through the 12-month postindex period between treatment and control patients by testing the Time × Treatment interaction. This approach statistically accounts for observed pretreatment differences in outcome variables. Statistics for the main effects of time and treatment are also presented. To reduce bias, models controlled for covariates specified previously.
For pain intensity, we used random-effects growth modeling to quantify both fixed and random effects of pain intensity at the index date (eg, the model intercept), which estimates pain at the time of treatment initiation, and change in pain during the 12 months following the index date (eg, the model slope), which characterizes the trajectory of pain intensity ratings.25 The model included piecewise components of pain score trajectories in the 12 months prior to the index date and in the 12 months following the index date. Several types of change for the 12-month postindex observation period were explored—including quadratic and cubic curvilinear change. A linear model for change in pain over time provided the best fit based on the Bayesian information criterion and parsimony of model parameters.26 We report estimates of change in pain over time in monthly intervals for ease of interpretation. However, models used all individual pain scores rather than computing monthly averages when > 1 pain score was available within a month, as recommended in previous research.27 This approach makes optimal use of all available data. Both random effects (intercept and slope) were regressed onto the set of covariates described previously.
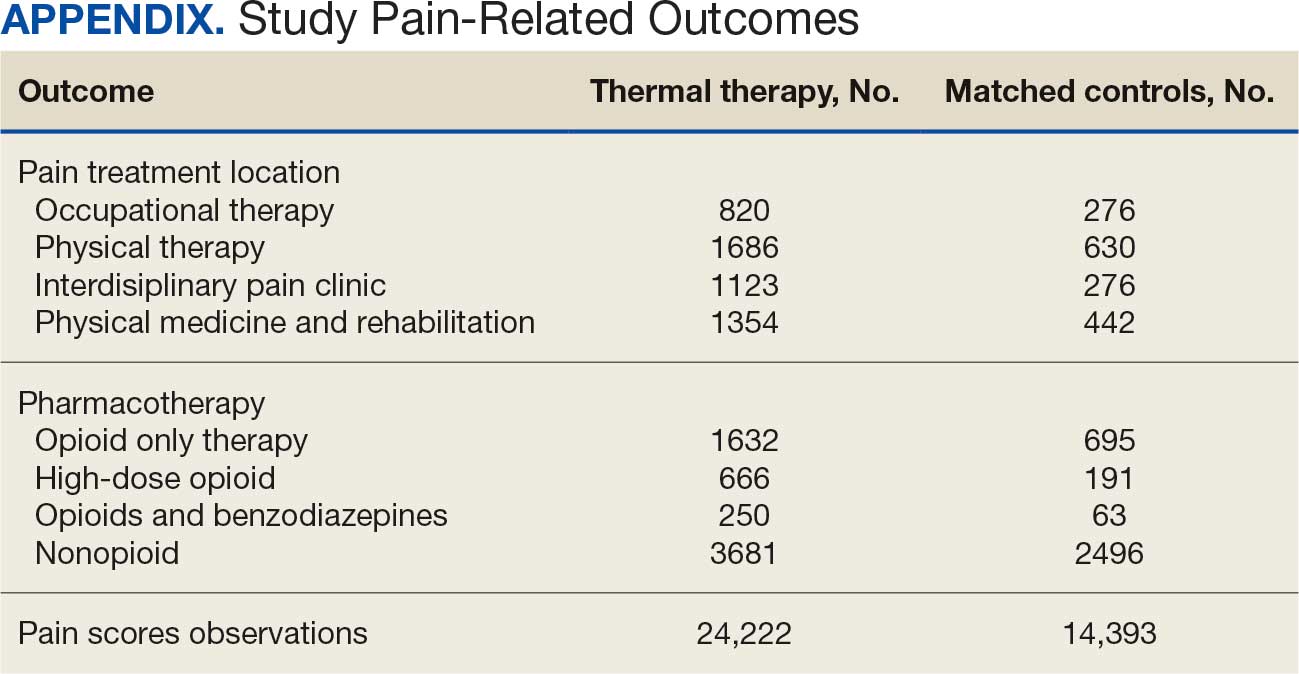
This study used data available in the EHR over the 24-month observation period. We characterize the density (eg, frequency) of all outcome variables by treatment condition in the Appendix. Because the hypotheses were directional, the authors used a 2-sided α = 0.10 and applied a Bonferroni correction for the 9 statistical tests performed, resulting in an adjusted α of 0.01. Treatment utilization and pharmacotherapy outcome analyses were performed in Stata, version 16.1. Random-effects growth modeling of pain score trajectories was performed using Mplus, version 8.8.
Results
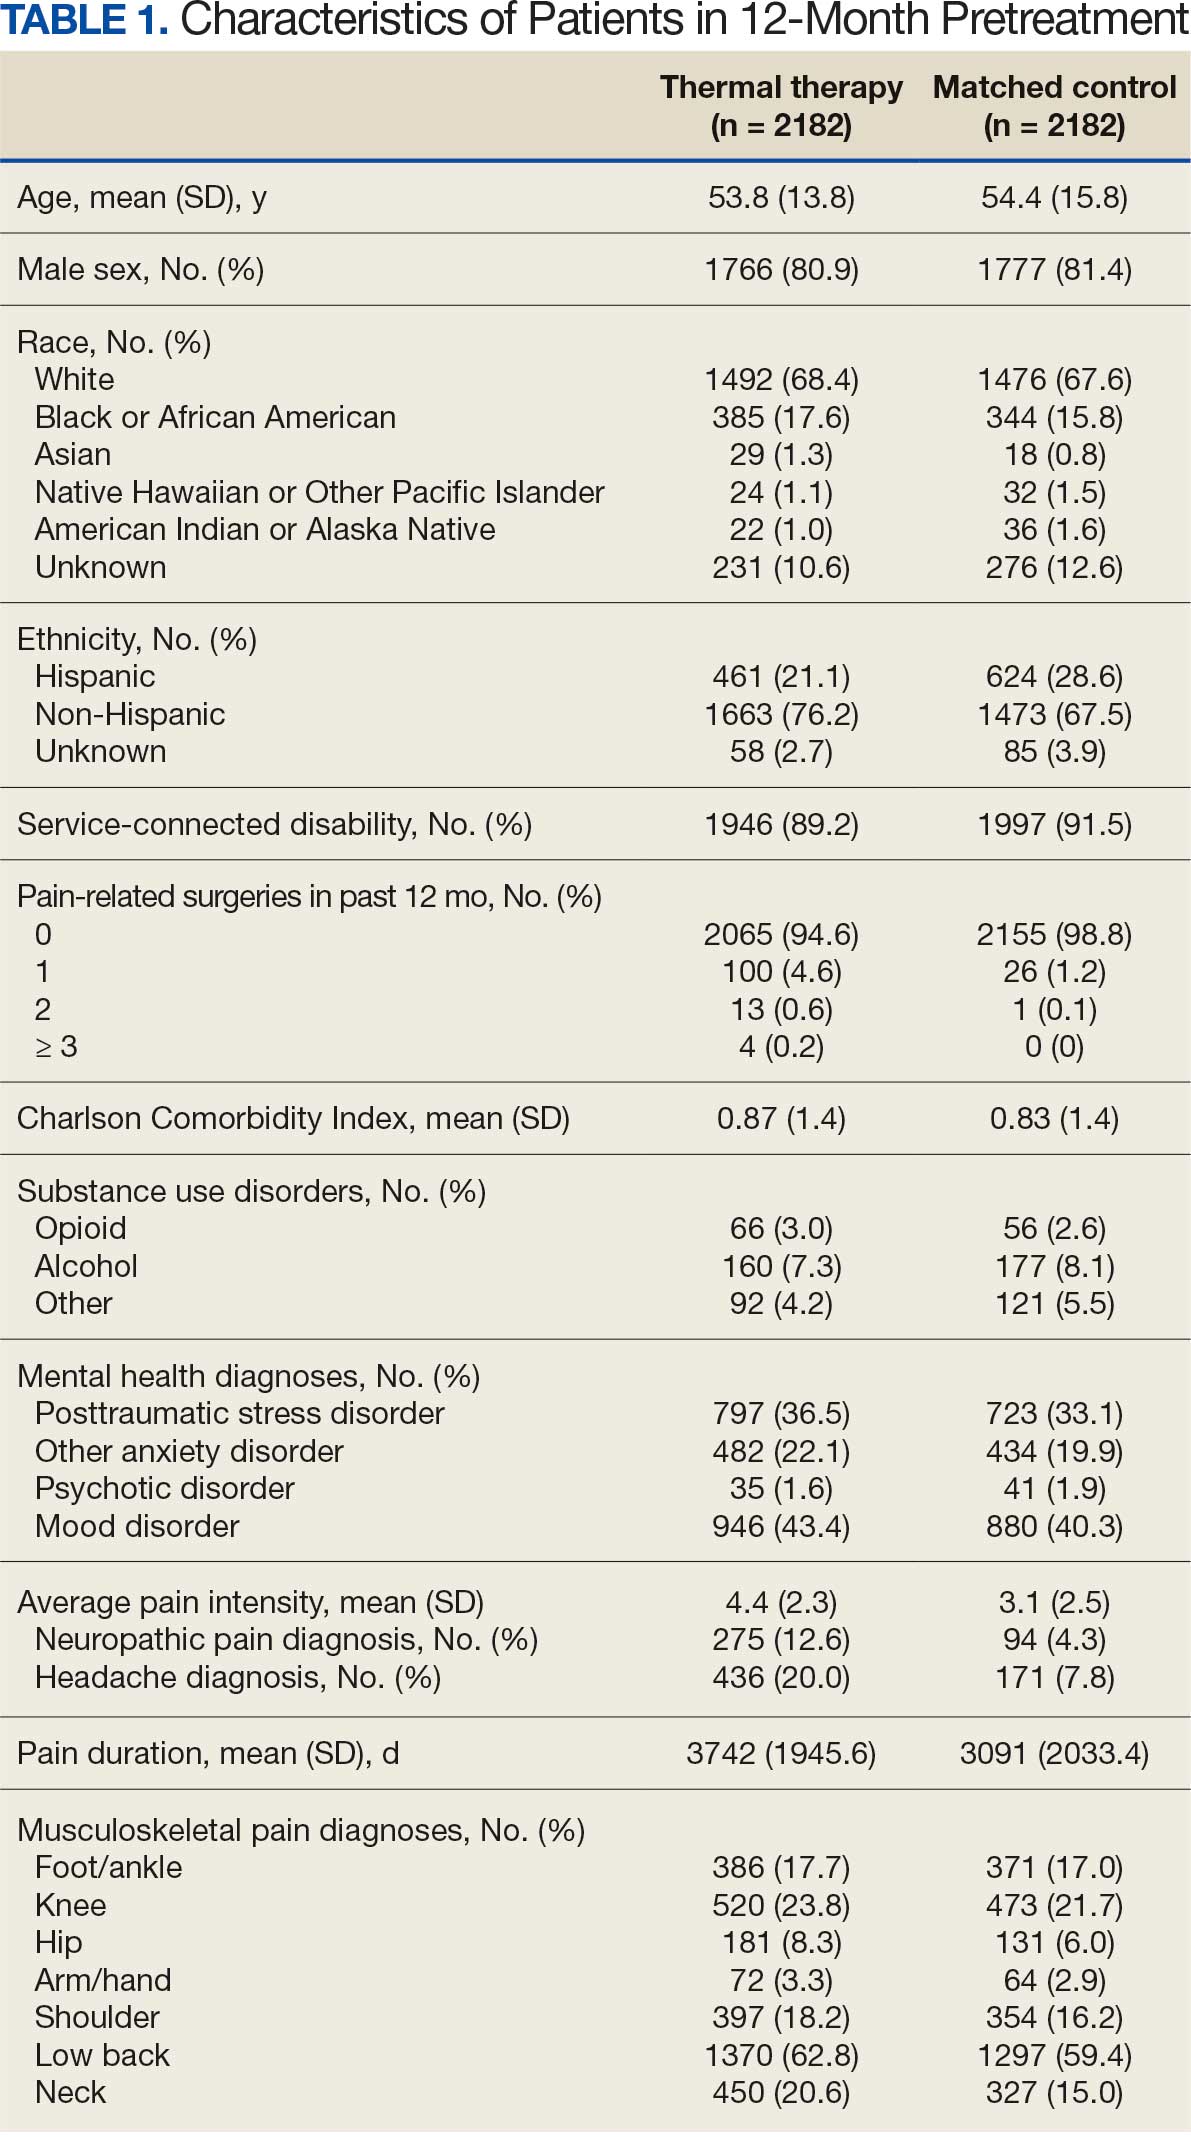
There were 2182 patients in the treatment group and 2182 matched controls. The mean (SD) age was 54 (15) years; 81% were male, and about two-thirds (68%) identified as White and non-Hispanic. Mental health comorbidities were common, with > 40% of the sample having diagnoses of a mood disorder and/or posttraumatic stress disorder. Nearly all patients (90%) had VA service-connected disability ratings. Among patients with chronic musculoskeletal pain, 8% had comorbid neuropathic pain and 14% had headache. The mean (SD) duration of chronic pain across both patient groups was 3416 (2016) days, or about 9.4 years (Table 1).
Pharmacotherapy
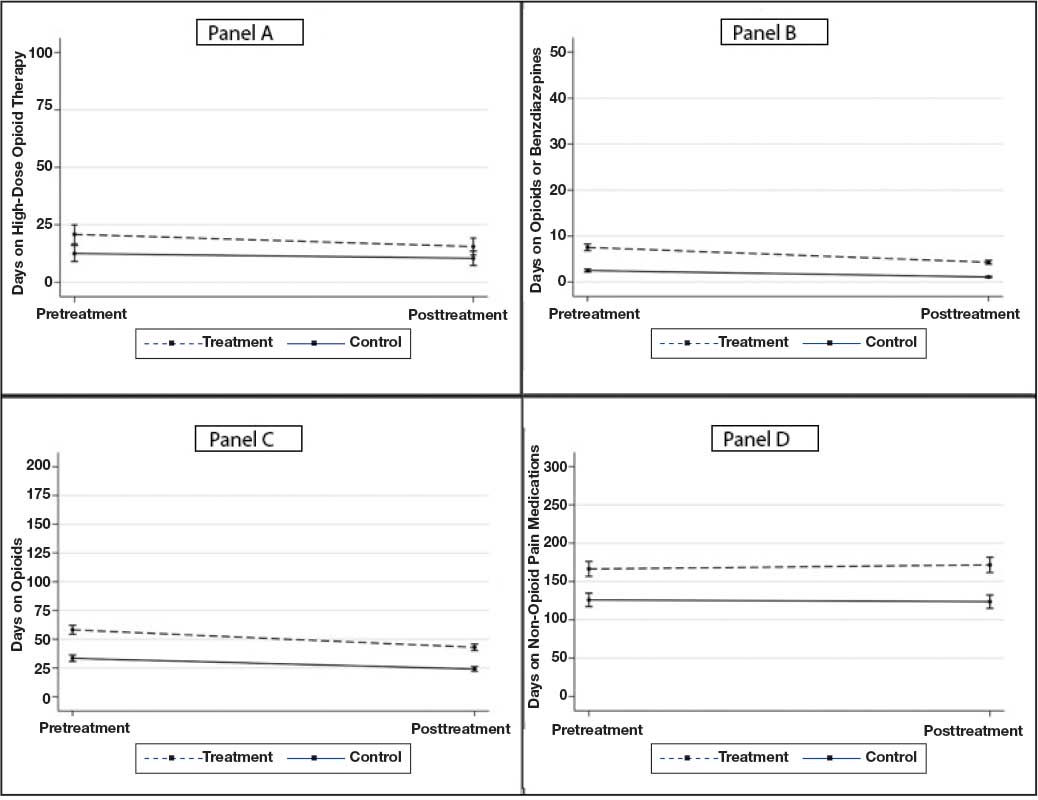
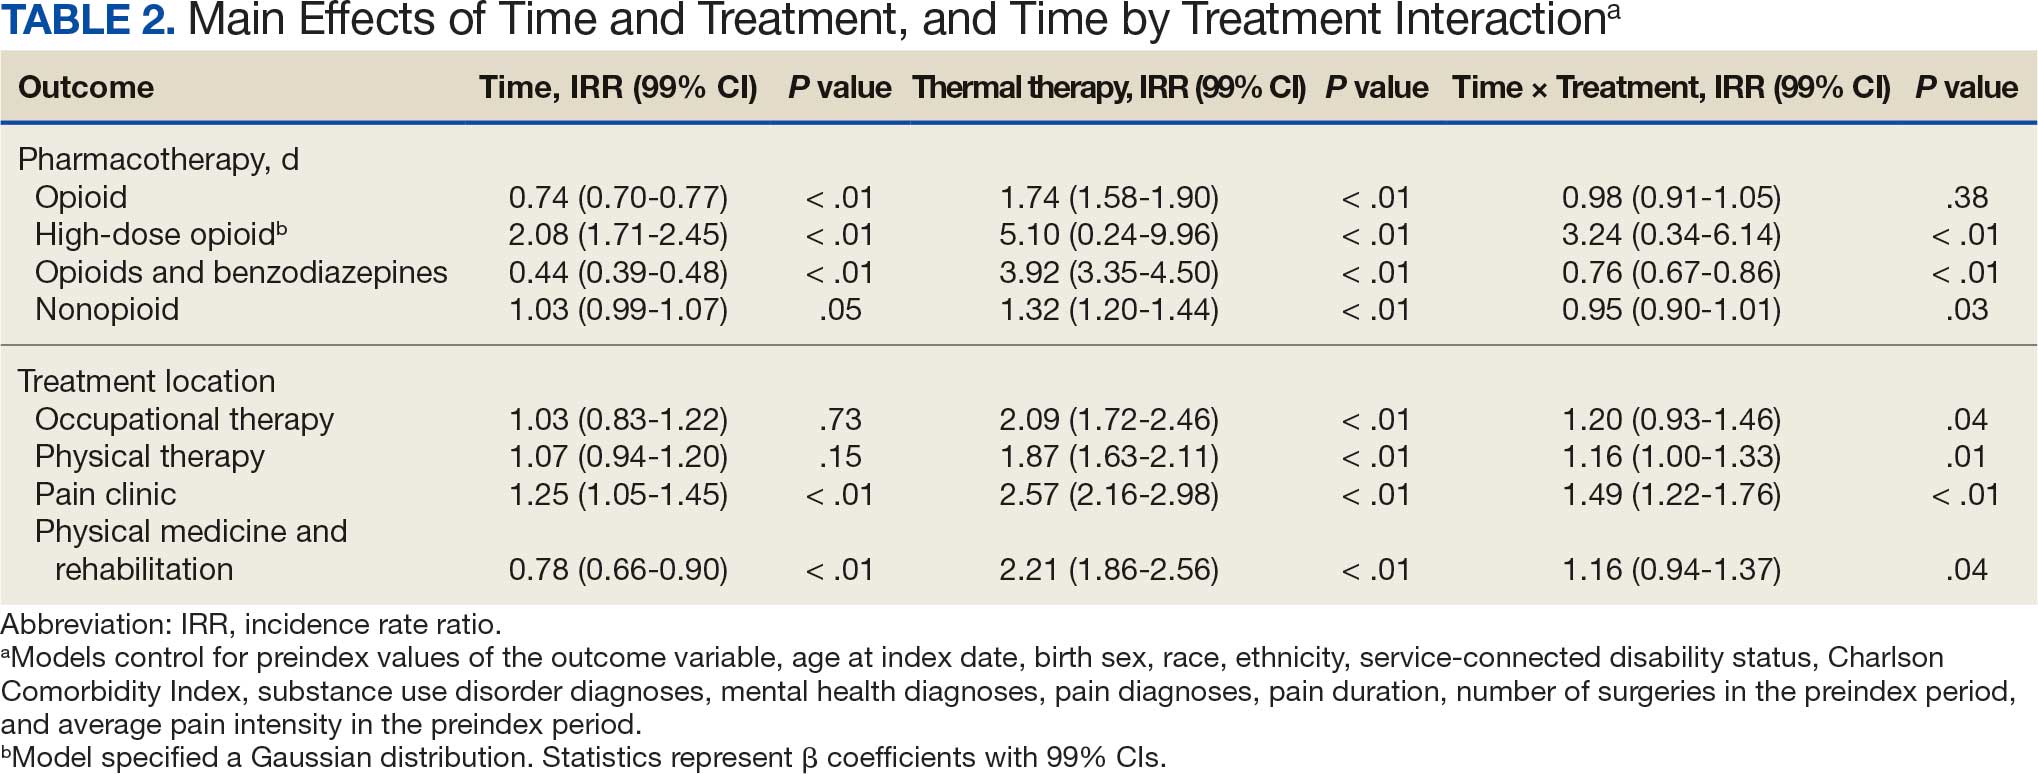
High-dose opioid use (> 50 MME daily dose), days of opioid use, and concurrent opioid and benzodiazepine use decreased for all patients from the pre- to posttreatment period (Table 2). However, high-dose opioid use (Time × Treatment interaction, 3.24; 99% CI, 0.34 to 6.14) (Figure 1A) and concurrent opioid and benzodiazepine use (Time × Treatment interaction, 0.76; 99% CI, 0.67 to 0.86) (Figure 1B) had a larger decrease for the treatment vs matched control group. Treatment and matched control patients had comparable reductions in days of opioid use (Time × Treatment interaction, 0.98; 99% CI, 0.91 to 1.05) (Figure 1C). Neither group showed changes in nonopioid analgesic pharmacotherapy over time (main effect of time, incidence rate ratio [IRR], 1.03; 99% CI, 0.99 to 1.07; Time × Treatment interaction, 0.95; 99% CI, 0.90 to 1.01) (Figure 1D).
Nonpharmacologic Pain Treatment
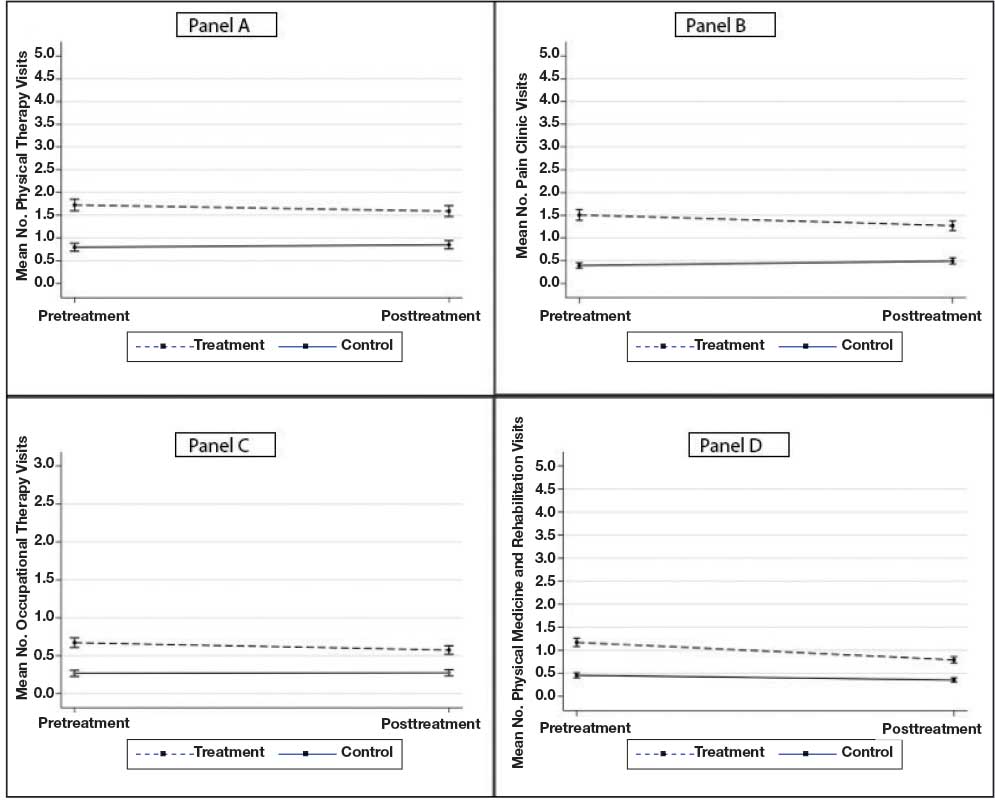
The number of physical therapy and pain clinic visits declined for treatment patients and increased slightly for matched control patients (Figure 2A and 2B). For occupational therapy visits, neither group showed changes over time (main effect of time IRR, 1.03; 99% CI, 0.83 to 1.22; Time × Treatment interaction, 1.20; 99% CI, 0.93 to 1.46) (Figure 2C). For physical medicine and rehabilitation visits, both groups decreased use over time (main effect of time IRR, 0.78; 99% CI, 0.66 to 0.90), but this decrease did not differ between treatment and control patients (Time × Treatment interaction, 1.16; 99% CI, 0.94 to 1.37) (Figure 2D).
Pain Intensity
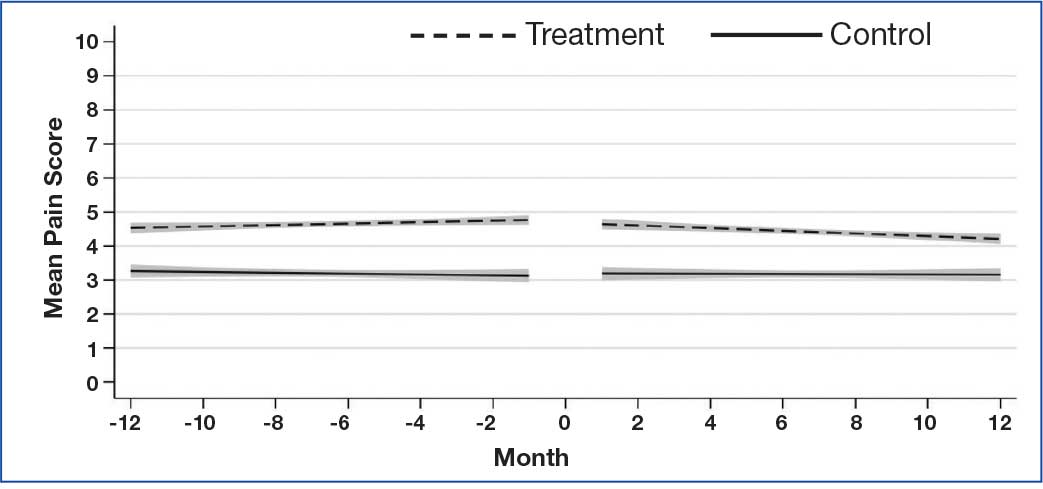
Pain intensity decreased for both groups by an estimated 0.02 points per month (99% CI, -0.04 to -0.01; P < .01), or 0.24 points over the 12-month postindex follow-up period (Figure 3). There were no statistically significant differences between treatment and control patients in pain intensity changes over the follow-up period (B = -0.02; 99% CI, -0.06 to 0.02; P = .15).
Discussion
Patients with musculoskeletal pain who received a thermal therapy device showed a larger decline in use of some specialty pain treatments, including physical therapy and specialty pain clinic services, when compared with matched control patients. One possible explanation is that patients who used the device may have had their pain adequately managed and thus required less specialty pain care. However, the absence of clinically significant changes in pain intensity over time suggests that pain intensity alone did not account for the observed changes in pain treatment use. We were unable to measure constructs of pain interference or functioning, which may be better predictors of functional restoration, as these data are not routinely collected within the VA and documented in the EHR. Future studies could clarify these findings by including measures of pain interference and functioning.
Although the overall declines in physical therapy and specialty pain clinic use associated with thermal therapy were modest (< 1 visit per patient), the impact of these reductions can be profound. In resource-limited health care settings, even small reductions in high-cost care utilization could be of great value in that health systems could offset costs associated with treating chronic pain without compromising quality of care or key clinical outcomes, such as pain intensity. This study, however, did not include a cost analysis. Future studies should incorporate formal cost analyses to quantify cost offsets that may result from decreased specialty pain treatment use.
Patients who received thermal therapy devices did not show clinically meaningful reductions in pain intensity over time, defined as reductions in pain intensity of 1.7 to 2.0 on a 0 to 10 scale.28,29 This finding is consistent with prior research that demonstrates relatively stable pain intensity self-ratings longitudinally by patients with chronic pain diagnoses, when assessed in the context of usual clinical care.30 This finding, however, is inconsistent with prior literature that demonstrates pain-reducing benefits of thermal therapy for low back pain and knee osteoarthritis.7-9
In this study, pain intensity ratings were derived from the EHR during routine outpatient clinical encounters and not at the time thermal therapy was self-administered, as has been done in prior clinical trials.7-9 Pain location was not specified at the time of pain ratings, and it is possible that patients may have been endorsing pain in areas of the body that had not been treated by thermal therapy. Patient-level variability in pain intensity ratings (eg, within-patient range over time) was not examined, although prior research indicates substantial variability.30 While average pain intensity ratings in the current study did not change, an examination of patient variability warrants further study, as a narrowing of pain intensity ratings can be perceived, by patients, as demonstrable improvement and has been associated with improved physical and psychological outcomes.31 Furthermore, pain intensity does not characterize physical or emotional functioning that can be captured with more comprehensive validated measures, some of which are recommended outcomes in pain clinical trials.32
Our findings point to reductions in all forms of opioid use across both treatment and control patients. Data from the VA and in the US more generally point to downward trends in opioid prescribing during the study period.33 This decline is likely due to increased use of risk mitigation approaches, such as routine urine drug screens and review of prescription drug monitoring databases.34 These state-level databases track prescribing of controlled substances, including opioids and benzodiazepines, within a state. Implementation of these practices has been associated with declines in higher risk opioid prescribing.34 Findings from this study further point to associations of reduced higher risk opioid use among patients who received thermal therapy devices. In the full sample of patients, reductions in days of opioid use, high-dose opioid use, and co-use of opioids and benzodiazepines were observed across all patients, with greater reductions observed in high-dose opioid use and concurrent opioid and benzodiazepine use among patients who received a thermal therapy device. Experimental studies indicate that the endogenous opioid system is implicated in pain relief and activated by thermal therapies. 35 Differential reductions in higher-risk opioid use among patients who received thermal therapy devices in our study may be associated with endogenous opioid activation, though this was not specifically measured. It is also unclear whether thermal therapy was provided by clinicians in the context of opioid tapering or other risk mitigation efforts, or patients reduced higher risk opioid use of their own volition. Prior research has identified both patient- and clinician-initiated opioid tapering and discontinuation.36 While a thorough explication of opioid dose reduction was beyond the scope of this study, future qualitative work could help explain potential benefits of thermal therapy in the context of analgesic pharmacotherapy use, including opioid medications.
Limitations
The extent to which patients used the thermal therapy device could not be measured; therefore, device receipt was used as a proxy for use. However, it was not possible to determine whether the frequency and duration of device use was associated with study outcomes. Treatment and control groups demonstrated some differences in outcome variables at the index date. Potential known biases were addressed using propensity score matching procedures and statistical procedures that controlled for patient demographic and clinical characteristics, as well as pretreatment values of all outcome variables. Nevertheless, as an observational study, this analysis cannot account for all known and unknown confounders, and a randomized controlled trial is needed to make claims of causality. The study population consisted of US veterans and included a low proportion of women. As a result, the findings may not be generalizable to other patient populations. Finally, prescription dispensing data, used as a proxy for pharmacotherapy use, do not necessarily reflect actual medication use.
Conclusions
This study is among the first to examine associations between thermal therapy and specialty pain treatment and analgesic pharmacotherapy use among US veterans. Although the retrospective cohort study design does not allow causal inferences regarding the efficacy of thermal therapy for veterans with chronic musculoskeletal pain, confidence in the findings is strengthened by methodological and statistical control of known confounders. Future trials employing experimental designs are needed to further clarify the clinical and health systems benefits of thermal therapy for musculoskeletal pain syndromes.
- Krebs EE, Gravely A, Nugent S, et al. Effect of opioid vs nonopioid medications on pain-related function in patients with chronic back pain or hip or knee osteoarthritis pain: the SPACE randomized clinical trial. JAMA. 2018;2018:872-882. doi:10.1001/jama.2018.0899
- Becker WC, DeBar LL, Heapy AA, et al. A research agenda for advancing non-pharmacological management of chronic musculoskeletal pain: findings from a VHA state-of-the-art conference. J Gen Intern Med. 2018;33:1-15. doi:10.1007/s11606-018-4345-6
- Fernandes IA, Armond ACV, Falci SGM. The effectiveness of the cold therapy (cryotherapy) in the management of inflammatory parameters after removal of mandibular third molars: a meta-analysis. Int Arch Otorhinolaryngol. 2019;23:221-228. doi:10.1055/s-0039-1677755
- Quinlan P, Davis J, Fields K, et al. Effects of localized cold therapy on pain in postoperative spinal fusion patients: a randomized controlled trial. Orthop Nurs. 2017;36:344-349. doi:10.1097/NOR.0000000000000382
- Malanga GA, Yan N, Stark J. Mechanisms and efficacy of heat and cold therapies for musculoskeletal injury. Postgrad Med. 2015;127:57-65. doi:10.1080/00325481.2015.992719
- Wang Y, Li S, Zhang Y, et al. Heat and cold therapy reduce pain in patients with delayed onset muscle soreness: a systematic review and meta-analysis of 32 randomized controlled trials. Phys Ther Sport. 2021;48:177-187. doi:10.1016/j.ptsp.2021.01.004
- Ariana M, Afrasiabifar A, Doulatabad SN, et al. The effect of local heat therapy versus cold rub gel on pain and joint functions in patients with knee osteoarthritis. Clin Nurs Res. 2022;31:1014-1022. doi:10.1177/10547738211035502
- French SD, Cameron M, Walker BF, et al. Superficial heat or cold for low back pain. Cochrane Database Syst Rev. 2006;1:CD004750. doi:10.1002/14651858.CD004750.pub2
- Tao XG, Bernacki EJ. A randomized clinical trial of continuous low-level heat therapy for acute muscular low back pain in the workplace. J Occup Environ Med. 2005;47:1298- 1306. doi:10.1097/01.jom.0000184877.01691.a3
- Freiwald J, Hoppe MW, Beermann W, et al. Effects of supplemental heat therapy in multimodal treated chronic low back pain patients on strength and flexibility. Clin Biomech. 2018;57:107-113. doi:10.1016/j.clinbiomech.2018.06.008
- Freiwald J, Magni A, Fanlo-Mazas P, et al. A role for superficial heat therapy in the management of nonspecific, mild-to-moderate low back pain in current clinical practice: a narrative review. Life. 2021;11:780. doi:10.3390/life11080780
- Kerns RD, Philip EJ, Lee AW, et al. Implementation of the Veterans Health Administration National Pain Management Strategy. Transl Behav Med. 2011;1:635-643. doi:10.1007/s13142-011-0094-3
- Brookhart MA, Schneeweiss S, Rothman KJ, et al. Variable selection for propensity score models. Am J Epidemiol. 2006;163:1149-1156. doi:10.1093/aje/kwj149
- Edlund MJ, Martin BC, Devries A, et al. Trends in use of opioids for chronic non-cancer pain among individuals with mental health and substance use disorders: the TROUP study. Clin J Pain. 2010;26:1-8. doi:10.1097/AJP.0b013e3181b99f35
- Kaur S, Stechuchak KM, Coffman CJ, et al. Gender differences in health care utilization among veterans with chronic pain. J Gen Intern Med. 2007;22:228-233. doi:10.1007/s11606-006-0048-5
- Meghani SH, Cho E. Self-reported pain and utilization of pain treatment between minorities and non-minorities in the United States. Public Health Nurs. 2009;26:307-316. doi:10.1111/j.1525-1446.2009.00785.x
- Morasco BJ, Duckart JP, Carr TP, et al. Clinical characteristics of veterans prescribed high doses of opioid medications for chronic non-cancer pain. Pain. 2010;151:625-632. doi:10.1016/j.pain.2010.08.002
- Nielsen S, Lintzeris N, Bruno R, et al. Benzodiazepine use among chronic pain patients prescribed opioids: associations with pain, physical and mental health, and health service utilization. Pain Med. 2015;16:356-366. doi:10.1111/pme.12594
- Quinn PD, Hur K, Chang Z, et al. Incident and long-term opioid therapy among patients with psychiatric conditions and medications: a national study of commercial health care claims. Pain. 2017;158:140-148. doi:10.1097/j.pain.0000000000000730
- Rubin DB. Matching to remove bias in observational studies. Biometrics. 1973;29:159-183.
- Rosenbaum PR, Rubin DB. Constructing a control group using multivariate matched sampling methods that incorporate the propensity score. Am Stat. 1985;39:33-38. doi:10.1007/s11596-025-00052-0
- Steiner PM, Cook TD, Shadish WR, et al. The importance of covariate selection in controlling for selection bias in observational studies. Psychol Methods. 2010;15:250-267. doi:10.1037/a0018719
- Charlson ME, Pompei P, Ales KL, et al. A new method of classifying prognostic comorbidity in longitudinal studies: development and validation. J Chronic Dis. 1987;40:373- 383. doi:10.1016/0021-9681(87)90171-8
- Long JS, Freese J. Regression Models for Categorical Dependent Variables Using Stata. 3rd ed. Stata Press; 2014.
- Muthén LK, Muthén BO. Mplus User’s Guide. 8th ed. Muthén & Muthén; 1998-2017.
- Hedeker D, Gibbons RD. Longitudinal Data Analysis. Wiley; 2006.
- Dobscha SK, Morasco BJ, Kovas AE, et al. Short-term variability in outpatient pain intensity scores in a national sample of older veterans with chronic pain. Pain Med. 2015;16:855-865. doi:10.1111/pme.12643
- Bahreini M, Safaie A, Mirfazaelian H, et al. How much change in pain score does really matter to patients? Am J Emerg Med. 2020;38:1641-1646. doi:10.1016/j.ajem.2019.158489
- Suzuki H, Aono S, Inoue S, et al. Clinically significant changes in pain along the pain intensity numerical rating scale in patients with chronic low back pain. PLoS One. 2020;15:e0229228. doi:10.1371/journal.pone.0229228
- McPherson SM, Smith CL, Dobscha SK, et al. Changes in pain intensity after discontinuation of long-term opioid therapy for chronic noncancer pain. Pain. 2018;159:2097- 2104. doi:10.1097/j.pain.0000000000001315
- Andrews NE, Strong J, Meredith PJ. Activity pacing, avoidance, endurance, and associations with patient functioning in chronic pain: a systematic and meta-analysis. Arch Phys Med Rehabil. 2012;93:2109-121. doi:10.1016/j.apmr.2012.05.029
- Dworkin RH, Turk DC, Farrar JT, et al. Core outcome measures for chronic pain clinical trials: IMMPACT recommendations. Pain. 2005;113:9-19. doi:10.1016/j.pain.2004.09.012
- Gellad WF, Good CB, Shulkin DJ. Addressing the opioid epidemic in the United States: Lessons from the Department of Veterans Affairs. JAMA Intern Med. 2017;177:611- 612. doi:10.1001/jamainternmed.2017.0147
- Lin LA, Bohnert ASB, Kerns RD, et al. Impact of the Opioid Safety Initiative on opioid-related prescribing in veterans. Pain. 2017;158:833-839. doi:10.1097/j.pain.0000000000000837
- Sirucek L, Price RC, Gandhi W, et al. Endogenous opioids contribute to the feeling of pain relief in humans. Pain. 2021;162:2821-2831. doi:10.1097/j.pain.0000000000002285
- Lovejoy TI, Morasco BJ, Demidenko MI, et al. Reasons for discontinuation of long-term opioid therapy in patients with and without substance use disorders. Pain. 2017;158:526- 534. doi:10.1097/j.pain.0000000000000796
Growing recognition of the limitations of long-term opioid therapy for chronic noncancer pain has highlighted the importance of nonpharmacologic approaches to pain treatment.1,2 These treatments are varied and may include psychological and behavioral therapies (eg, cognitive behavioral therapy for chronic pain), exercise and movement therapies (eg, yoga), and manual therapies (eg, chiropractic). Body surface cold therapy, while predominantly used to reduce postoperative pain and inflammation,3,4 pain subsequent to acute musculoskeletal injury,5 and pain related to muscle soreness,6 is a nonpharmacologic treatment that has shown pain-reducing benefits for chronic low back pain and knee osteoarthritis, as has its counterpart, superficial heat therapy.7-9 Heat therapy has also been shown to improve strength, flexibility, and activities of daily living in patients with chronic low back pain.10,11 Cold and heat therapies are commonly used complementarily. Cold therapies aim to reduce blood flow and inflammation and are often used immediately following trauma to an affected area, whereas heat therapies increase blood flow and metabolic activity and are commonly used to promote healing.5
Heat and cold therapies (also known as thermal therapies) benefit resource-limited health care systems, as most devices require a single expenditure and can be self-administered by patients at home as part of their pain self-management plan. In addition, these pain self-management tools may attenuate the need for more expensive specialty pain care and ongoing analgesic pharmacotherapy. Despite their potential, few studies have characterized the benefits of thermal therapies for patients with heterogeneous chronic pain syndromes.
The purpose of this retrospective cohort study was to examine the potential clinical and health system benefits of patient-administered thermal therapy. Our primary hypothesis was that patients with chronic musculoskeletal pain who received a thermal therapy self-management device would have fewer days of opioid prescriptions compared with a sample of matched control patients. Secondarily, we hypothesized that patients who received a thermal therapy device would have lower utilization of specialty pain care, fewer potentially hazardous opioid prescriptions (eg, high-dose opioid therapy and concurrent opioid and benzodiazepine prescriptions), fewer prescriptions for nonopioid analgesic medications, and decreased pain intensity when compared with matched controls.
Methods
This retrospective cohort study compared pain pharmacotherapy, pain treatment utilization, and pain intensity outcomes between patients who received a thermal therapy device and matched patients who did not. The study was approved by the US Department of Veterans Affairs (VA) Portland Health Care System Institutional Review Board and was granted a waiver of informed consent to access patient electronic health records (EHRs).
Pain Care
The VA uses ThermaZone thermal therapy devices (Innovative Medical Equipment) for chronic pain treatment. The device uses thermoelectric technology to provide point-of-contact cooling and heating therapy through site-specific pads (eg, ankle, knee, hip, back, elbow, shoulder). Patients place pads on sites where they experience pain, and temperature regulated water circulates through the device and to the pad, providing consistent, localized thermal therapy. The pads range in temperature from 1 °C to 52 °C, and temperatures are self-monitored and controlled by the patient.
Standard pain care in this study followed the VA stepped model of pain care, which builds on a foundation of patient education for pain self-management approaches (eg, exercise, mindfulness, relaxation, social support).12 According to the VA stepped model of pain care, all patients with chronic pain should engage in these foundational self-management approaches. However, some patients require more intensive care. The VA stepped-up treatment engages primary and specialty care services—such as physical therapy, pharmacy, complementary and integrative health approaches, mental health, and substance use services—and, when indicated, may escalate treatment to interdisciplinary pain teams or tertiary pain centers. In this retrospective cohort study, treatment patients received a thermal therapy device and standard of care, whereas control patients received standard care only.
Sample Selection
Eligible patients were aged ≥ 18 years, had a musculoskeletal pain diagnosis documented in the EHR in the year prior to thermal therapy device receipt (or during the same period for a treatment patient’s matched control), and were enrolled in VA health care during the study period. Patients who died during the study period were excluded. Treatment patients received a thermal therapy device from the VA between January 1, 2017, and December 31, 2018, when complete data on thermal therapy devices were available. For control patients, the VA Corporate Data Warehouse (CDW) was used to identify VA patients with characteristics similar to those of treated patients.
We modeled the probability that a patient would receive a thermal therapy device using logistic regression. Predictor variables were measured in the year prior to device receipt and included variables associated with pain treatment utilization and analgesic pharmacotherapy receipt, as recommended by Brookhart et al.13 These included age, sex, race, ethnicity, VA service-connected disability status, comorbidities, receipt of medications for opioid use disorder, pain diagnoses, mental health diagnoses, and substance use disorder diagnoses.14-19
The resulting propensity scores (eg, predicted probabilities) were used to match treatment patients 1:1 with control patients using a nearest-neighbor matching algorithm.20 This procedure matches a control patient with the closest propensity score to that of the corresponding treatment patient. An exact match on VA facility was required (eg, treatment patients and matched controls received care at the same VA facility). Standardized differences were used to assess covariate balance between the matched groups, and kernel density plots of propensity scores tested for sufficient overlap.21 Control patients were selected from a pool of 1,150,149 patients.
Study Variables
The index date was the date the thermal therapy device was released to treatment patients or the same date for the matched controls. Data were extracted from the CDW over a 24-month period: 12 months prior to the index date through 12 months afterwards. Collecting data in the 12 months prior to treatment initiation allowed us to adjust for covariates and provided greater precision, as recommended for observational study designs.22
Treatment conditions were defined dichotomously as receipt vs nonreceipt of a thermal therapy device. The primary outcome was the number of days of opioid use in the 12 months following the index date. Additional outcomes included days of high-dose opioid therapy (≥ 50 mg morphine equivalent [MME] daily), concurrent opioid and benzodiazepine prescriptions, and nonopioid analgesic pharmacotherapy (eg, nonsteroidal anti-inflammatory drugs, acetaminophen, muscle relaxants). All prescription data were based on medication fills obtained from VA pharmacy records. Additional outcomes included the number of visits to physical therapy, occupational therapy, physical medicine and rehabilitation, and interdisciplinary pain clinics, including interventional pain medicine.
Pain intensity ratings were collected as part of routine VA care using a numeric scale from 0 (no pain) to 10 (worst possible pain). Pain intensity trajectories were computed using all available EHR-derived pain intensity score data for each patient in the 12 months prior to and following the index date.
Covariates were extracted from the EHR and evaluated in the year prior to the index date, unless otherwise noted. They included age at the index date; self-reported sex, and race and ethnicity; service-connected disability status (disability awarded as a result of military service-related trauma or injury); Charlson Comorbidity Index; and diagnoses of opioid use disorder, alcohol use disorder, other substance use disorder, mood disorder, posttraumatic stress disorder, other anxiety disorder, psychotic disorder, neuropathic pain, and headache pain.23 All diagnoses were coded as yes if identified in the EHR as a focus of treatment during any clinical encounter in the year prior to the index date or no if not identified as a focus of treatment.
The number of days patients had been living with pain was calculated and defined as the number of days from the first pain diagnosis available in a patient’s EHR to the index date. Finally, the number of pain-related surgeries (eg, surgeries with ≥ 1 pain diagnoses associated with the clinical encounter) and average pain intensity were computed for the pre- and postindex date evaluation periods and included as model covariates.
Statistical Analyses
For the 4 pharmacotherapy and 4 nonpharmacologic treatment usage outcomes, we tested the fit of linear models and several models with count distributions using the Bayesian information criterion.24 Count distributions included Poisson, zero-inflated Poisson, negative binomial, and zero-inflated negative binomial. With 1 exception (days of high-dose opioid use), a negative binomial distribution best fit the data. For days of high-dose opioid use, a Gaussian distribution best fit the data.
Eight separate mixed-effects regression analyses compared changes in each outcome from the 12-month preindex period through the 12-month postindex period between treatment and control patients by testing the Time × Treatment interaction. This approach statistically accounts for observed pretreatment differences in outcome variables. Statistics for the main effects of time and treatment are also presented. To reduce bias, models controlled for covariates specified previously.
For pain intensity, we used random-effects growth modeling to quantify both fixed and random effects of pain intensity at the index date (eg, the model intercept), which estimates pain at the time of treatment initiation, and change in pain during the 12 months following the index date (eg, the model slope), which characterizes the trajectory of pain intensity ratings.25 The model included piecewise components of pain score trajectories in the 12 months prior to the index date and in the 12 months following the index date. Several types of change for the 12-month postindex observation period were explored—including quadratic and cubic curvilinear change. A linear model for change in pain over time provided the best fit based on the Bayesian information criterion and parsimony of model parameters.26 We report estimates of change in pain over time in monthly intervals for ease of interpretation. However, models used all individual pain scores rather than computing monthly averages when > 1 pain score was available within a month, as recommended in previous research.27 This approach makes optimal use of all available data. Both random effects (intercept and slope) were regressed onto the set of covariates described previously.
This study used data available in the EHR over the 24-month observation period. We characterize the density (eg, frequency) of all outcome variables by treatment condition in the Appendix. Because the hypotheses were directional, the authors used a 2-sided α = 0.10 and applied a Bonferroni correction for the 9 statistical tests performed, resulting in an adjusted α of 0.01. Treatment utilization and pharmacotherapy outcome analyses were performed in Stata, version 16.1. Random-effects growth modeling of pain score trajectories was performed using Mplus, version 8.8.
Results
There were 2182 patients in the treatment group and 2182 matched controls. The mean (SD) age was 54 (15) years; 81% were male, and about two-thirds (68%) identified as White and non-Hispanic. Mental health comorbidities were common, with > 40% of the sample having diagnoses of a mood disorder and/or posttraumatic stress disorder. Nearly all patients (90%) had VA service-connected disability ratings. Among patients with chronic musculoskeletal pain, 8% had comorbid neuropathic pain and 14% had headache. The mean (SD) duration of chronic pain across both patient groups was 3416 (2016) days, or about 9.4 years (Table 1).
Pharmacotherapy
High-dose opioid use (> 50 MME daily dose), days of opioid use, and concurrent opioid and benzodiazepine use decreased for all patients from the pre- to posttreatment period (Table 2). However, high-dose opioid use (Time × Treatment interaction, 3.24; 99% CI, 0.34 to 6.14) (Figure 1A) and concurrent opioid and benzodiazepine use (Time × Treatment interaction, 0.76; 99% CI, 0.67 to 0.86) (Figure 1B) had a larger decrease for the treatment vs matched control group. Treatment and matched control patients had comparable reductions in days of opioid use (Time × Treatment interaction, 0.98; 99% CI, 0.91 to 1.05) (Figure 1C). Neither group showed changes in nonopioid analgesic pharmacotherapy over time (main effect of time, incidence rate ratio [IRR], 1.03; 99% CI, 0.99 to 1.07; Time × Treatment interaction, 0.95; 99% CI, 0.90 to 1.01) (Figure 1D).
Nonpharmacologic Pain Treatment
The number of physical therapy and pain clinic visits declined for treatment patients and increased slightly for matched control patients (Figure 2A and 2B). For occupational therapy visits, neither group showed changes over time (main effect of time IRR, 1.03; 99% CI, 0.83 to 1.22; Time × Treatment interaction, 1.20; 99% CI, 0.93 to 1.46) (Figure 2C). For physical medicine and rehabilitation visits, both groups decreased use over time (main effect of time IRR, 0.78; 99% CI, 0.66 to 0.90), but this decrease did not differ between treatment and control patients (Time × Treatment interaction, 1.16; 99% CI, 0.94 to 1.37) (Figure 2D).
Pain Intensity
Pain intensity decreased for both groups by an estimated 0.02 points per month (99% CI, -0.04 to -0.01; P < .01), or 0.24 points over the 12-month postindex follow-up period (Figure 3). There were no statistically significant differences between treatment and control patients in pain intensity changes over the follow-up period (B = -0.02; 99% CI, -0.06 to 0.02; P = .15).
Discussion
Patients with musculoskeletal pain who received a thermal therapy device showed a larger decline in use of some specialty pain treatments, including physical therapy and specialty pain clinic services, when compared with matched control patients. One possible explanation is that patients who used the device may have had their pain adequately managed and thus required less specialty pain care. However, the absence of clinically significant changes in pain intensity over time suggests that pain intensity alone did not account for the observed changes in pain treatment use. We were unable to measure constructs of pain interference or functioning, which may be better predictors of functional restoration, as these data are not routinely collected within the VA and documented in the EHR. Future studies could clarify these findings by including measures of pain interference and functioning.
Although the overall declines in physical therapy and specialty pain clinic use associated with thermal therapy were modest (< 1 visit per patient), the impact of these reductions can be profound. In resource-limited health care settings, even small reductions in high-cost care utilization could be of great value in that health systems could offset costs associated with treating chronic pain without compromising quality of care or key clinical outcomes, such as pain intensity. This study, however, did not include a cost analysis. Future studies should incorporate formal cost analyses to quantify cost offsets that may result from decreased specialty pain treatment use.
Patients who received thermal therapy devices did not show clinically meaningful reductions in pain intensity over time, defined as reductions in pain intensity of 1.7 to 2.0 on a 0 to 10 scale.28,29 This finding is consistent with prior research that demonstrates relatively stable pain intensity self-ratings longitudinally by patients with chronic pain diagnoses, when assessed in the context of usual clinical care.30 This finding, however, is inconsistent with prior literature that demonstrates pain-reducing benefits of thermal therapy for low back pain and knee osteoarthritis.7-9
In this study, pain intensity ratings were derived from the EHR during routine outpatient clinical encounters and not at the time thermal therapy was self-administered, as has been done in prior clinical trials.7-9 Pain location was not specified at the time of pain ratings, and it is possible that patients may have been endorsing pain in areas of the body that had not been treated by thermal therapy. Patient-level variability in pain intensity ratings (eg, within-patient range over time) was not examined, although prior research indicates substantial variability.30 While average pain intensity ratings in the current study did not change, an examination of patient variability warrants further study, as a narrowing of pain intensity ratings can be perceived, by patients, as demonstrable improvement and has been associated with improved physical and psychological outcomes.31 Furthermore, pain intensity does not characterize physical or emotional functioning that can be captured with more comprehensive validated measures, some of which are recommended outcomes in pain clinical trials.32
Our findings point to reductions in all forms of opioid use across both treatment and control patients. Data from the VA and in the US more generally point to downward trends in opioid prescribing during the study period.33 This decline is likely due to increased use of risk mitigation approaches, such as routine urine drug screens and review of prescription drug monitoring databases.34 These state-level databases track prescribing of controlled substances, including opioids and benzodiazepines, within a state. Implementation of these practices has been associated with declines in higher risk opioid prescribing.34 Findings from this study further point to associations of reduced higher risk opioid use among patients who received thermal therapy devices. In the full sample of patients, reductions in days of opioid use, high-dose opioid use, and co-use of opioids and benzodiazepines were observed across all patients, with greater reductions observed in high-dose opioid use and concurrent opioid and benzodiazepine use among patients who received a thermal therapy device. Experimental studies indicate that the endogenous opioid system is implicated in pain relief and activated by thermal therapies. 35 Differential reductions in higher-risk opioid use among patients who received thermal therapy devices in our study may be associated with endogenous opioid activation, though this was not specifically measured. It is also unclear whether thermal therapy was provided by clinicians in the context of opioid tapering or other risk mitigation efforts, or patients reduced higher risk opioid use of their own volition. Prior research has identified both patient- and clinician-initiated opioid tapering and discontinuation.36 While a thorough explication of opioid dose reduction was beyond the scope of this study, future qualitative work could help explain potential benefits of thermal therapy in the context of analgesic pharmacotherapy use, including opioid medications.
Limitations
The extent to which patients used the thermal therapy device could not be measured; therefore, device receipt was used as a proxy for use. However, it was not possible to determine whether the frequency and duration of device use was associated with study outcomes. Treatment and control groups demonstrated some differences in outcome variables at the index date. Potential known biases were addressed using propensity score matching procedures and statistical procedures that controlled for patient demographic and clinical characteristics, as well as pretreatment values of all outcome variables. Nevertheless, as an observational study, this analysis cannot account for all known and unknown confounders, and a randomized controlled trial is needed to make claims of causality. The study population consisted of US veterans and included a low proportion of women. As a result, the findings may not be generalizable to other patient populations. Finally, prescription dispensing data, used as a proxy for pharmacotherapy use, do not necessarily reflect actual medication use.
Conclusions
This study is among the first to examine associations between thermal therapy and specialty pain treatment and analgesic pharmacotherapy use among US veterans. Although the retrospective cohort study design does not allow causal inferences regarding the efficacy of thermal therapy for veterans with chronic musculoskeletal pain, confidence in the findings is strengthened by methodological and statistical control of known confounders. Future trials employing experimental designs are needed to further clarify the clinical and health systems benefits of thermal therapy for musculoskeletal pain syndromes.
- Krebs EE, Gravely A, Nugent S, et al. Effect of opioid vs nonopioid medications on pain-related function in patients with chronic back pain or hip or knee osteoarthritis pain: the SPACE randomized clinical trial. JAMA. 2018;2018:872-882. doi:10.1001/jama.2018.0899
- Becker WC, DeBar LL, Heapy AA, et al. A research agenda for advancing non-pharmacological management of chronic musculoskeletal pain: findings from a VHA state-of-the-art conference. J Gen Intern Med. 2018;33:1-15. doi:10.1007/s11606-018-4345-6
- Fernandes IA, Armond ACV, Falci SGM. The effectiveness of the cold therapy (cryotherapy) in the management of inflammatory parameters after removal of mandibular third molars: a meta-analysis. Int Arch Otorhinolaryngol. 2019;23:221-228. doi:10.1055/s-0039-1677755
- Quinlan P, Davis J, Fields K, et al. Effects of localized cold therapy on pain in postoperative spinal fusion patients: a randomized controlled trial. Orthop Nurs. 2017;36:344-349. doi:10.1097/NOR.0000000000000382
- Malanga GA, Yan N, Stark J. Mechanisms and efficacy of heat and cold therapies for musculoskeletal injury. Postgrad Med. 2015;127:57-65. doi:10.1080/00325481.2015.992719
- Wang Y, Li S, Zhang Y, et al. Heat and cold therapy reduce pain in patients with delayed onset muscle soreness: a systematic review and meta-analysis of 32 randomized controlled trials. Phys Ther Sport. 2021;48:177-187. doi:10.1016/j.ptsp.2021.01.004
- Ariana M, Afrasiabifar A, Doulatabad SN, et al. The effect of local heat therapy versus cold rub gel on pain and joint functions in patients with knee osteoarthritis. Clin Nurs Res. 2022;31:1014-1022. doi:10.1177/10547738211035502
- French SD, Cameron M, Walker BF, et al. Superficial heat or cold for low back pain. Cochrane Database Syst Rev. 2006;1:CD004750. doi:10.1002/14651858.CD004750.pub2
- Tao XG, Bernacki EJ. A randomized clinical trial of continuous low-level heat therapy for acute muscular low back pain in the workplace. J Occup Environ Med. 2005;47:1298- 1306. doi:10.1097/01.jom.0000184877.01691.a3
- Freiwald J, Hoppe MW, Beermann W, et al. Effects of supplemental heat therapy in multimodal treated chronic low back pain patients on strength and flexibility. Clin Biomech. 2018;57:107-113. doi:10.1016/j.clinbiomech.2018.06.008
- Freiwald J, Magni A, Fanlo-Mazas P, et al. A role for superficial heat therapy in the management of nonspecific, mild-to-moderate low back pain in current clinical practice: a narrative review. Life. 2021;11:780. doi:10.3390/life11080780
- Kerns RD, Philip EJ, Lee AW, et al. Implementation of the Veterans Health Administration National Pain Management Strategy. Transl Behav Med. 2011;1:635-643. doi:10.1007/s13142-011-0094-3
- Brookhart MA, Schneeweiss S, Rothman KJ, et al. Variable selection for propensity score models. Am J Epidemiol. 2006;163:1149-1156. doi:10.1093/aje/kwj149
- Edlund MJ, Martin BC, Devries A, et al. Trends in use of opioids for chronic non-cancer pain among individuals with mental health and substance use disorders: the TROUP study. Clin J Pain. 2010;26:1-8. doi:10.1097/AJP.0b013e3181b99f35
- Kaur S, Stechuchak KM, Coffman CJ, et al. Gender differences in health care utilization among veterans with chronic pain. J Gen Intern Med. 2007;22:228-233. doi:10.1007/s11606-006-0048-5
- Meghani SH, Cho E. Self-reported pain and utilization of pain treatment between minorities and non-minorities in the United States. Public Health Nurs. 2009;26:307-316. doi:10.1111/j.1525-1446.2009.00785.x
- Morasco BJ, Duckart JP, Carr TP, et al. Clinical characteristics of veterans prescribed high doses of opioid medications for chronic non-cancer pain. Pain. 2010;151:625-632. doi:10.1016/j.pain.2010.08.002
- Nielsen S, Lintzeris N, Bruno R, et al. Benzodiazepine use among chronic pain patients prescribed opioids: associations with pain, physical and mental health, and health service utilization. Pain Med. 2015;16:356-366. doi:10.1111/pme.12594
- Quinn PD, Hur K, Chang Z, et al. Incident and long-term opioid therapy among patients with psychiatric conditions and medications: a national study of commercial health care claims. Pain. 2017;158:140-148. doi:10.1097/j.pain.0000000000000730
- Rubin DB. Matching to remove bias in observational studies. Biometrics. 1973;29:159-183.
- Rosenbaum PR, Rubin DB. Constructing a control group using multivariate matched sampling methods that incorporate the propensity score. Am Stat. 1985;39:33-38. doi:10.1007/s11596-025-00052-0
- Steiner PM, Cook TD, Shadish WR, et al. The importance of covariate selection in controlling for selection bias in observational studies. Psychol Methods. 2010;15:250-267. doi:10.1037/a0018719
- Charlson ME, Pompei P, Ales KL, et al. A new method of classifying prognostic comorbidity in longitudinal studies: development and validation. J Chronic Dis. 1987;40:373- 383. doi:10.1016/0021-9681(87)90171-8
- Long JS, Freese J. Regression Models for Categorical Dependent Variables Using Stata. 3rd ed. Stata Press; 2014.
- Muthén LK, Muthén BO. Mplus User’s Guide. 8th ed. Muthén & Muthén; 1998-2017.
- Hedeker D, Gibbons RD. Longitudinal Data Analysis. Wiley; 2006.
- Dobscha SK, Morasco BJ, Kovas AE, et al. Short-term variability in outpatient pain intensity scores in a national sample of older veterans with chronic pain. Pain Med. 2015;16:855-865. doi:10.1111/pme.12643
- Bahreini M, Safaie A, Mirfazaelian H, et al. How much change in pain score does really matter to patients? Am J Emerg Med. 2020;38:1641-1646. doi:10.1016/j.ajem.2019.158489
- Suzuki H, Aono S, Inoue S, et al. Clinically significant changes in pain along the pain intensity numerical rating scale in patients with chronic low back pain. PLoS One. 2020;15:e0229228. doi:10.1371/journal.pone.0229228
- McPherson SM, Smith CL, Dobscha SK, et al. Changes in pain intensity after discontinuation of long-term opioid therapy for chronic noncancer pain. Pain. 2018;159:2097- 2104. doi:10.1097/j.pain.0000000000001315
- Andrews NE, Strong J, Meredith PJ. Activity pacing, avoidance, endurance, and associations with patient functioning in chronic pain: a systematic and meta-analysis. Arch Phys Med Rehabil. 2012;93:2109-121. doi:10.1016/j.apmr.2012.05.029
- Dworkin RH, Turk DC, Farrar JT, et al. Core outcome measures for chronic pain clinical trials: IMMPACT recommendations. Pain. 2005;113:9-19. doi:10.1016/j.pain.2004.09.012
- Gellad WF, Good CB, Shulkin DJ. Addressing the opioid epidemic in the United States: Lessons from the Department of Veterans Affairs. JAMA Intern Med. 2017;177:611- 612. doi:10.1001/jamainternmed.2017.0147
- Lin LA, Bohnert ASB, Kerns RD, et al. Impact of the Opioid Safety Initiative on opioid-related prescribing in veterans. Pain. 2017;158:833-839. doi:10.1097/j.pain.0000000000000837
- Sirucek L, Price RC, Gandhi W, et al. Endogenous opioids contribute to the feeling of pain relief in humans. Pain. 2021;162:2821-2831. doi:10.1097/j.pain.0000000000002285
- Lovejoy TI, Morasco BJ, Demidenko MI, et al. Reasons for discontinuation of long-term opioid therapy in patients with and without substance use disorders. Pain. 2017;158:526- 534. doi:10.1097/j.pain.0000000000000796
Thermal Therapy is Associated With Decreased Pain Treatment Use: A Retrospective Cohort Study
Thermal Therapy is Associated With Decreased Pain Treatment Use: A Retrospective Cohort Study
Implementation of a Pharmacist-Led Penicillin Allergy Interview at a Veterans Care Facility
Implementation of a Pharmacist-Led Penicillin Allergy Interview at a Veterans Care Facility
Self-reported penicillin allergies are common, with a prevalence of about 10% of patients, according to the Centers for Disease Control and Prevention (CDC).1 However, only about 1% of patients have a true immunoglobulin E (IgE)-mediated allergy. This issue is often further complicated by inaccurate classification of nonallergic adverse effects as an allergy, resulting in incomplete allergy documentation in the electronic health record (EHR). The cross-reactivity rate with cephalosporins (Β-lactam antibiotics) in patients reporting a penicillin allergy is < 1%, which suggests that many patients with reported penicillin allergies can safely receive them.2 Despite this, patients with self-reported penicillin allergies often receive non–Β-lactam antibiotic agents, which may be associated with an increased risk of adverse drug reactions (ADRs), increased health care costs, and inferior clinical outcomes.3
Several strategies are recommended to assess patients with self-reported penicillin allergies. According to the CDC, evaluating a patient who reports a penicillin or other Β-lactam antibiotic allergy involves 3 steps: (1) obtaining a thorough medical history, including previous exposures to penicillin or other Β-lactam antibiotic; (2) performing a skin test using the penicillin major and minor determinants; and (3) among those who have a negative penicillin skin test, performing an observed oral challenge with 250 mg amoxicillin before proceeding directly to treatment with the indicated Β-lactam therapy.4
Most existing clinical guidance for assessing patients with self-reported penicillin allergies stems from site-specific policies and primarily focuses on oral amoxicillin challenges or penicillin skin testing (PST). However, performing these tests may not be feasible at all facilities due to time constraints and lack of allergists. Therefore, alternative strategies are necessary, such as conducting detailed patient interviews. Few studies have evaluated switching to Β-lactam agents following a penicillin allergy interview alone. However, with thorough patient histories and detailed interviews, patients with reported penicillin allergies can safely use Β-lactam antibiotics.5 Implementing this procedure provides a cost-savings opportunity by not having to administer additional antibiotics for testing in addition to improving antibiotic stewardship.
The Memphis Veterans Affairs Medical Center (MVAMC) created the Allergy to Β-Lactam Evaluation (ABLE) process to clarify and remove penicillin allergies. The process involves conducting a thorough chart review and patient interview followed by completion of a note template that provides recommendations about patient allergies and Β-lactam prescribing. Mitchell et al found that the pharmacist-led process to be beneficial for addressing Β-lactam allergy clearance.6 As a result, the ABLE process was implemented at several other US Department of Veterans Affairs (VA) medical centers (VAMCs). Using the ABLE template, the purpose of this study was to evaluate the impact of a pharmacist-led penicillin allergy initiative on penicillin allergy delabeling with an interview process alone.
Methods
Prior to ABLE process implementation, there were no standardized procedures for documenting allergy histories. ABLE was implemented at the Robley Rex VAMC (RRVAMC) in November 2022. During the interview phase, patients were initially identified during admission via TheraDoc as having either a penicillin allergy or ADR. The infectious disease pharmacist or pharmacy resident interviewed patients with documented penicillin allergies or ADRs using a standardized questionnaire (eAppendix 1). Not all identified patients could be interviewed. Patients currently receiving an antibiotic were prioritized for interviews. Patients were excluded if they declined or were unable to be interviewed, although a patient’s caregiver(s) could be interviewed in person or via telephone, if the patient was not available.
Following the interview, pharmacists used guidance from the ABLE process in addition to a detailed EHR review to determine whether the patient was eligible for an allergy update or removal and/or switch to a Β-lactam antibiotic (Figure). If eligible for modification, the interviewing pharmacist made the necessary changes. A templated process note with patient-specific recommendations was entered into the Computerized Patient Record System (CPRS) and the primary care team attending physician was added as an additional signer to be alerted in the system note (eAppendix 2).
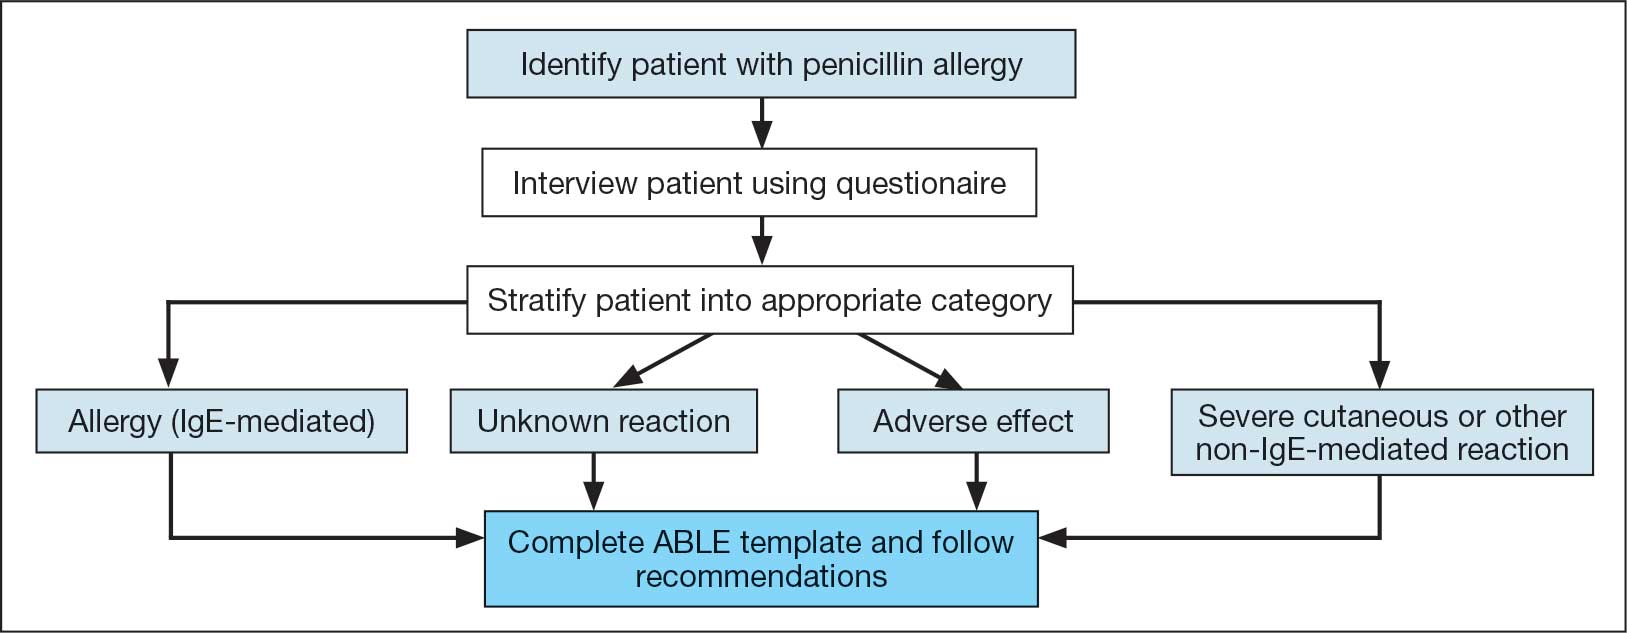
This single-center, retrospective cohort study involved review of CPRS notes and clinical interviews in the interviewed group. Hospitalized patients at the RRVAMC aged ≥ 18 years with a documented penicillin allergy or ADR were included. The historical control group consisted of patients admitted between October 31, 2019, and October 31, 2022, and the intervention group consisted of patients admitted between November 1, 2022, and March 1, 2023. Patients in the historical control group were matched 1:1 to the intervention group for penicillin allergy severity (allergy [IgE-mediated], unknown, adverse effect, severe cutaneous or other non–IgE-mediated reaction) and whether they received a noncarbapenem non–Β-lactam antibiotic.
The primary outcome was the number of patient allergies/ADRs removed or changed on patient profiles regardless of whether their antibiotic regimen was changed. This outcome was further assessed by evaluating the number of patient allergies or ADRs removed or changed on patient profiles with or without a change in antibiotic regimen. Primary outcomes were analyzed using χ2 and/ or Fisher exact tests, as appropriate to determine statistically significant differences between the interviewed group and the historical control.
Results
Seventy patients were included: 35 patients in the interviewed group and 35 patients in the historical control group, respectively. Both groups had a mean age of 72 years and predominantly included White male patients (Table 1). Following the interview, the allergy profile was modified for 6 patients (17%) in the interview group vs 0 patients in the control group (P = .03) (Table 2). The primary outcome was analyzed separately regardless of an antibiotic regimen change. There was not a statistically significant difference between groups when assessing patients for change in therapy (P > .99). All 6 patients with an allergy profile modification had no change in antibiotic regimen.
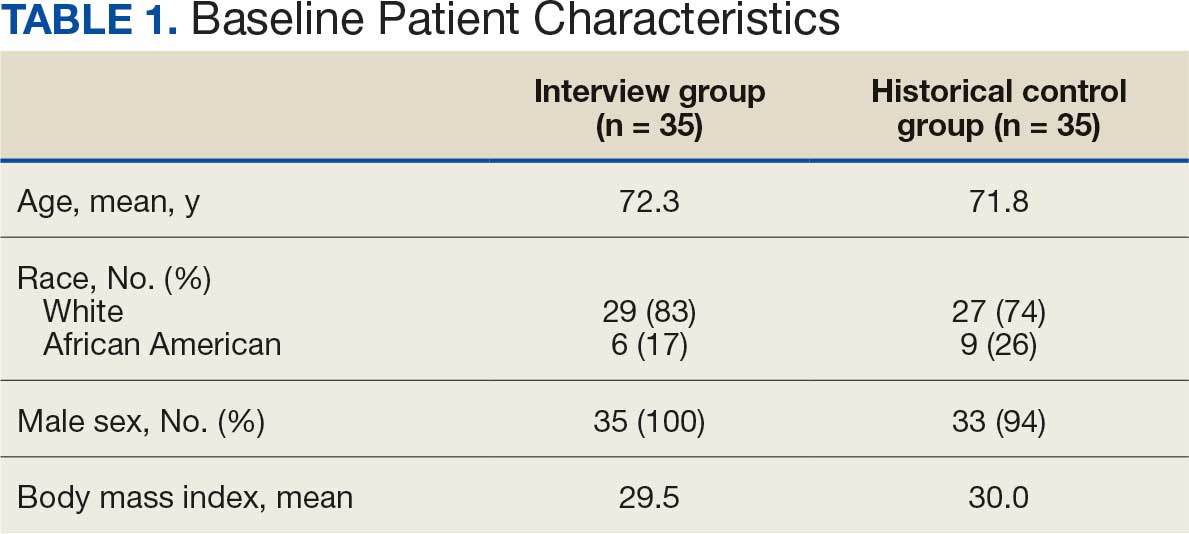
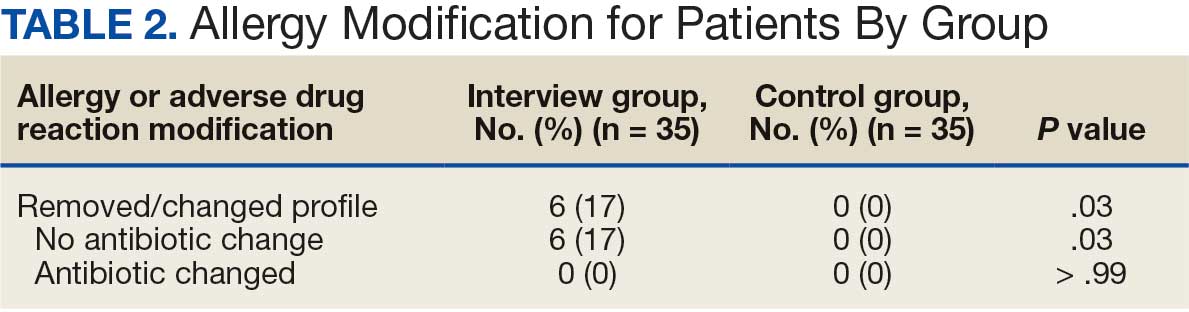
Discussion
This study suggests the ABLE process may be a valuable tool for adjusting penicillin allergies or ADRs within patient EHRs. In the interview group, allergies were modified in 6 (17%) patients while no patients in the control group had allergy modifications. Of the 6 allergy profile modifications, 4 allergy labels were changed from an allergy to an ADR. These patients were cleared to receive future Β-lactam antibiotics after clinicians recognized the lack of a true IgE-mediated allergic reaction. In addition, 2 of the modified allergy profiles removed the allergy designation. Although this represents a small subset of interviewed patients, it illustrates the clinical effectiveness of an interview process alone to remove penicillin allergy designations.
Previous research has assessed the impact of pharmacist intervention on penicillin allergy clarification. Mitchell et al implemented a pharmacist-driven Β-lactam allergy assessment and penicillin allergy clinic (PAC) at the MVAMC with the goal of evaluating its impact on allergy clearance. In their study, clinical pharmacy specialists evaluated patients with Β-lactam allergies, and those deemed eligible were later seen in the PAC. Among the 246 patients evaluated using the Β-lactam allergy assessment alone and who were not seen in the PAC, 25% had their penicillin allergy removed following a detailed assessment.6
Song et al evaluated the effectiveness and feasibility of a pharmacist-driven penicillin allergy delabeling pilot program without skin testing or oral challenges. Patients with penicillin allergies were interviewed by a pharmacy resident using a standardized checklist. Among the 66 patients interviewed, 12 (18%) met the criteria for delabeling and consented to removal of their allergy.7 The delabeling rates in these 2 studies are similar to the 17% rate of allergy modification in our study, although this study is the only one to compare results to a historical control group.
Harper et al evaluated the impact of a penicillin allergy assessment, including penicillin skin testing and oral amoxicillin challenges, on delabeling penicillin allergies. Pharmacists completed a penicillin allergy assessment and performed penicillin skin testing and/or oral amoxicillin challenges for eligible patients. Of 35 patients, 31 (89%) had their penicillin allergies delabeled in the EHR.8 The rate of penicillin allergy delabeling in Harper et al was likely higher than that seen in our study due to the use of oral challenge and skin testing. Regardless, a detailed penicillin allergy interview alone was effective at RRVAMC, resulting in a significant rate of allergy removal or change. This supports the use of detailed penicillin allergy assessments in settings where penicillin skin testing or oral challenges may not be feasible.
Mann et al demonstrated the effectiveness of penicillin allergy assessments in switching eligible patients to Β-lactam antibiotics. Their single-center, prospective study assessed the impact of a pharmacist-driven detailed penicillin allergy interview initiative. Interviews that evaluated potential changes to allergy profiles were conducted with 175 patients. Of these patients, 135 (77.1%) were on antimicrobial therapy and 42 (31.1%) patients receiving therapy met criteria to switch to a noncarbapenem Β-lactam antibiotic. Thirty-one patients (73.8%) switched with no signs or symptoms of intolerance demonstrating that an interview can be a valuable tool for antibiotic optimization, specifically in patients with penicillin allergy.9 No patients in our study switched antibiotic therapy, likely because only a small number of patients were eligible for transition to a noncarbapenem Β-lactam antibiotic. In the Mann et al study, non–Β-lactam antibiotics, such as fluoroquinolones and carbapenems, accounted for > 75% of the antibiotics used.
Limitations
The sample size of this study was small and its duration was short. There is a risk for selection bias as not all identified patients were able to be interviewed while admitted, but patients on antibiotics were prioritized as they were most likely to directly benefit during their current admission from a modification of their allergy. Most patients in the study were White and male, which may limit the generalizability of the results. Additionally, recommendations regarding antibiotic changes were primarily communicated to the treatment team based on a templated note in CPRS alone. Therefore, implementation of these recommendations largely relied upon nonverbal communication. Direct pharmacist-physician communication could have led to a larger impact on antimicrobial therapy changes. The interviewer’s participation in daily rounds with time allotted to discuss this topic can be considered in the future to improve these processes.
Conclusions
This study found that the ABLE process identified patients for penicillin allergy delabeling. With the high prevalence of inaccurate penicillin allergy documentation, this tool offers VA health care systems a way to empower pharmacists in allergy clarification, leading to improvements in antibiotic stewardship. Although the sample size was small, the ABLE process may provide a framework for VA clinicians. Future research has the potential to demonstrate the practicality and effectiveness this pharmacist-led penicillin allergy interview process can offer clinicians.
- Health care providers. Clinical features of penicillin allergy. Centers for Disease Control and Prevention. August 25, 2025. Accessed February 4, 2026. https://www.cdc.gov /antibiotic-use/hcp/clinical-signs/index.html
- Wrynn AF. Penicillin allergies: A guide for NPs. Nurse Pract. 2022;47:30-36. doi:10.1097/01.NPR.0000855312.11145.78
- Mohsen S, Dickinson JA, Somayaji R. Update on the adverse effects of antimicrobial therapies in community practice. Can Fam Physician. 2020;66:651-659.
- Sexually Transmitted Infections Treatment Guidelines, 2021. Managing persons who have a history of penicillin allergy. Centers for Disease Control and Prevention. September 21, 2022. Accessed February 4, 2026. https:// www.cdc.gov/std/treatment-guidelines/penicillin-allergy .htm
- Holmes AK, Bennett NT, Berry TP. Pharmacy driven assessment of appropriate antibiotic selection in patients with reported beta-lactam allergy. J Am Coll Clin Pharm. 2019;2:509-514. doi:10.1002/jac5.1135
- Mitchell AB, Ness RA, Bennett JG, et al. Implementation and impact of a Β-lactam allergy assessment protocol in a veteran population. Fed Pract. 2021;38:420-425. doi:10.12788/fp.0172
- Song YC, Nelson ZJ, Wankum MA, et al. Effectiveness and feasibility of pharmacist-driven penicillin allergy de-labeling pilot program without skin testing or oral challenges. Pharmacy (Basel). 2021;9:127. doi:10.3390/pharmacy9030127
- Harper HM, Sanchez M. Review of pharmacist driven penicillin allergy assessments and skin testing: a multicenter case-series. Hosp Pharm. 2022;57:469-473. doi:10.1177/00185787211046862
- Mann KL, Wu JY, Shah SS. Implementation of a pharmacist- driven detailed penicillin allergy interview. Ann Pharmacother. 2020;54:364-370. doi:10.1177/1060028019884874
Self-reported penicillin allergies are common, with a prevalence of about 10% of patients, according to the Centers for Disease Control and Prevention (CDC).1 However, only about 1% of patients have a true immunoglobulin E (IgE)-mediated allergy. This issue is often further complicated by inaccurate classification of nonallergic adverse effects as an allergy, resulting in incomplete allergy documentation in the electronic health record (EHR). The cross-reactivity rate with cephalosporins (Β-lactam antibiotics) in patients reporting a penicillin allergy is < 1%, which suggests that many patients with reported penicillin allergies can safely receive them.2 Despite this, patients with self-reported penicillin allergies often receive non–Β-lactam antibiotic agents, which may be associated with an increased risk of adverse drug reactions (ADRs), increased health care costs, and inferior clinical outcomes.3
Several strategies are recommended to assess patients with self-reported penicillin allergies. According to the CDC, evaluating a patient who reports a penicillin or other Β-lactam antibiotic allergy involves 3 steps: (1) obtaining a thorough medical history, including previous exposures to penicillin or other Β-lactam antibiotic; (2) performing a skin test using the penicillin major and minor determinants; and (3) among those who have a negative penicillin skin test, performing an observed oral challenge with 250 mg amoxicillin before proceeding directly to treatment with the indicated Β-lactam therapy.4
Most existing clinical guidance for assessing patients with self-reported penicillin allergies stems from site-specific policies and primarily focuses on oral amoxicillin challenges or penicillin skin testing (PST). However, performing these tests may not be feasible at all facilities due to time constraints and lack of allergists. Therefore, alternative strategies are necessary, such as conducting detailed patient interviews. Few studies have evaluated switching to Β-lactam agents following a penicillin allergy interview alone. However, with thorough patient histories and detailed interviews, patients with reported penicillin allergies can safely use Β-lactam antibiotics.5 Implementing this procedure provides a cost-savings opportunity by not having to administer additional antibiotics for testing in addition to improving antibiotic stewardship.
The Memphis Veterans Affairs Medical Center (MVAMC) created the Allergy to Β-Lactam Evaluation (ABLE) process to clarify and remove penicillin allergies. The process involves conducting a thorough chart review and patient interview followed by completion of a note template that provides recommendations about patient allergies and Β-lactam prescribing. Mitchell et al found that the pharmacist-led process to be beneficial for addressing Β-lactam allergy clearance.6 As a result, the ABLE process was implemented at several other US Department of Veterans Affairs (VA) medical centers (VAMCs). Using the ABLE template, the purpose of this study was to evaluate the impact of a pharmacist-led penicillin allergy initiative on penicillin allergy delabeling with an interview process alone.
Methods
Prior to ABLE process implementation, there were no standardized procedures for documenting allergy histories. ABLE was implemented at the Robley Rex VAMC (RRVAMC) in November 2022. During the interview phase, patients were initially identified during admission via TheraDoc as having either a penicillin allergy or ADR. The infectious disease pharmacist or pharmacy resident interviewed patients with documented penicillin allergies or ADRs using a standardized questionnaire (eAppendix 1). Not all identified patients could be interviewed. Patients currently receiving an antibiotic were prioritized for interviews. Patients were excluded if they declined or were unable to be interviewed, although a patient’s caregiver(s) could be interviewed in person or via telephone, if the patient was not available.
Following the interview, pharmacists used guidance from the ABLE process in addition to a detailed EHR review to determine whether the patient was eligible for an allergy update or removal and/or switch to a Β-lactam antibiotic (Figure). If eligible for modification, the interviewing pharmacist made the necessary changes. A templated process note with patient-specific recommendations was entered into the Computerized Patient Record System (CPRS) and the primary care team attending physician was added as an additional signer to be alerted in the system note (eAppendix 2).
This single-center, retrospective cohort study involved review of CPRS notes and clinical interviews in the interviewed group. Hospitalized patients at the RRVAMC aged ≥ 18 years with a documented penicillin allergy or ADR were included. The historical control group consisted of patients admitted between October 31, 2019, and October 31, 2022, and the intervention group consisted of patients admitted between November 1, 2022, and March 1, 2023. Patients in the historical control group were matched 1:1 to the intervention group for penicillin allergy severity (allergy [IgE-mediated], unknown, adverse effect, severe cutaneous or other non–IgE-mediated reaction) and whether they received a noncarbapenem non–Β-lactam antibiotic.
The primary outcome was the number of patient allergies/ADRs removed or changed on patient profiles regardless of whether their antibiotic regimen was changed. This outcome was further assessed by evaluating the number of patient allergies or ADRs removed or changed on patient profiles with or without a change in antibiotic regimen. Primary outcomes were analyzed using χ2 and/ or Fisher exact tests, as appropriate to determine statistically significant differences between the interviewed group and the historical control.
Results
Seventy patients were included: 35 patients in the interviewed group and 35 patients in the historical control group, respectively. Both groups had a mean age of 72 years and predominantly included White male patients (Table 1). Following the interview, the allergy profile was modified for 6 patients (17%) in the interview group vs 0 patients in the control group (P = .03) (Table 2). The primary outcome was analyzed separately regardless of an antibiotic regimen change. There was not a statistically significant difference between groups when assessing patients for change in therapy (P > .99). All 6 patients with an allergy profile modification had no change in antibiotic regimen.
Discussion
This study suggests the ABLE process may be a valuable tool for adjusting penicillin allergies or ADRs within patient EHRs. In the interview group, allergies were modified in 6 (17%) patients while no patients in the control group had allergy modifications. Of the 6 allergy profile modifications, 4 allergy labels were changed from an allergy to an ADR. These patients were cleared to receive future Β-lactam antibiotics after clinicians recognized the lack of a true IgE-mediated allergic reaction. In addition, 2 of the modified allergy profiles removed the allergy designation. Although this represents a small subset of interviewed patients, it illustrates the clinical effectiveness of an interview process alone to remove penicillin allergy designations.
Previous research has assessed the impact of pharmacist intervention on penicillin allergy clarification. Mitchell et al implemented a pharmacist-driven Β-lactam allergy assessment and penicillin allergy clinic (PAC) at the MVAMC with the goal of evaluating its impact on allergy clearance. In their study, clinical pharmacy specialists evaluated patients with Β-lactam allergies, and those deemed eligible were later seen in the PAC. Among the 246 patients evaluated using the Β-lactam allergy assessment alone and who were not seen in the PAC, 25% had their penicillin allergy removed following a detailed assessment.6
Song et al evaluated the effectiveness and feasibility of a pharmacist-driven penicillin allergy delabeling pilot program without skin testing or oral challenges. Patients with penicillin allergies were interviewed by a pharmacy resident using a standardized checklist. Among the 66 patients interviewed, 12 (18%) met the criteria for delabeling and consented to removal of their allergy.7 The delabeling rates in these 2 studies are similar to the 17% rate of allergy modification in our study, although this study is the only one to compare results to a historical control group.
Harper et al evaluated the impact of a penicillin allergy assessment, including penicillin skin testing and oral amoxicillin challenges, on delabeling penicillin allergies. Pharmacists completed a penicillin allergy assessment and performed penicillin skin testing and/or oral amoxicillin challenges for eligible patients. Of 35 patients, 31 (89%) had their penicillin allergies delabeled in the EHR.8 The rate of penicillin allergy delabeling in Harper et al was likely higher than that seen in our study due to the use of oral challenge and skin testing. Regardless, a detailed penicillin allergy interview alone was effective at RRVAMC, resulting in a significant rate of allergy removal or change. This supports the use of detailed penicillin allergy assessments in settings where penicillin skin testing or oral challenges may not be feasible.
Mann et al demonstrated the effectiveness of penicillin allergy assessments in switching eligible patients to Β-lactam antibiotics. Their single-center, prospective study assessed the impact of a pharmacist-driven detailed penicillin allergy interview initiative. Interviews that evaluated potential changes to allergy profiles were conducted with 175 patients. Of these patients, 135 (77.1%) were on antimicrobial therapy and 42 (31.1%) patients receiving therapy met criteria to switch to a noncarbapenem Β-lactam antibiotic. Thirty-one patients (73.8%) switched with no signs or symptoms of intolerance demonstrating that an interview can be a valuable tool for antibiotic optimization, specifically in patients with penicillin allergy.9 No patients in our study switched antibiotic therapy, likely because only a small number of patients were eligible for transition to a noncarbapenem Β-lactam antibiotic. In the Mann et al study, non–Β-lactam antibiotics, such as fluoroquinolones and carbapenems, accounted for > 75% of the antibiotics used.
Limitations
The sample size of this study was small and its duration was short. There is a risk for selection bias as not all identified patients were able to be interviewed while admitted, but patients on antibiotics were prioritized as they were most likely to directly benefit during their current admission from a modification of their allergy. Most patients in the study were White and male, which may limit the generalizability of the results. Additionally, recommendations regarding antibiotic changes were primarily communicated to the treatment team based on a templated note in CPRS alone. Therefore, implementation of these recommendations largely relied upon nonverbal communication. Direct pharmacist-physician communication could have led to a larger impact on antimicrobial therapy changes. The interviewer’s participation in daily rounds with time allotted to discuss this topic can be considered in the future to improve these processes.
Conclusions
This study found that the ABLE process identified patients for penicillin allergy delabeling. With the high prevalence of inaccurate penicillin allergy documentation, this tool offers VA health care systems a way to empower pharmacists in allergy clarification, leading to improvements in antibiotic stewardship. Although the sample size was small, the ABLE process may provide a framework for VA clinicians. Future research has the potential to demonstrate the practicality and effectiveness this pharmacist-led penicillin allergy interview process can offer clinicians.
- Health care providers. Clinical features of penicillin allergy. Centers for Disease Control and Prevention. August 25, 2025. Accessed February 4, 2026. https://www.cdc.gov /antibiotic-use/hcp/clinical-signs/index.html
- Wrynn AF. Penicillin allergies: A guide for NPs. Nurse Pract. 2022;47:30-36. doi:10.1097/01.NPR.0000855312.11145.78
- Mohsen S, Dickinson JA, Somayaji R. Update on the adverse effects of antimicrobial therapies in community practice. Can Fam Physician. 2020;66:651-659.
- Sexually Transmitted Infections Treatment Guidelines, 2021. Managing persons who have a history of penicillin allergy. Centers for Disease Control and Prevention. September 21, 2022. Accessed February 4, 2026. https:// www.cdc.gov/std/treatment-guidelines/penicillin-allergy .htm
- Holmes AK, Bennett NT, Berry TP. Pharmacy driven assessment of appropriate antibiotic selection in patients with reported beta-lactam allergy. J Am Coll Clin Pharm. 2019;2:509-514. doi:10.1002/jac5.1135
- Mitchell AB, Ness RA, Bennett JG, et al. Implementation and impact of a Β-lactam allergy assessment protocol in a veteran population. Fed Pract. 2021;38:420-425. doi:10.12788/fp.0172
- Song YC, Nelson ZJ, Wankum MA, et al. Effectiveness and feasibility of pharmacist-driven penicillin allergy de-labeling pilot program without skin testing or oral challenges. Pharmacy (Basel). 2021;9:127. doi:10.3390/pharmacy9030127
- Harper HM, Sanchez M. Review of pharmacist driven penicillin allergy assessments and skin testing: a multicenter case-series. Hosp Pharm. 2022;57:469-473. doi:10.1177/00185787211046862
- Mann KL, Wu JY, Shah SS. Implementation of a pharmacist- driven detailed penicillin allergy interview. Ann Pharmacother. 2020;54:364-370. doi:10.1177/1060028019884874
Implementation of a Pharmacist-Led Penicillin Allergy Interview at a Veterans Care Facility
Implementation of a Pharmacist-Led Penicillin Allergy Interview at a Veterans Care Facility
Outcomes From the Use of Cefazolin for Surgical Prophylaxis in Patients Allergic to Penicillin
Outcomes From the Use of Cefazolin for Surgical Prophylaxis in Patients Allergic to Penicillin
Given its safety profile and bactericidal activity against the predominant organisms causing surgical site infections (SSIs), cefazolin remains the most popular choice for surgical prophylaxis.1 Cefazolin offers protection against the pathogens most likely to contaminate the surgical site while minimizing inappropriate methicillin- resistant Staphylococcus aureus coverage that occurs with alternatives such as vancomycin and clindamycin. Documented allergies to Β-lactam antibiotics have historically forced clinicians to avoid the use of cephalosporins due to the potential risk of cross-reactivity. True type 1 (immunoglobin E [IgE]-mediated) cross-allergic reactions between penicillin and cephalosporins are rare, and previously reported data indicate cross-reactivity as a result of antibody recognition is more closely related to the side-chain identity rather than the Β-lactam ring.2,3
About 10% of US patients report having a penicillin allergy; however, < 1% of the population has a true IgE-mediated allergic reaction.4 Previous research that has challenged penicillin allergies with cefazolin for surgical prophylaxis has reported minimal rates of allergic reactions.2-5
In previous trials, patients with a history of delayed skin reactions, such as Stevens-Johnson syndrome (SJS), toxic epidermal necrolysis (TEN), and drug reaction with eosinophilia and systemic symptoms (DRESS), were excluded. Additionally, patients with an allergy to cefazolin including those with urticaria, angioedema, bronchospasm, or anaphylaxis, were excluded from perioperative retrial of cefazolin. Grant et al found that cefazolin can be safely given to patients with IgE-mediated reactions to penicillin and other cephalosporins due to a structurally different side chain.3
In January 2023, the Veteran Health Indiana (VHI) pharmacy team in conjunction with surgery, infectious disease, and anesthesiology, implemented a screening tool as an amendment to perioperative antibiotic guidance to help determine which patients with a documented penicillin allergy could be candidates for perioperative cefazolin. The implemented screening tool (Allergy Clarification for Cefazolin Evidence-Based Prescribing Tool) has been described by Lam et al, who reported that an increased proportion of patients with documented penicillin allergy received cefazolin without more adverse drug reactions (ADRs).5 Patients with a Β-lactam allergy were eligible to receive cefazolin unless the ADR was SJS, TEN, or DRESS, or the offending agent was cefazolin and the patient experienced urticaria, angioedema, bronchospasm, or anaphylaxis. If the reaction was not from cefazolin or was unknown, patients were eligible to receive cefazolin (Figure).
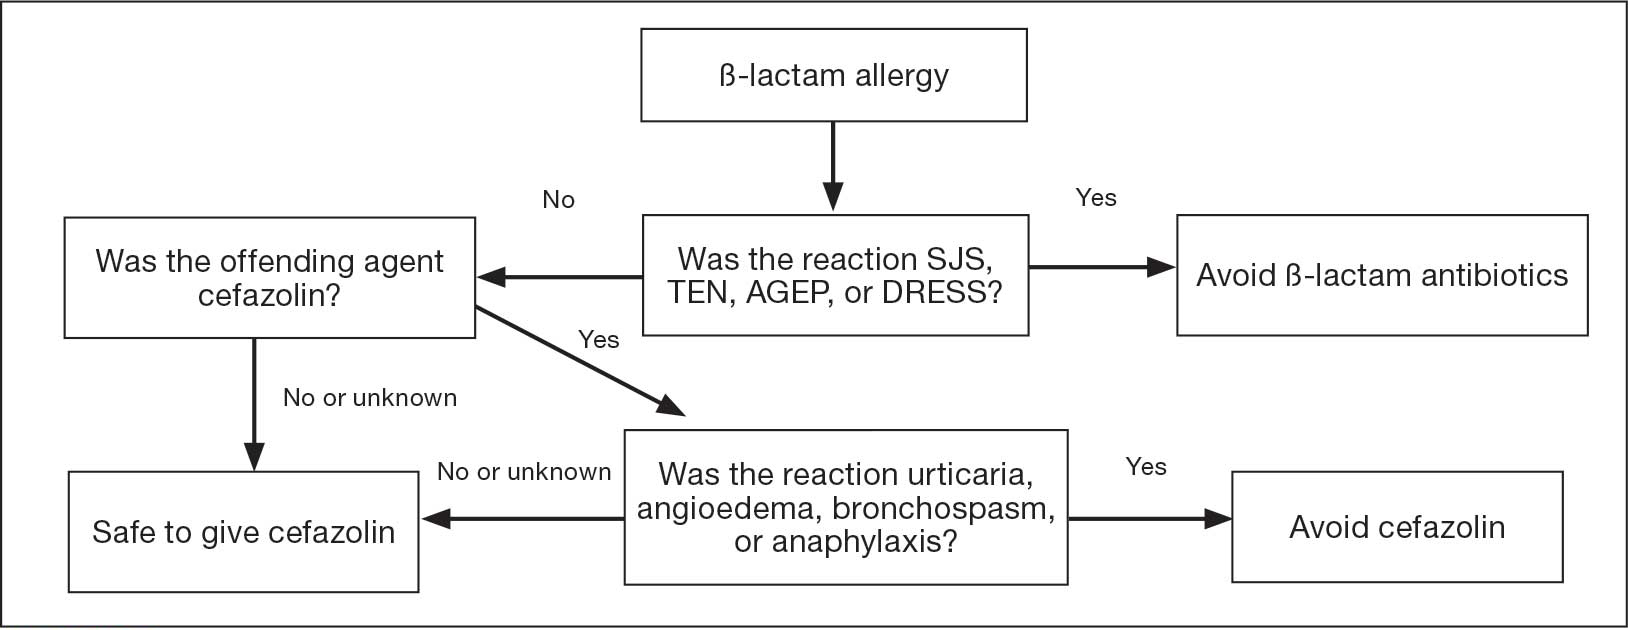
To date, minimal data exist to evaluate the incidence of ADRs when cefazolin is given perioperatively to patients with a previously documented penicillin allergy. The purpose of this study was to evaluate the incidence of allergic ADRs in patients who had a documented penicillin allergy and received periprocedural antibiotics.
Methods
This single-center, retrospective chart review used the US Department of Veterans Affairs (VA) Computerized Patient Record System (CPRS) to identify patients with a documented penicillin allergy who underwent an operation and received periprocedural antibiotics between February 1, 2023, and January 31, 2024. This study was reviewed and approved by the Indiana University Health Institutional Review Board and the VHI Research and Development Committee.
Patients were enrolled if they were aged ≥ 18 years, had a documented penicillin allergy, underwent a surgical intervention, and received perioperative antibiotics during the study period. Patients were excluded if they had a documented penicillin allergy resulting in severe delayed skin reactions (ie, SJS, TEN, or DRESS). These criteria produced 197 surgical procedures. Data were collected for each surgical procedure, so patients could be included more than once. Patient history of allergic reaction to penicillin was obtained through CPRS.
The primary endpoint was the percentage of allergic ADRs in patients with penicillin allergies receiving cefazolin perioperatively. Secondary outcomes included the appropriateness of the antibiotic regimen in congruence with American System of Health Pharmacists (ASHP) recommendations, incidence of SSIs within 30 days of the procedure, incidence of ADRs in those with a history of anaphylaxis vs nonanaphylaxis allergy, incidence of allergic reaction requiring pharmacologic and nonpharmacologic interventions, and incidence of acute kidney injury (AKI). AKI was defined as an increase in serum creatinine by ≥ 0.3 mg/dL within 48 hours or an increase in serum creatinine to ≥ 1.5 times baseline.
Demographic data included sex, age, race, preoperative serum creatinine, and postoperative serum creatinine. Anaphylaxis was defined as an acute onset of illness (within minutes to several hours) with involvement of skin, mucosal tissue, or both involving either respiratory compromise or reduced blood pressures. Allergic reactions were defined as facial, tongue, throat, airway, lip, mouth, periorbital, or eye swelling, urticaria, angioedema, dyspnea, anaphylaxis, or a positive penicillin skin test. Additionally, data collected included the description and severity of postprophylactic antibiotic reaction, antibiotic choice, interventions required for the allergic reaction, SSI occurrence, date of SSI, operating specialty, and postoperative change in renal function.
Descriptive statistics, including mean, SD, and percentages were reported for baseline characteristics of the study population. Percentages were used to demonstrate the differences in primary and secondary outcomes for each study group. Fisher exact tests were used for incidence of ADRs in patients with penicillin allergy who received cefazolin and reported incidence of SSIs.
Results
A total of 197 surgical procedures in patients with a documented penicillin allergy were included; 127 procedures used cefazolin perioperatively, 3 procedures used cefazolin plus gentamicin, and 67 procedures used other antibiotics. Most patients were White (n = 160; 81.2%), male (n = 158; 80.2%), and had a mean age of 64.9 years. Urology was the most common surgical specialty (n = 59; 29.9%) (Table 1). Of the 16 patients with documented penicillin anaphylaxis reaction, 8 received cefazolin and 8 received a different antibiotic. A total of 181 patients reported a nonanaphylaxis allergy. One hundred fifty-one patients (68.6%) reported a reaction history of hives, rash, or swelling (Table 2). Patients could report ≥ 1 reaction. The most prevalent antibiotics used were cefazolin, which was used by 130 patients (61.3%), and clindamycin which was used by 33 patients (15.6%) (Table 3). Patients could receive ≥ 1 antibiotic.
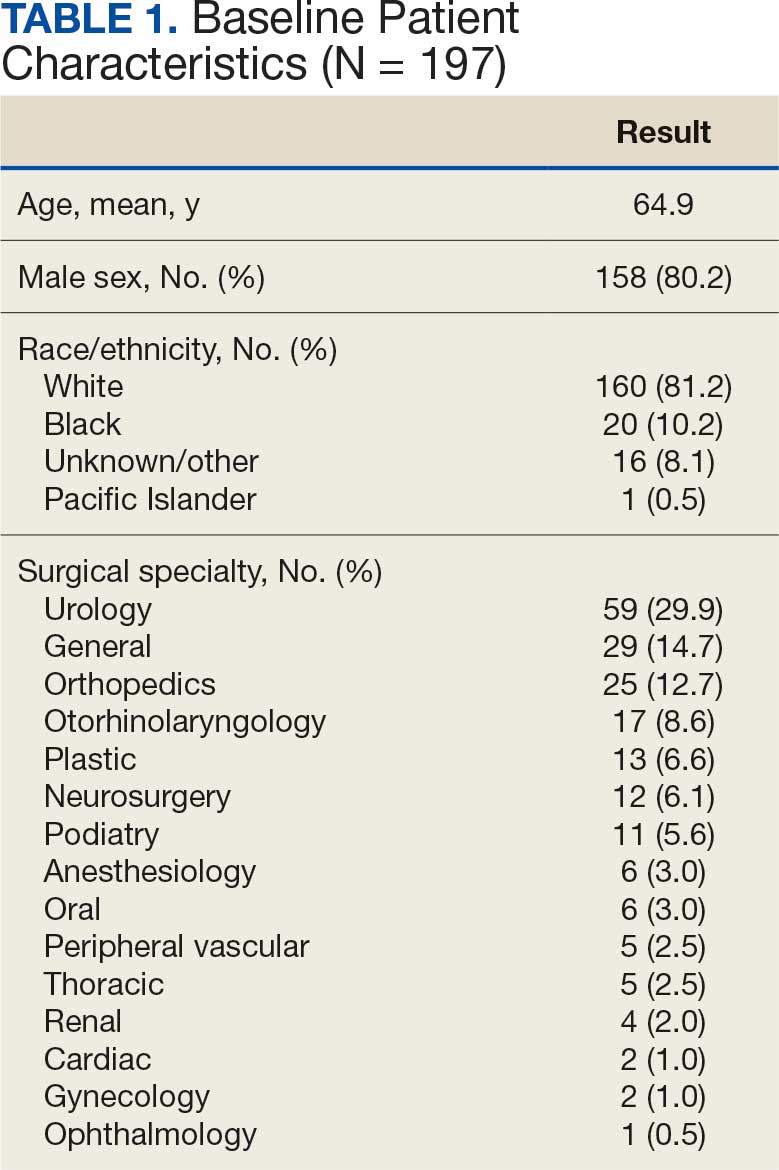
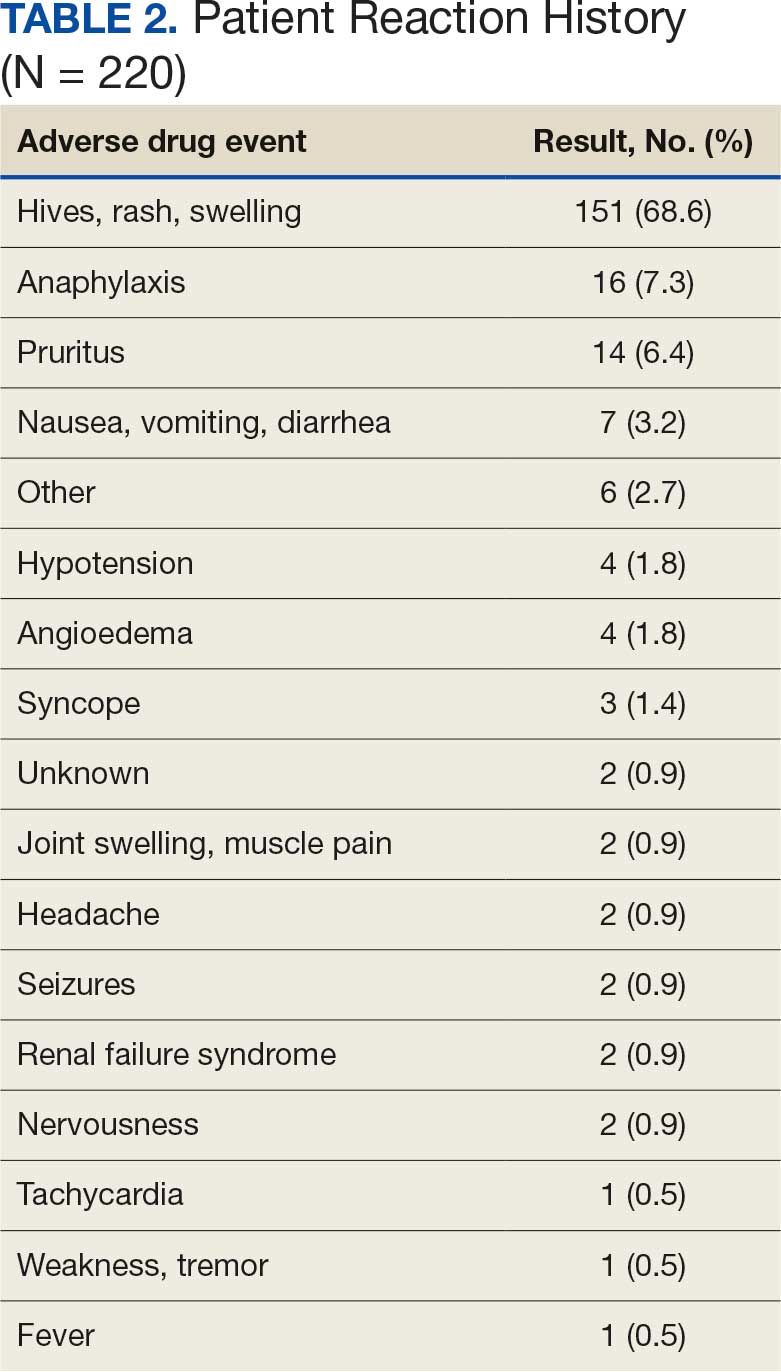
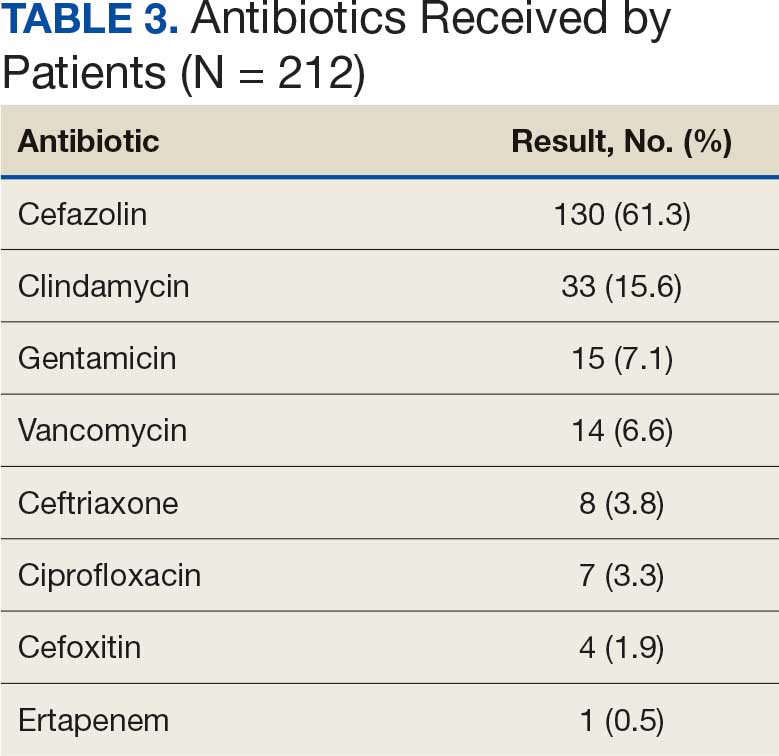
For the primary outcome, the incidence of allergic reactions in patients allergic to penicillin, there was no incidence of allergic reactions in either the cefazolin or other group. Given the absence of reactions, no interventions were required.
There were no ADRs in those with history of anaphylaxis or nonanaphylaxis allergy. In the cefazolin group, 126 of 127 surgical procedure regimens (99.2%) were congruent with ASHP recommendations, all 3 surgical procedures regimens in the cefazolin plus gentamicin group were congruent with ASHP recommendations, and 58 of 67 surgical procedure regimens (86.6%) in the other antibiotic group were congruent with ASHP recommendations. None of the 127 patients in the cefazolin group or of the 3 patients in the cefazolin plus gentamicin group reported an SSI, and 3 of 67 patients (4.5%) had an SSI in the other antibiotic group. One procedure that resulted in SSI was not congruent with ASHP recommendations. Twenty-four patients had 2 serum creatinine levels drawn within 48 hours of surgery. One of 12 patients (8.3%) and 0 of 12 patients had an AKI in the cefazolin and other antibiotic group, respectively (Table 4).
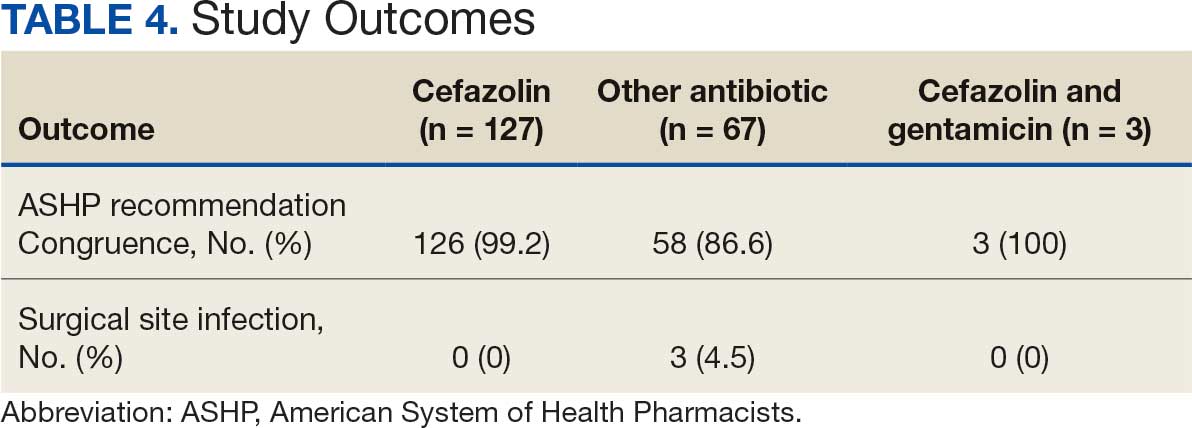
Discussion
Implementation of a screening tool at VHI allowed patients with documented penicillin allergy, including anaphylaxis, to receive cefazolin perioperatively. Broad spectrum antibiotics such as vancomycin, clindamycin, and fluoroquinolones are frequently used in patients allergic to penicillin, which can increase health care costs, risk of toxicity, and antimicrobial resistance.4 There was no incidence of allergic reactions noted in patients allergic to penicillin who received cefazolin. When comparing the incidence of observed allergic reactions to received perioperative antibiotics in the cefazolin group to previously published literature, no difference in allergy rates (P = .09) was found.3 Most antibiotics administered were congruent with ASHP guideline recommendations, and most patients eligible for cefazolin received it perioperatively.
Similar to this study, Goodman et al concluded that cefazolin appears to be a safe regimen in patients with documented penicillin anaphylactic reaction for surgical prophylaxis with only 1 (0.2%) potential allergic reaction.6 Patients who received cefazolin perioperatively had a statistically significant decrease in SSI rates. There were no clinically or statistically significant differences found between the proportion of allergic reactions or ADRs when compared to alternative antibiotics. Lessard et al concluded that a pharmacist-led interdisciplinary collaborative practice agreement increased cefazolin use in patients allergic to penicillin, including those with urticaria and anaphylaxis, with no reported ADRs.7 This study further demonstrated the safety of cefazolin use in patients with anaphylaxis to penicillin.
Limitations
This study’s single-center, retrospective design, patient population, and small sample size limit the generalizability of its results. The data collected are dependent on documentation in the chart. No ADRs were reported from the antibiotics patients received perioperatively. When considering safety data, information such as serum creatinine were available only in CPRS and some patients did not receive a postprocedure serum creatinine level. Additionally, this study did not investigate whether there was an increase in preferred preoperative antimicrobial prophylaxis after implementation of this protocol.
Conclusions
The results of this study support the use of cefazolin perioperatively in patients allergic to penicillin, including those with a history of anaphylaxis. Additional research should be conducted to validate data given the low incidence of ADRs. The primary outcome did not reach statistical significance, but the results may be clinically significant from a stewardship and safety perspective. VHI continues to use the screening tool described in this article.
- Bratzler DW, Dellinger EP, Olsen KM, et al. Clinical practice guidelines for antimicrobial prophylaxis in surgery. Am J Health Syst Pharm. 2013;70:195-283. doi:10.2146/ajhp120568
- Romano A, Valluzzi RL, Caruso C, et al. Tolerability of cefazolin and ceftibuten in patients with IgE-mediated aminopenicillin allergy. J Allergy Clin Immunol Pract. 2020;8:1989-1993.e2. doi:10.1016/j.jaip.2020.02.025
- Grant JM, Song WHC, Shajari S, et al. Safety of administering cefazolin versus other antibiotics in penicillin- allergic patients for surgical prophylaxis at a major Canadian teaching hospital. Surgery. 2021;170:783-789. doi:10.1016/j.surg.2021.03.022
- Centers for Disease Control and Prevention. Clinical Features of Penicillin Allergy. August 25, 2025. Accessed January 6, 2026. https://www.cdc.gov/antibiotic-use/hcp/clinical-signs/index.html
- Lam PW, Tarighi P, Elligsen M, et al. Impact of the allergy clarification for cefazolin evidence-based prescribing tool on receipt of preferred perioperative prophylaxis: an interrupted time series study. Clin Infect Dis. 2020;71:2955- 2957. doi:10.1093/cid/ciaa516
- Goodman EJ, Morgan MJ, Johnson Pa, et al. Cephalosporins can be given to penicillin-allergic patients who do not exhibit an anaphylactic response. J Clin Anesth. 2001;13:561-564. doi:10.1016/s0952-8180(01)00329-4
- Lessard S, Huiras C, Dababneh A, et al. Pharmacist adjustment of preoperative antibiotic orders to the preferred preoperative antibiotic cefazolin for patients with penicillin allergy labeling. Am J Health Syst Pharm. 2023;80:532- 536. doi:10.1093/ajhp/zxac385
Given its safety profile and bactericidal activity against the predominant organisms causing surgical site infections (SSIs), cefazolin remains the most popular choice for surgical prophylaxis.1 Cefazolin offers protection against the pathogens most likely to contaminate the surgical site while minimizing inappropriate methicillin- resistant Staphylococcus aureus coverage that occurs with alternatives such as vancomycin and clindamycin. Documented allergies to Β-lactam antibiotics have historically forced clinicians to avoid the use of cephalosporins due to the potential risk of cross-reactivity. True type 1 (immunoglobin E [IgE]-mediated) cross-allergic reactions between penicillin and cephalosporins are rare, and previously reported data indicate cross-reactivity as a result of antibody recognition is more closely related to the side-chain identity rather than the Β-lactam ring.2,3
About 10% of US patients report having a penicillin allergy; however, < 1% of the population has a true IgE-mediated allergic reaction.4 Previous research that has challenged penicillin allergies with cefazolin for surgical prophylaxis has reported minimal rates of allergic reactions.2-5
In previous trials, patients with a history of delayed skin reactions, such as Stevens-Johnson syndrome (SJS), toxic epidermal necrolysis (TEN), and drug reaction with eosinophilia and systemic symptoms (DRESS), were excluded. Additionally, patients with an allergy to cefazolin including those with urticaria, angioedema, bronchospasm, or anaphylaxis, were excluded from perioperative retrial of cefazolin. Grant et al found that cefazolin can be safely given to patients with IgE-mediated reactions to penicillin and other cephalosporins due to a structurally different side chain.3
In January 2023, the Veteran Health Indiana (VHI) pharmacy team in conjunction with surgery, infectious disease, and anesthesiology, implemented a screening tool as an amendment to perioperative antibiotic guidance to help determine which patients with a documented penicillin allergy could be candidates for perioperative cefazolin. The implemented screening tool (Allergy Clarification for Cefazolin Evidence-Based Prescribing Tool) has been described by Lam et al, who reported that an increased proportion of patients with documented penicillin allergy received cefazolin without more adverse drug reactions (ADRs).5 Patients with a Β-lactam allergy were eligible to receive cefazolin unless the ADR was SJS, TEN, or DRESS, or the offending agent was cefazolin and the patient experienced urticaria, angioedema, bronchospasm, or anaphylaxis. If the reaction was not from cefazolin or was unknown, patients were eligible to receive cefazolin (Figure).
To date, minimal data exist to evaluate the incidence of ADRs when cefazolin is given perioperatively to patients with a previously documented penicillin allergy. The purpose of this study was to evaluate the incidence of allergic ADRs in patients who had a documented penicillin allergy and received periprocedural antibiotics.
Methods
This single-center, retrospective chart review used the US Department of Veterans Affairs (VA) Computerized Patient Record System (CPRS) to identify patients with a documented penicillin allergy who underwent an operation and received periprocedural antibiotics between February 1, 2023, and January 31, 2024. This study was reviewed and approved by the Indiana University Health Institutional Review Board and the VHI Research and Development Committee.
Patients were enrolled if they were aged ≥ 18 years, had a documented penicillin allergy, underwent a surgical intervention, and received perioperative antibiotics during the study period. Patients were excluded if they had a documented penicillin allergy resulting in severe delayed skin reactions (ie, SJS, TEN, or DRESS). These criteria produced 197 surgical procedures. Data were collected for each surgical procedure, so patients could be included more than once. Patient history of allergic reaction to penicillin was obtained through CPRS.
The primary endpoint was the percentage of allergic ADRs in patients with penicillin allergies receiving cefazolin perioperatively. Secondary outcomes included the appropriateness of the antibiotic regimen in congruence with American System of Health Pharmacists (ASHP) recommendations, incidence of SSIs within 30 days of the procedure, incidence of ADRs in those with a history of anaphylaxis vs nonanaphylaxis allergy, incidence of allergic reaction requiring pharmacologic and nonpharmacologic interventions, and incidence of acute kidney injury (AKI). AKI was defined as an increase in serum creatinine by ≥ 0.3 mg/dL within 48 hours or an increase in serum creatinine to ≥ 1.5 times baseline.
Demographic data included sex, age, race, preoperative serum creatinine, and postoperative serum creatinine. Anaphylaxis was defined as an acute onset of illness (within minutes to several hours) with involvement of skin, mucosal tissue, or both involving either respiratory compromise or reduced blood pressures. Allergic reactions were defined as facial, tongue, throat, airway, lip, mouth, periorbital, or eye swelling, urticaria, angioedema, dyspnea, anaphylaxis, or a positive penicillin skin test. Additionally, data collected included the description and severity of postprophylactic antibiotic reaction, antibiotic choice, interventions required for the allergic reaction, SSI occurrence, date of SSI, operating specialty, and postoperative change in renal function.
Descriptive statistics, including mean, SD, and percentages were reported for baseline characteristics of the study population. Percentages were used to demonstrate the differences in primary and secondary outcomes for each study group. Fisher exact tests were used for incidence of ADRs in patients with penicillin allergy who received cefazolin and reported incidence of SSIs.
Results
A total of 197 surgical procedures in patients with a documented penicillin allergy were included; 127 procedures used cefazolin perioperatively, 3 procedures used cefazolin plus gentamicin, and 67 procedures used other antibiotics. Most patients were White (n = 160; 81.2%), male (n = 158; 80.2%), and had a mean age of 64.9 years. Urology was the most common surgical specialty (n = 59; 29.9%) (Table 1). Of the 16 patients with documented penicillin anaphylaxis reaction, 8 received cefazolin and 8 received a different antibiotic. A total of 181 patients reported a nonanaphylaxis allergy. One hundred fifty-one patients (68.6%) reported a reaction history of hives, rash, or swelling (Table 2). Patients could report ≥ 1 reaction. The most prevalent antibiotics used were cefazolin, which was used by 130 patients (61.3%), and clindamycin which was used by 33 patients (15.6%) (Table 3). Patients could receive ≥ 1 antibiotic.
For the primary outcome, the incidence of allergic reactions in patients allergic to penicillin, there was no incidence of allergic reactions in either the cefazolin or other group. Given the absence of reactions, no interventions were required.
There were no ADRs in those with history of anaphylaxis or nonanaphylaxis allergy. In the cefazolin group, 126 of 127 surgical procedure regimens (99.2%) were congruent with ASHP recommendations, all 3 surgical procedures regimens in the cefazolin plus gentamicin group were congruent with ASHP recommendations, and 58 of 67 surgical procedure regimens (86.6%) in the other antibiotic group were congruent with ASHP recommendations. None of the 127 patients in the cefazolin group or of the 3 patients in the cefazolin plus gentamicin group reported an SSI, and 3 of 67 patients (4.5%) had an SSI in the other antibiotic group. One procedure that resulted in SSI was not congruent with ASHP recommendations. Twenty-four patients had 2 serum creatinine levels drawn within 48 hours of surgery. One of 12 patients (8.3%) and 0 of 12 patients had an AKI in the cefazolin and other antibiotic group, respectively (Table 4).
Discussion
Implementation of a screening tool at VHI allowed patients with documented penicillin allergy, including anaphylaxis, to receive cefazolin perioperatively. Broad spectrum antibiotics such as vancomycin, clindamycin, and fluoroquinolones are frequently used in patients allergic to penicillin, which can increase health care costs, risk of toxicity, and antimicrobial resistance.4 There was no incidence of allergic reactions noted in patients allergic to penicillin who received cefazolin. When comparing the incidence of observed allergic reactions to received perioperative antibiotics in the cefazolin group to previously published literature, no difference in allergy rates (P = .09) was found.3 Most antibiotics administered were congruent with ASHP guideline recommendations, and most patients eligible for cefazolin received it perioperatively.
Similar to this study, Goodman et al concluded that cefazolin appears to be a safe regimen in patients with documented penicillin anaphylactic reaction for surgical prophylaxis with only 1 (0.2%) potential allergic reaction.6 Patients who received cefazolin perioperatively had a statistically significant decrease in SSI rates. There were no clinically or statistically significant differences found between the proportion of allergic reactions or ADRs when compared to alternative antibiotics. Lessard et al concluded that a pharmacist-led interdisciplinary collaborative practice agreement increased cefazolin use in patients allergic to penicillin, including those with urticaria and anaphylaxis, with no reported ADRs.7 This study further demonstrated the safety of cefazolin use in patients with anaphylaxis to penicillin.
Limitations
This study’s single-center, retrospective design, patient population, and small sample size limit the generalizability of its results. The data collected are dependent on documentation in the chart. No ADRs were reported from the antibiotics patients received perioperatively. When considering safety data, information such as serum creatinine were available only in CPRS and some patients did not receive a postprocedure serum creatinine level. Additionally, this study did not investigate whether there was an increase in preferred preoperative antimicrobial prophylaxis after implementation of this protocol.
Conclusions
The results of this study support the use of cefazolin perioperatively in patients allergic to penicillin, including those with a history of anaphylaxis. Additional research should be conducted to validate data given the low incidence of ADRs. The primary outcome did not reach statistical significance, but the results may be clinically significant from a stewardship and safety perspective. VHI continues to use the screening tool described in this article.
- Bratzler DW, Dellinger EP, Olsen KM, et al. Clinical practice guidelines for antimicrobial prophylaxis in surgery. Am J Health Syst Pharm. 2013;70:195-283. doi:10.2146/ajhp120568
- Romano A, Valluzzi RL, Caruso C, et al. Tolerability of cefazolin and ceftibuten in patients with IgE-mediated aminopenicillin allergy. J Allergy Clin Immunol Pract. 2020;8:1989-1993.e2. doi:10.1016/j.jaip.2020.02.025
- Grant JM, Song WHC, Shajari S, et al. Safety of administering cefazolin versus other antibiotics in penicillin- allergic patients for surgical prophylaxis at a major Canadian teaching hospital. Surgery. 2021;170:783-789. doi:10.1016/j.surg.2021.03.022
- Centers for Disease Control and Prevention. Clinical Features of Penicillin Allergy. August 25, 2025. Accessed January 6, 2026. https://www.cdc.gov/antibiotic-use/hcp/clinical-signs/index.html
- Lam PW, Tarighi P, Elligsen M, et al. Impact of the allergy clarification for cefazolin evidence-based prescribing tool on receipt of preferred perioperative prophylaxis: an interrupted time series study. Clin Infect Dis. 2020;71:2955- 2957. doi:10.1093/cid/ciaa516
- Goodman EJ, Morgan MJ, Johnson Pa, et al. Cephalosporins can be given to penicillin-allergic patients who do not exhibit an anaphylactic response. J Clin Anesth. 2001;13:561-564. doi:10.1016/s0952-8180(01)00329-4
- Lessard S, Huiras C, Dababneh A, et al. Pharmacist adjustment of preoperative antibiotic orders to the preferred preoperative antibiotic cefazolin for patients with penicillin allergy labeling. Am J Health Syst Pharm. 2023;80:532- 536. doi:10.1093/ajhp/zxac385
Outcomes From the Use of Cefazolin for Surgical Prophylaxis in Patients Allergic to Penicillin
Outcomes From the Use of Cefazolin for Surgical Prophylaxis in Patients Allergic to Penicillin
The Gap in VA Dental Care is Nothing to Smile About
The Gap in VA Dental Care is Nothing to Smile About
For there was never yet philosopher that could endure the toothache patiently
Much Ado About Nothing by William Shakespeare
Almost anyone who has worked for a long time in a US Department of Veterans Affairs (VA) clinic or hospital has had patients in dire need of dental services who could neither access nor pay for them. I have seen dental problems ranging from older veterans who were nearly edentulous and needed expensive dentures or implants to younger veterans who never had regular dental care and needed a periodontist to save their teeth, to individuals with terrible toothaches that antibiotics could not cure. As Shakespeare quips in Much Ado About Nothing, almost nothing is worse than a toothache.
Many VA primary care practitioners and social workers kept lists of local sliding-scale dentists or arranged for veterans to visit dental and hygiene school clinics for reduced fees. Even when VA dentists were not permitted to see a veteran, many would assist in finding them affordable care in the community. However, that was never enough to meet the oral health needs of veterans. One of the most common complaints of patients who otherwise were pleased with their VA health care was that it did not cover dental services.1
Most veterans qualify for health care and other VA benefits. Dental care is an exception, with only about a quarter (26%) of the > 9 million veterans active in the Veterans Health Administration (VHA) eligible for care. Even under this restricted eligibility, about 888,000 veterans have received dental services either through the VHA or in the community. In 2025, the VA paid community-based dentists for > 3.5 million procedures for veterans, which underscores the magnitude of the demand.2
Given the gap in dental care, many veterans and their caregivers both personal and professional will likely be encouraged that in February the VA announced plans to improve access to dental care through expanding community care dental services. “Dental health is a critical component of overall well-being,” VA Secretary Doug Collins noted. VA issued a request for proposals (RFP) for a new dental administrator who would oversee the operations of a new network of dental practitioners. The new vendor contract would operationalize general dental services, like tooth extractions, as well as specialized services such as periodontics, dentures, and pharmacy support for dental medications. Most importantly, the new program would cover preventive care to help avoid many of the dental problems veterans now experience. Proposals are due March 16.2
Yet, there is a catch. The community care program will only be available to eligible veterans just like previous dental services both in the VA and the community. I was always somewhat ashamed that despite my working decades at the VHA, I never had a satisfactory answer for veterans who asked me why they were not eligible for dental care. The regulatory response is that eligibility for dental services is a complex determination depending on service-connected military service, and specialized clinical indices. Dental coverage is provided for veterans who have 100% service-connected or total disability, prisoners of war, and veterans whose dental disease exacerbates a comorbid medical condition. Those not eligible for VA dental coverage may still get treatment if they, for example, have a cancer diagnosis and without dental work the chemotherapy treatment would place them at a higher risk of an oral infection. Veterans participating in a rehabilitation program who have poor dentition that prevents them from reaching their rehabilitative goals also may receive VA dental care. In addition, some veterans who are experiencing homelessness and others who did not receive a dental examination prior to discharge from active duty may be eligible for dental benefits.3 VA also offers lower-priced dental insurance for ineligible veterans.4
The new RFP does little to expand eligibility of veterans to receive VA dental care, and it is hard to not see the announcement as another step in the privatization of VHA. Medically and ethically, it seems to perpetuate a double standard between physical and oral health that makes no scientific sense.5-7 I sometimes joke that in medical school we had maybe 2 days of teaching about teeth and even that limited exposure to dental pathology was sufficient for us to learn that chronic conditions like respiratory disease and lifestyle choices like poor diet cause and contribute to dental problems.
Like so many areas of veteran care, dental health in veterans is worse compared with those who never served, making it harder to justify the exclusion of dental services from veteran health benefits. A study in Military Medicine looked at 11,539 former service members and found a higher prevalence of individuals with tooth decay, missing teeth, tooth fillings, caries, and periodontitis. While military service per se was not associated with the findings, higher rates of hypertension, hyperlipidemia, depression, and diabetes in veterans compared with nonveterans, which are related to serving in uniform, were covariates.8
That depression is an indirect factor in dental disease may seem surprising. However, this is more evidence that human health is truly holistic, with mutual interactions between the body (including the teeth) and mind. Oral care needs to be incorporated into the VA whole health approach for all veterans. In a series of articles in Psychiatric News, VA psychiatrist Antoinette Shappell and VA dentist Pierre Cartier identify several links between dental and mental health.9,10 Veterans with anxiety disorders may fear going to the dentist even when care is needed. Serious mental illness may result in poor diet, and difficulty performing preventive care. Many psychotropic medications may cause xerostomia that worsens tooth decay and veterans with posttraumatic stress disorder may suffer from bruxism. I regularly saw these conditions when I worked in a primary care psychiatry clinic. Being able to coordinate with VA dentists and staff to provide integrated care would have benefited these already burdened veterans.
An estimated $5.4 billion has been spent on 3.6 million veterans who were seen in emergency departments for dental problems. That cost alone should convince policy makers that the deficit in VA dental care needs to be filled with efficacious high-quality comprehensive dental services for as many veterans as possible. And there are signs that is exactly what is happening in Congress. A bill in the House of Representatives proposes to expand dental care benefits to all veterans eligible for other VA health benefits.11 There are also other legislative initiatives in the works.4 Together with the VA’s plans for a new community care dental network, that does give veterans and federal practitioners something to smile about.
- Shane L III. A dental debacle: why veterans struggle to navigate VA’s oral care. Military Times. June 17, 2024. Accessed February 25, 2026. https://www.militarytimes.com/news/your-military/2024/06/17/a-dental-debacle-why-veterans-struggle-to-navigate-vas-oral-care/
- US Dept of Veterans Affairs Office of Media Relations. VA moves to improve dental care access to eligible veterans. VA News. February 18, 2026. Accessed February 23, 2026. https://news.va.gov/145117/va-improve-dental-care-access-eligible-veterans/
- Wile B. VA launches plans to expand dental care access for veterans. Military.com. February 16, 2026. Accessed February 23, 2026. https://www.military.com/benefits/veterans-healthcare/va-launches-plan-expand-dental-care-access-veterans.html
- US Department of Veterans Affairs. VA Dental Insurance Program (VADIP). Updated May 1, 2024. Accessed February 23, 2026. https://www.va.gov/health-care/about-va-health-benefits/dental-care/dental-insurance/
- McMains V. Healthy mouth, healthy body. National Institutes of Health, National Institute of Dental and Craniofacial Research. May 8, 2024. Accessed February 23, 2026. https:// www.nidcr.nih.gov/news-events/nidcr-news/2024/healthy-mouth-healthy-body
- Seymour GJ. Good oral health is essential for good general health: the oral–systemic connection. Clin Microbiol Infect. 2007;13:1-2. doi:10.1111/j.1469-0691.2007.01797.x
- Martin SA, Simon L. Oral health and medicine integration: overcoming historical artifact to relieve suffering. Am J Public Health. 2017;107:S30-S31. doi:10.2105/AJPH.2017.303683
- Schindler DK, Lopez Mitnik GV, Solivan-Ortiz DC, et al. Oral health status among adults with and without prior active duty service in the US Armed Forces, NHANES 2011-2014. Mil Med. 2021;186:e149-e159. doi:10.1093/milmed/usaa355
- Shappell AV, Cartier PM. Understanding the mental-dental health connection said to be integral to patient care. Psychiatr News. 2023;58. doi:10.1176/appi.pn.2023.07.6.15
- Shappell AV, Cartier PM. Good ‘mental-dental’ health important in preventing, slowing dementia. Psychiatr News. 2023;58. doi:10.1176/appi.pn.2023.08.8.64
- Dental Care for Veterans Act, HR 210, 119th Cong (2025- 2026). Accessed February 23, 2026. https://www.congress.gov/bill/119th-congress/house-bill/210
For there was never yet philosopher that could endure the toothache patiently
Much Ado About Nothing by William Shakespeare
Almost anyone who has worked for a long time in a US Department of Veterans Affairs (VA) clinic or hospital has had patients in dire need of dental services who could neither access nor pay for them. I have seen dental problems ranging from older veterans who were nearly edentulous and needed expensive dentures or implants to younger veterans who never had regular dental care and needed a periodontist to save their teeth, to individuals with terrible toothaches that antibiotics could not cure. As Shakespeare quips in Much Ado About Nothing, almost nothing is worse than a toothache.
Many VA primary care practitioners and social workers kept lists of local sliding-scale dentists or arranged for veterans to visit dental and hygiene school clinics for reduced fees. Even when VA dentists were not permitted to see a veteran, many would assist in finding them affordable care in the community. However, that was never enough to meet the oral health needs of veterans. One of the most common complaints of patients who otherwise were pleased with their VA health care was that it did not cover dental services.1
Most veterans qualify for health care and other VA benefits. Dental care is an exception, with only about a quarter (26%) of the > 9 million veterans active in the Veterans Health Administration (VHA) eligible for care. Even under this restricted eligibility, about 888,000 veterans have received dental services either through the VHA or in the community. In 2025, the VA paid community-based dentists for > 3.5 million procedures for veterans, which underscores the magnitude of the demand.2
Given the gap in dental care, many veterans and their caregivers both personal and professional will likely be encouraged that in February the VA announced plans to improve access to dental care through expanding community care dental services. “Dental health is a critical component of overall well-being,” VA Secretary Doug Collins noted. VA issued a request for proposals (RFP) for a new dental administrator who would oversee the operations of a new network of dental practitioners. The new vendor contract would operationalize general dental services, like tooth extractions, as well as specialized services such as periodontics, dentures, and pharmacy support for dental medications. Most importantly, the new program would cover preventive care to help avoid many of the dental problems veterans now experience. Proposals are due March 16.2
Yet, there is a catch. The community care program will only be available to eligible veterans just like previous dental services both in the VA and the community. I was always somewhat ashamed that despite my working decades at the VHA, I never had a satisfactory answer for veterans who asked me why they were not eligible for dental care. The regulatory response is that eligibility for dental services is a complex determination depending on service-connected military service, and specialized clinical indices. Dental coverage is provided for veterans who have 100% service-connected or total disability, prisoners of war, and veterans whose dental disease exacerbates a comorbid medical condition. Those not eligible for VA dental coverage may still get treatment if they, for example, have a cancer diagnosis and without dental work the chemotherapy treatment would place them at a higher risk of an oral infection. Veterans participating in a rehabilitation program who have poor dentition that prevents them from reaching their rehabilitative goals also may receive VA dental care. In addition, some veterans who are experiencing homelessness and others who did not receive a dental examination prior to discharge from active duty may be eligible for dental benefits.3 VA also offers lower-priced dental insurance for ineligible veterans.4
The new RFP does little to expand eligibility of veterans to receive VA dental care, and it is hard to not see the announcement as another step in the privatization of VHA. Medically and ethically, it seems to perpetuate a double standard between physical and oral health that makes no scientific sense.5-7 I sometimes joke that in medical school we had maybe 2 days of teaching about teeth and even that limited exposure to dental pathology was sufficient for us to learn that chronic conditions like respiratory disease and lifestyle choices like poor diet cause and contribute to dental problems.
Like so many areas of veteran care, dental health in veterans is worse compared with those who never served, making it harder to justify the exclusion of dental services from veteran health benefits. A study in Military Medicine looked at 11,539 former service members and found a higher prevalence of individuals with tooth decay, missing teeth, tooth fillings, caries, and periodontitis. While military service per se was not associated with the findings, higher rates of hypertension, hyperlipidemia, depression, and diabetes in veterans compared with nonveterans, which are related to serving in uniform, were covariates.8
That depression is an indirect factor in dental disease may seem surprising. However, this is more evidence that human health is truly holistic, with mutual interactions between the body (including the teeth) and mind. Oral care needs to be incorporated into the VA whole health approach for all veterans. In a series of articles in Psychiatric News, VA psychiatrist Antoinette Shappell and VA dentist Pierre Cartier identify several links between dental and mental health.9,10 Veterans with anxiety disorders may fear going to the dentist even when care is needed. Serious mental illness may result in poor diet, and difficulty performing preventive care. Many psychotropic medications may cause xerostomia that worsens tooth decay and veterans with posttraumatic stress disorder may suffer from bruxism. I regularly saw these conditions when I worked in a primary care psychiatry clinic. Being able to coordinate with VA dentists and staff to provide integrated care would have benefited these already burdened veterans.
An estimated $5.4 billion has been spent on 3.6 million veterans who were seen in emergency departments for dental problems. That cost alone should convince policy makers that the deficit in VA dental care needs to be filled with efficacious high-quality comprehensive dental services for as many veterans as possible. And there are signs that is exactly what is happening in Congress. A bill in the House of Representatives proposes to expand dental care benefits to all veterans eligible for other VA health benefits.11 There are also other legislative initiatives in the works.4 Together with the VA’s plans for a new community care dental network, that does give veterans and federal practitioners something to smile about.
- Shane L III. A dental debacle: why veterans struggle to navigate VA’s oral care. Military Times. June 17, 2024. Accessed February 25, 2026. https://www.militarytimes.com/news/your-military/2024/06/17/a-dental-debacle-why-veterans-struggle-to-navigate-vas-oral-care/
- US Dept of Veterans Affairs Office of Media Relations. VA moves to improve dental care access to eligible veterans. VA News. February 18, 2026. Accessed February 23, 2026. https://news.va.gov/145117/va-improve-dental-care-access-eligible-veterans/
- Wile B. VA launches plans to expand dental care access for veterans. Military.com. February 16, 2026. Accessed February 23, 2026. https://www.military.com/benefits/veterans-healthcare/va-launches-plan-expand-dental-care-access-veterans.html
- US Department of Veterans Affairs. VA Dental Insurance Program (VADIP). Updated May 1, 2024. Accessed February 23, 2026. https://www.va.gov/health-care/about-va-health-benefits/dental-care/dental-insurance/
- McMains V. Healthy mouth, healthy body. National Institutes of Health, National Institute of Dental and Craniofacial Research. May 8, 2024. Accessed February 23, 2026. https:// www.nidcr.nih.gov/news-events/nidcr-news/2024/healthy-mouth-healthy-body
- Seymour GJ. Good oral health is essential for good general health: the oral–systemic connection. Clin Microbiol Infect. 2007;13:1-2. doi:10.1111/j.1469-0691.2007.01797.x
- Martin SA, Simon L. Oral health and medicine integration: overcoming historical artifact to relieve suffering. Am J Public Health. 2017;107:S30-S31. doi:10.2105/AJPH.2017.303683
- Schindler DK, Lopez Mitnik GV, Solivan-Ortiz DC, et al. Oral health status among adults with and without prior active duty service in the US Armed Forces, NHANES 2011-2014. Mil Med. 2021;186:e149-e159. doi:10.1093/milmed/usaa355
- Shappell AV, Cartier PM. Understanding the mental-dental health connection said to be integral to patient care. Psychiatr News. 2023;58. doi:10.1176/appi.pn.2023.07.6.15
- Shappell AV, Cartier PM. Good ‘mental-dental’ health important in preventing, slowing dementia. Psychiatr News. 2023;58. doi:10.1176/appi.pn.2023.08.8.64
- Dental Care for Veterans Act, HR 210, 119th Cong (2025- 2026). Accessed February 23, 2026. https://www.congress.gov/bill/119th-congress/house-bill/210
The Gap in VA Dental Care is Nothing to Smile About
The Gap in VA Dental Care is Nothing to Smile About
Seventy-Five Percent of Total Energy Intake Comes From Ultra-Processed Foods Among a Sample of Veterans With Overweight and Obesity: An Exploratory Analysis of Three-Day Food Records
Seventy-Five Percent of Total Energy Intake Comes From Ultra-Processed Foods Among a Sample of Veterans With Overweight and Obesity: An Exploratory Analysis of Three-Day Food Records
Roughly 8.6% of the 17.4 million US veterans live in poverty. About 11.1% are considered food insecure (ie, unable to acquire adequate food for ≥1 household members), with another 5.3% considered very food insecure (ie, eating patterns of ≥1 household members were disrupted and their food intake was reduced at least some time during the year). Compared with nonveterans, veterans are 7.4% more likely to be food insecure.1 This high prevalence of food insecurity and poverty has a negative impact on veteran diets.
Veterans’ diets contained more added sugars and solid fats and scored lower compared with nonveterans when assessed for diet quality with the Healthy Eating Index.2 Veterans have a higher prevalence of diet-related chronic disease, including diabetes, hypertension, and obesity compared with the nonveterans.3-5 Given the critical role of diet in health and disease risk, enhancing diet quality among veterans has garnered significant attention and calls to action.2,6,7 While there are many factors that contribute to diet, any veteran can receive a consultation or self-refer to receive nutrition counseling effective for improving diet quality, within the US Department of Veterans Affairs (VA).
The NOVA food classification system describes diet quality by categorizing food items by processing methods and ingredients into 4 food groups.8 The first is unprocessed and minimally processed items (MPFs) such as fresh fruits, vegetables, and meats. MPFs consist of whole foods which can also be minimally processed (eg, chopping, drying, grinding, heating, chilling). Culinary processed foods (CPFs) are processed foods for cooking (eg, salt, butter, and vinegar) and are typically eaten in small quantities along with MPFs. Processed foods (PRFs) include canned and smoked foods, while ultra-processed foods (UPFs) are distinguished by industrial ingredients, requiring specialized tools and processing techniques, and hyper-palatability related to color, flavor, and packaging.8 Examples of UPFs include mass-produced breads found at grocery stores, prepackaged snacks and meals, and hydrogenated oils. UPF consumption is associated with higher risk for negative cardiometabolic outcomes, common mental disorders, and all-cause mortality.9 To date, only a study by Powell et al has used the NOVA classification system in a veteran population, and it was limited to a comparison of the price of UPFs and veteran body mass index (BMI).10 Therefore, it remains unknown what percentage of total energy intake (TEI) comes from UPFs in the diets of veterans.
This study sought to quantify the proportion of TEI from UPFs among a sample of patients from the VA Phoenix Health Care System (VAPHCS). Results from a 2021 global meta-analysis reveal that the US and United Kingdom have the highest intakes of UPFs in the world.11 Specifically, within the US, 15 studies with 234,890 participants reveal that the majority of TEI (about 55%) comes from UPFs.11 We hypothesized that this veteran sample would have a higher proportion of TEI from UPFs, possibly due to a higher prevalence of poverty and food insecurity among veterans compared with nonveterans.1 If the percentage of TEI coming from UPF is higher or even similar to nonveterans, further efforts to increase veterans’ use of the available nutritional services would be warranted to minimize nutrition-related disease among veterans.
Methods
This is a cross-sectional, secondary data analysis of baseline 3-day food records collected from 2017 to 2020 from 92 patients recruited at VAPHCS to participate in a whole-food plant-based diet study.12 The original study was reviewed and approved by the VAPHCS Institutional Review Board (1593830). Recruitment methods included clinician recommendation, a recorded advertisement played while phone calls were on hold, and flyers distributed throughout VAPHCS. Patients were included if they were aged 18 to 90 years, had a BMI 25.1 to 39.9, had a diagnosis of nutrition-related chronic disease (hypertension, diabetes, or hyperlipidemia), an interest and desire to make a lifestyle change, active telephone contact information (either landline or cell phone), no contraindication to be on a whole-food plant-based diet, access to transportation and a functioning kitchen, ability to prepare meals independently, access to a computer or tablet with internet access, and a digital camera or smartphone. Exclusion criteria included significant unplanned weight loss within 6 months, uncontrolled insulin-dependent diabetes with a current hemoglobin A1c > 9%, pregnancy/lactation, taking prescribed weight loss medication, currently following a diet (eg, plant-based diet, vegan, or medical weight loss program diet), celiac disease diagnosed within 6 months, end-stage hepatic disease or renal disease requiring dialysis, active cancer or receiving chemotherapy or radiation therapy, active alcohol or substance use disorder, history of eating disorders, fasting triglyceride level > 350 mg/dL, any psychological issues that prevent adherence, inability to speak English, limited mobility, and homeless or in housing with limited kitchen access. A baseline 3-day food record was collected from the participants and used in this secondary analysis.
Diet Analysis
Food records were analyzed using Esha Research Food Processor 4.0 to identify calorie and macronutrient information. To limit bias, food items were coded independently by 2 researchers into 4 food processing groups determined by the NOVA classification: MPF, CPF, PRF, and UPF.8 When possible, specific ingredient information was collected using internet searches for brand product websites. Initial coding had an 89% agreement rate for food item coding between the 2 researchers. As coding was done in duplicate, a third researcher resolved disagreements. The number of food items for each processing group was determined and the mean (SD) percentage of TEI for each NOVA group was provided across participants. A 1-way analysis of variance and Tukey Multiple Comparisons Test were used to determine significance between groups with an α = .05 using Prism V9.
Results
Of the 92 participants in the original study, only 79 met inclusion criteria and had baseline diet data. The 79 veterans had a mean (SD) age of 61 (13) years and 59 (75%) were male (Table 1). Mean (SD) TEI was 1921 (815) kcal. The mean (SD) percentage of calories from carbohydrate, fat, and protein were 46% (21%), 39% (20%), and 16% (6%), respectively (Table 2).
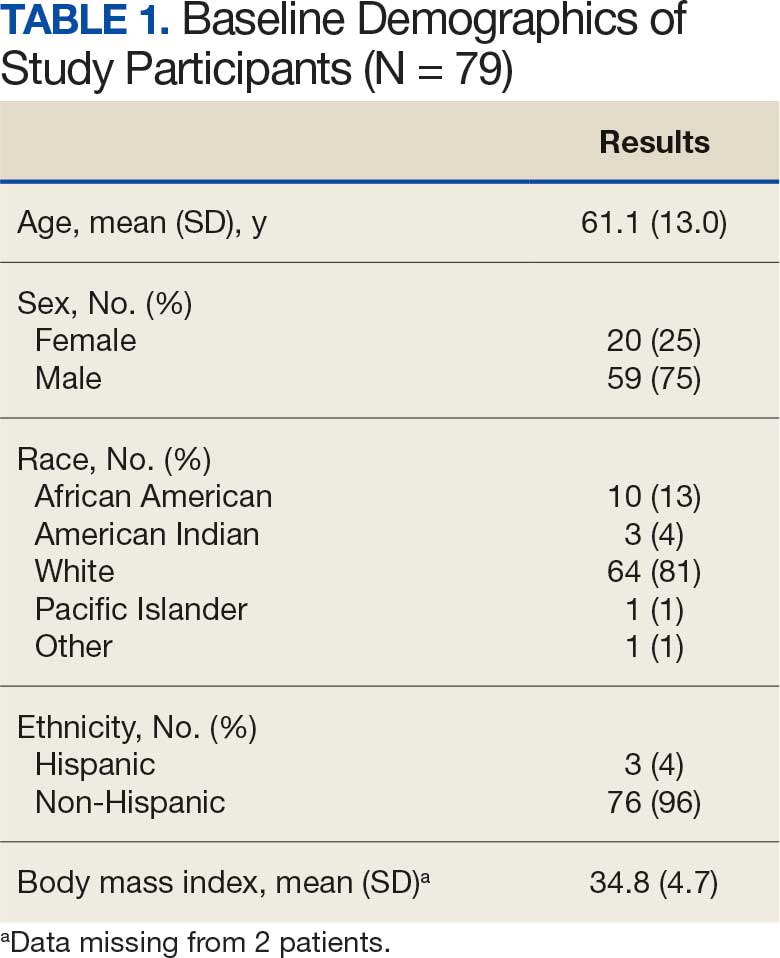
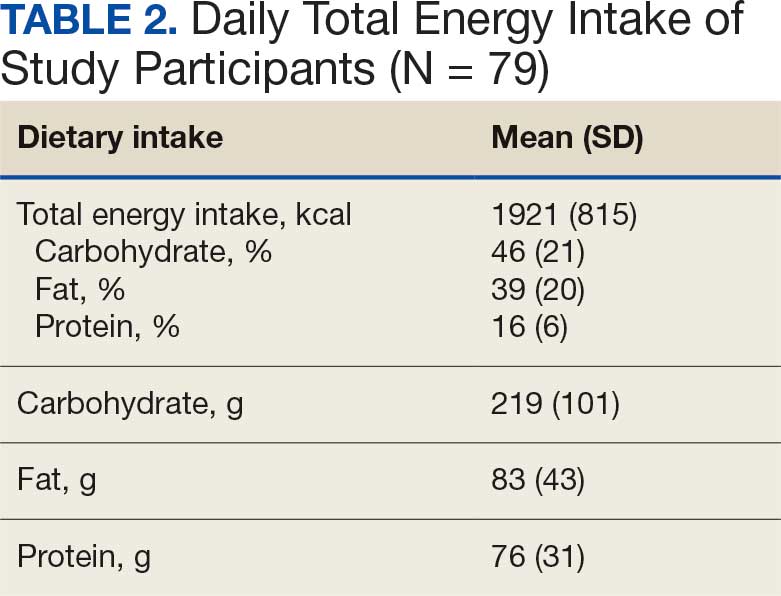
A mean (SD) of 36 (12) food items were analyzed from the 3-day food records. The majority of food items were UPFs (56%), 33% were MPFs, 8% were PRFs, and 3% were CPFs. In total, 75% of TEI came from UPFs (P < .001); only 14% of TEI came from minimally processed foods (Figure).
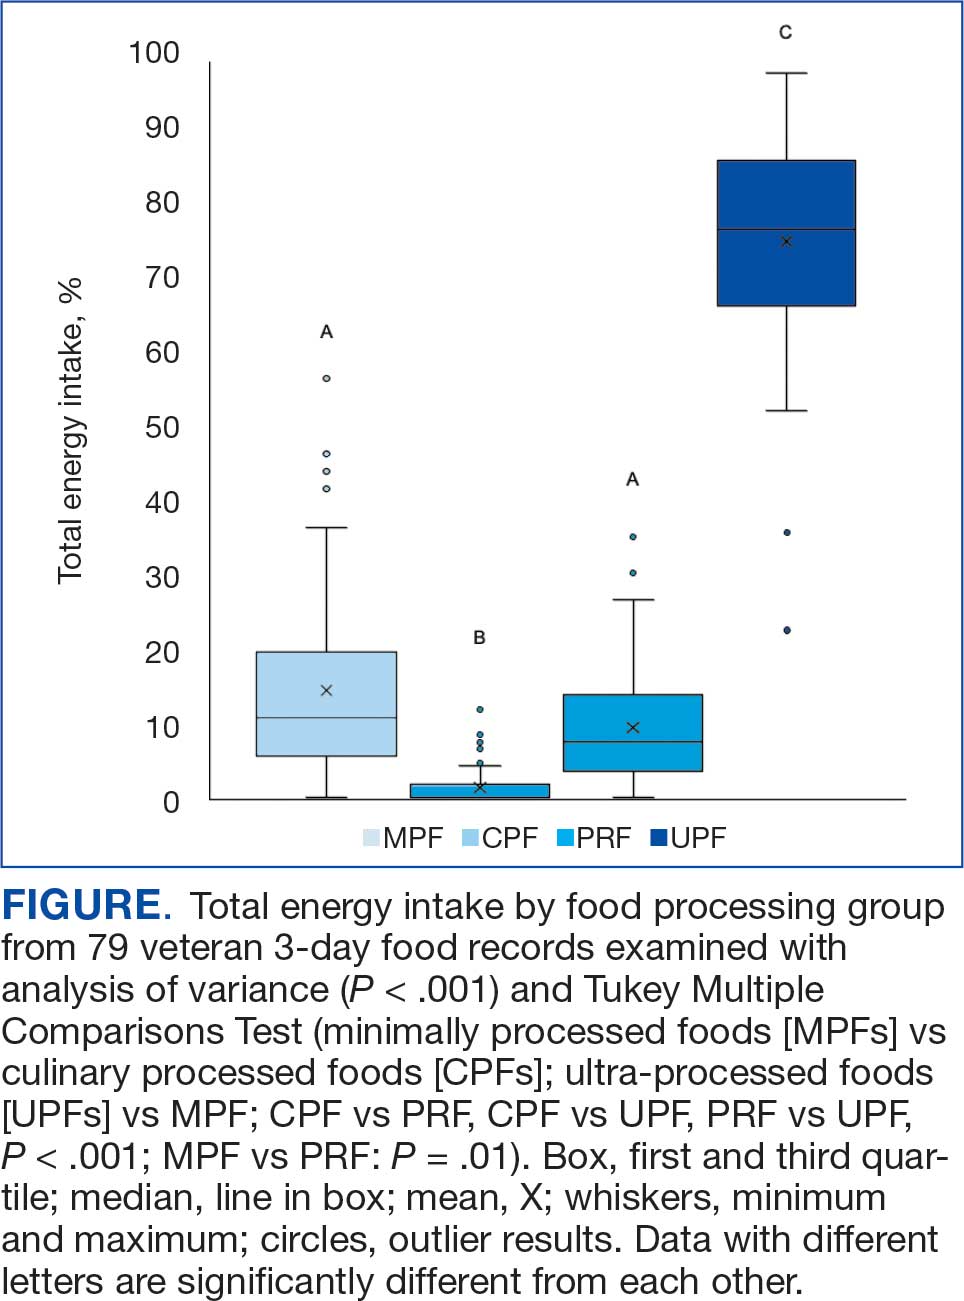
Discussion
To our knowledge, this is the first analysis of UPF consumption among US veterans. TEIs coming from UPFs appear to be about 20% higher among veterans compared to nonveterans: 75% vs 55%.11 Coupled with high UPF consumption, MPFs (14%) and PRFs (9%) represent smaller sources of TEI among surveyed veterans. Top caloric sources of UPFs in the US include sandwiches (including burgers), sweet bakery products, savory snacks, pizza, sweetened beverages, and breads, rolls, and tortillas, and likely reflect the major sources of UPFs in the veteran diet.13 As the statistical comparison between the veteran data and nonveteran data is not feasible in the present study, a future study with a much larger sample size would be needed for a direct comparison.
While the exact cause of higher UPF consumption among sampled veterans remains unknown and likely multifactorial (eg, cost, food insecurity, access, cooking skills, nutrition knowledge), veterans can receive a consult or self-refer to a registered dietitian nutritionist (RDN) for nutrition education. Counseling has been shown to be an effective way to improve diet quality and increase daily fruit and vegetable intake.14 High consumption of UPFs, which are generally energy-dense and nutrient-poor, contributes to the low diet quality observed in veterans, and future research examining the relationship between UPF intake and overall diet quality among veterans is warranted.2,15 As nutrition knowledge is associated with higher diet quality among veterans, increased use of nutrition services (ie, nutrition education or food supplement programs) has the potential to influence consumption of MPFs and decrease consumption of UPFs.16 Subsequently, UPF-targeted interventions developed by VA RDNs hold the promise to decrease consumption of UPFs and increase intake of MPFs and PRFs.
Veterans have a high prevalence of diabetes, hypertension, and obesity.9 The high UPF intake observed in this sample of veterans may increase the risk for these chronic diseases and overall mortality. The high percentage of TEI from UPFs among veterans is also of concern not only due to potential negative health outcomes, but also associated costs of treating veterans with multimorbidities.17 Targeting UPF intake via nutritional education may promote health and decrease the financial burden needed to support the health of veterans.
Improving veteran health and well-being, including enhancing health care accessibility in underserved areas, are pivotal objectives of the VA strategic plan for 2026 to 2030. Public policy aims to tackle food insecurity within the veteran population during the first 5 years of civilian life.18 In alignment with the White House Strategy on Hunger, Nutrition, and Health, VA established a Food Security Office (FSO) in 2023. The FSO mission is to use an interdisciplinary approach to provide resources to ensure veteran food security and create an environment where all veterans are food and nutrition secure.
Limitations
This study has several limitations. As the Food Processor software database does not include all brand items, similar brands were used to mirror the nutrient profile. While food records are common among veteran diet studies, accuracy may be reduced due to self-reporting bias.19 Different interpretation of the NOVA classification designation for various food items is possible, however, 89% of foods were coded the same by the research team which suggests high accuracy in food coding. Specific ingredient information was not collected from the 3-day food records; thus, these records were not produced in such a way to improve the accuracy of the NOVA classification designation. This study was limited by its small sample size (N = 79); although, this analysis is larger than other studies of UPF consumption in the US.20,21 In addition, the generalizability of this study is limited as this population sample was from a single VA hospital and may not reflect the overall veteran population. Participants in this study were recruited only from those receiving VA care, thus their diet quality may not represent the quality consumed by veterans not participating in VA services. Further research on UPF consumption among veterans is warranted with a larger, more representative study sample size.
Conclusions
As this is the highest observed UPF intake documented in the US, these results should be of concern for the VA and its RDNs. More research is needed to better understand why UPF consumption is so high among veterans, what barriers veterans face to decreasing UPF consumption, and what intervention(s) veterans would welcome to improve their diet quality. Presently, veterans are provided with access to a variety of effective nutrition education and counseling options and should be encouraged to use these services. VA RDNs should be aware of the high intake of UPFs in the veteran population and familiarize themselves with education and counseling strategies that promote behavior change to replace UPFs with more nutrient-dense foods choices.
- Rabbitt MP, Smith MD. Food insecurity among workingage veterans. US Dept of Agriculture, Economic Research Service; 2021. Accessed January 26, 2026. https://www.ers.usda.gov/publications/pub-details/?pubid=101268
- Dong D, Stewart H, Carlson AC. An examination of veterans’ diet quality. US Dept of Agriculture, Economic Research Service; 2019. Accessed January 26, 2026. https:// www.ers.usda.gov/publications/pub-details/?pubid=95608
- US Department of Veterans Affairs; US Department of Defense. VA/DoD clinical practice guideline for the management of adult overweight and obesity. 2020. Accessed January 26, 2026. https://www.healthquality.va.gov/guidelines/cd/obesity/
- US Department of Veterans Affairs; US Department of Defense. VA/DoD clinical practice guideline for the management of type 2 diabetes mellitus in primary care. 2023. Accessed January 26, 2026. https://www.healthquality.va.gov/guidelines/cd/diabetes/
- Boersma P, Cohen R, Zelaya C, et al. Multiple chronic conditions among veterans and nonveterans: United States, 2015–2018. Natl Health Stat Rep. 2021. doi:10.15620/cdc:101659
- Hoerster KD, Wilson S, Nelson KM, et al. Diet quality is associated with mental health, social support, and neighborhood factors among veterans. Eat Behav. 2016;23:168- 173. doi:10.1016/j.eatbeh.2016.10.003
- Becerra MB, Hassija CM, Becerra BJ. Food insecurity is associated with unhealthy dietary practices among US veterans in California. Public Health Nutr. 2017;20:2569-2576. doi:10.1017/S1368980016002147
- Monteiro CA, Cannon G, Levy RB, et al. Ultra-processed foods: what they are and how to identify them. Public Health Nutr. 2019;22:936-941. doi:10.1017/S1368980018003762
- Lane MM, Gamage E, Du S, et al. Ultra-processed food exposure and adverse health outcomes: umbrella review of epidemiological meta-analyses. BMJ. February 2024:e077310. doi:10.1136/bmj-2023-077310
- Powell LM, Jones K, Duran AC, et al. The price of ultra-processed foods and beverages and adult body weight: Evidence from U.S. veterans. Econ Hum Biol. 2019;34:39- 48. doi:10.1016/j.ehb.2019.05.006
- Marino M, Puppo F, Del Bo’ C, et al. A systematic review of worldwide consumption of ultra-processed foods: findings and criticisms. Nutrients. 2021;13. doi:10.3390/nu13082778
- Parrington D, Kurtz J, Fawcett J, et al. Pilot study on the effects of a whole-food, plant-strong diet on cardiovascular risk factors in veterans: part 3. Curr Dev Nutr. 2022;6:385. doi:10.1093/cdn/nzac054.040
- Williams AM, Couch CA, Emmerich SD, et al. Ultra-processed Food Consumption in Youth and Adults: United States, August 2021-August 2023. NCHS Data Brief. 2025. doi:10.15620/cdc/174612
- Serra MC, Addison O, Giffuni J, et al. Changes in self-reported fruit and vegetable intake following nutritional modification in high risk older veterans. J Nutr Gerontol Geriatr. 2021;40:1-8. doi:10.1080/21551197.2020.1863892
- Gupta S, Hawk T, Aggarwal A, et al. Characterizing ultra-processed foods by energy density, nutrient density, and cost. Front Nutr. 2019;6:1-9. doi:10.3389/fnut.2019.00070
- Robinson LA, Colin CR, Smith KS, et al. Diet quality is associated with nutrition knowledge and physical activity in the US military veterans enrolled in university programmes. BMJ Mil Heal. 2023:e002525. doi:10.1136/military-2023-002525
- Yoon J, Zulman D, Scott JY, et al. Costs associated with multimorbidity among VA patients. Med Care. 2014;52:S31-6. doi:10.1097/MLR.0000000000000061
- End Veteran Hunger Act of 2022, H.R. 8852, 117th Cong. (2022). Accessed January 26, 2026. https://www.congress.gov/bill/117th-congress/house-bill/8852.
- Collins RA, Baker B, Coyle DH, et al. Dietary assessment methods in military and veteran populations: a scoping review. Nutrients. 2020;12:1-21. doi:10.3390/nu12030769
- Smiljanec K, Mbakwe AU, Ramos-Gonzalez M, et al. Associations of ultra-processed and unprocessed/minimally processed food consumption with peripheral and central hemodynamics, and arterial stiffness in young healthy adults. Nutrients. 2020;12. doi:10.3390/nu12113229
- Rohatgi KW, Tinius RA, Cade WT, et al. Relationships between consumption of ultra-processed foods, gestational weight gain and neonatal outcomes in a sample of US pregnant women. PeerJ. 2017;5:e4091. doi:10.7717/peerj.4091
Roughly 8.6% of the 17.4 million US veterans live in poverty. About 11.1% are considered food insecure (ie, unable to acquire adequate food for ≥1 household members), with another 5.3% considered very food insecure (ie, eating patterns of ≥1 household members were disrupted and their food intake was reduced at least some time during the year). Compared with nonveterans, veterans are 7.4% more likely to be food insecure.1 This high prevalence of food insecurity and poverty has a negative impact on veteran diets.
Veterans’ diets contained more added sugars and solid fats and scored lower compared with nonveterans when assessed for diet quality with the Healthy Eating Index.2 Veterans have a higher prevalence of diet-related chronic disease, including diabetes, hypertension, and obesity compared with the nonveterans.3-5 Given the critical role of diet in health and disease risk, enhancing diet quality among veterans has garnered significant attention and calls to action.2,6,7 While there are many factors that contribute to diet, any veteran can receive a consultation or self-refer to receive nutrition counseling effective for improving diet quality, within the US Department of Veterans Affairs (VA).
The NOVA food classification system describes diet quality by categorizing food items by processing methods and ingredients into 4 food groups.8 The first is unprocessed and minimally processed items (MPFs) such as fresh fruits, vegetables, and meats. MPFs consist of whole foods which can also be minimally processed (eg, chopping, drying, grinding, heating, chilling). Culinary processed foods (CPFs) are processed foods for cooking (eg, salt, butter, and vinegar) and are typically eaten in small quantities along with MPFs. Processed foods (PRFs) include canned and smoked foods, while ultra-processed foods (UPFs) are distinguished by industrial ingredients, requiring specialized tools and processing techniques, and hyper-palatability related to color, flavor, and packaging.8 Examples of UPFs include mass-produced breads found at grocery stores, prepackaged snacks and meals, and hydrogenated oils. UPF consumption is associated with higher risk for negative cardiometabolic outcomes, common mental disorders, and all-cause mortality.9 To date, only a study by Powell et al has used the NOVA classification system in a veteran population, and it was limited to a comparison of the price of UPFs and veteran body mass index (BMI).10 Therefore, it remains unknown what percentage of total energy intake (TEI) comes from UPFs in the diets of veterans.
This study sought to quantify the proportion of TEI from UPFs among a sample of patients from the VA Phoenix Health Care System (VAPHCS). Results from a 2021 global meta-analysis reveal that the US and United Kingdom have the highest intakes of UPFs in the world.11 Specifically, within the US, 15 studies with 234,890 participants reveal that the majority of TEI (about 55%) comes from UPFs.11 We hypothesized that this veteran sample would have a higher proportion of TEI from UPFs, possibly due to a higher prevalence of poverty and food insecurity among veterans compared with nonveterans.1 If the percentage of TEI coming from UPF is higher or even similar to nonveterans, further efforts to increase veterans’ use of the available nutritional services would be warranted to minimize nutrition-related disease among veterans.
Methods
This is a cross-sectional, secondary data analysis of baseline 3-day food records collected from 2017 to 2020 from 92 patients recruited at VAPHCS to participate in a whole-food plant-based diet study.12 The original study was reviewed and approved by the VAPHCS Institutional Review Board (1593830). Recruitment methods included clinician recommendation, a recorded advertisement played while phone calls were on hold, and flyers distributed throughout VAPHCS. Patients were included if they were aged 18 to 90 years, had a BMI 25.1 to 39.9, had a diagnosis of nutrition-related chronic disease (hypertension, diabetes, or hyperlipidemia), an interest and desire to make a lifestyle change, active telephone contact information (either landline or cell phone), no contraindication to be on a whole-food plant-based diet, access to transportation and a functioning kitchen, ability to prepare meals independently, access to a computer or tablet with internet access, and a digital camera or smartphone. Exclusion criteria included significant unplanned weight loss within 6 months, uncontrolled insulin-dependent diabetes with a current hemoglobin A1c > 9%, pregnancy/lactation, taking prescribed weight loss medication, currently following a diet (eg, plant-based diet, vegan, or medical weight loss program diet), celiac disease diagnosed within 6 months, end-stage hepatic disease or renal disease requiring dialysis, active cancer or receiving chemotherapy or radiation therapy, active alcohol or substance use disorder, history of eating disorders, fasting triglyceride level > 350 mg/dL, any psychological issues that prevent adherence, inability to speak English, limited mobility, and homeless or in housing with limited kitchen access. A baseline 3-day food record was collected from the participants and used in this secondary analysis.
Diet Analysis
Food records were analyzed using Esha Research Food Processor 4.0 to identify calorie and macronutrient information. To limit bias, food items were coded independently by 2 researchers into 4 food processing groups determined by the NOVA classification: MPF, CPF, PRF, and UPF.8 When possible, specific ingredient information was collected using internet searches for brand product websites. Initial coding had an 89% agreement rate for food item coding between the 2 researchers. As coding was done in duplicate, a third researcher resolved disagreements. The number of food items for each processing group was determined and the mean (SD) percentage of TEI for each NOVA group was provided across participants. A 1-way analysis of variance and Tukey Multiple Comparisons Test were used to determine significance between groups with an α = .05 using Prism V9.
Results
Of the 92 participants in the original study, only 79 met inclusion criteria and had baseline diet data. The 79 veterans had a mean (SD) age of 61 (13) years and 59 (75%) were male (Table 1). Mean (SD) TEI was 1921 (815) kcal. The mean (SD) percentage of calories from carbohydrate, fat, and protein were 46% (21%), 39% (20%), and 16% (6%), respectively (Table 2).
A mean (SD) of 36 (12) food items were analyzed from the 3-day food records. The majority of food items were UPFs (56%), 33% were MPFs, 8% were PRFs, and 3% were CPFs. In total, 75% of TEI came from UPFs (P < .001); only 14% of TEI came from minimally processed foods (Figure).
Discussion
To our knowledge, this is the first analysis of UPF consumption among US veterans. TEIs coming from UPFs appear to be about 20% higher among veterans compared to nonveterans: 75% vs 55%.11 Coupled with high UPF consumption, MPFs (14%) and PRFs (9%) represent smaller sources of TEI among surveyed veterans. Top caloric sources of UPFs in the US include sandwiches (including burgers), sweet bakery products, savory snacks, pizza, sweetened beverages, and breads, rolls, and tortillas, and likely reflect the major sources of UPFs in the veteran diet.13 As the statistical comparison between the veteran data and nonveteran data is not feasible in the present study, a future study with a much larger sample size would be needed for a direct comparison.
While the exact cause of higher UPF consumption among sampled veterans remains unknown and likely multifactorial (eg, cost, food insecurity, access, cooking skills, nutrition knowledge), veterans can receive a consult or self-refer to a registered dietitian nutritionist (RDN) for nutrition education. Counseling has been shown to be an effective way to improve diet quality and increase daily fruit and vegetable intake.14 High consumption of UPFs, which are generally energy-dense and nutrient-poor, contributes to the low diet quality observed in veterans, and future research examining the relationship between UPF intake and overall diet quality among veterans is warranted.2,15 As nutrition knowledge is associated with higher diet quality among veterans, increased use of nutrition services (ie, nutrition education or food supplement programs) has the potential to influence consumption of MPFs and decrease consumption of UPFs.16 Subsequently, UPF-targeted interventions developed by VA RDNs hold the promise to decrease consumption of UPFs and increase intake of MPFs and PRFs.
Veterans have a high prevalence of diabetes, hypertension, and obesity.9 The high UPF intake observed in this sample of veterans may increase the risk for these chronic diseases and overall mortality. The high percentage of TEI from UPFs among veterans is also of concern not only due to potential negative health outcomes, but also associated costs of treating veterans with multimorbidities.17 Targeting UPF intake via nutritional education may promote health and decrease the financial burden needed to support the health of veterans.
Improving veteran health and well-being, including enhancing health care accessibility in underserved areas, are pivotal objectives of the VA strategic plan for 2026 to 2030. Public policy aims to tackle food insecurity within the veteran population during the first 5 years of civilian life.18 In alignment with the White House Strategy on Hunger, Nutrition, and Health, VA established a Food Security Office (FSO) in 2023. The FSO mission is to use an interdisciplinary approach to provide resources to ensure veteran food security and create an environment where all veterans are food and nutrition secure.
Limitations
This study has several limitations. As the Food Processor software database does not include all brand items, similar brands were used to mirror the nutrient profile. While food records are common among veteran diet studies, accuracy may be reduced due to self-reporting bias.19 Different interpretation of the NOVA classification designation for various food items is possible, however, 89% of foods were coded the same by the research team which suggests high accuracy in food coding. Specific ingredient information was not collected from the 3-day food records; thus, these records were not produced in such a way to improve the accuracy of the NOVA classification designation. This study was limited by its small sample size (N = 79); although, this analysis is larger than other studies of UPF consumption in the US.20,21 In addition, the generalizability of this study is limited as this population sample was from a single VA hospital and may not reflect the overall veteran population. Participants in this study were recruited only from those receiving VA care, thus their diet quality may not represent the quality consumed by veterans not participating in VA services. Further research on UPF consumption among veterans is warranted with a larger, more representative study sample size.
Conclusions
As this is the highest observed UPF intake documented in the US, these results should be of concern for the VA and its RDNs. More research is needed to better understand why UPF consumption is so high among veterans, what barriers veterans face to decreasing UPF consumption, and what intervention(s) veterans would welcome to improve their diet quality. Presently, veterans are provided with access to a variety of effective nutrition education and counseling options and should be encouraged to use these services. VA RDNs should be aware of the high intake of UPFs in the veteran population and familiarize themselves with education and counseling strategies that promote behavior change to replace UPFs with more nutrient-dense foods choices.
- Rabbitt MP, Smith MD. Food insecurity among workingage veterans. US Dept of Agriculture, Economic Research Service; 2021. Accessed January 26, 2026. https://www.ers.usda.gov/publications/pub-details/?pubid=101268
- Dong D, Stewart H, Carlson AC. An examination of veterans’ diet quality. US Dept of Agriculture, Economic Research Service; 2019. Accessed January 26, 2026. https:// www.ers.usda.gov/publications/pub-details/?pubid=95608
- US Department of Veterans Affairs; US Department of Defense. VA/DoD clinical practice guideline for the management of adult overweight and obesity. 2020. Accessed January 26, 2026. https://www.healthquality.va.gov/guidelines/cd/obesity/
- US Department of Veterans Affairs; US Department of Defense. VA/DoD clinical practice guideline for the management of type 2 diabetes mellitus in primary care. 2023. Accessed January 26, 2026. https://www.healthquality.va.gov/guidelines/cd/diabetes/
- Boersma P, Cohen R, Zelaya C, et al. Multiple chronic conditions among veterans and nonveterans: United States, 2015–2018. Natl Health Stat Rep. 2021. doi:10.15620/cdc:101659
- Hoerster KD, Wilson S, Nelson KM, et al. Diet quality is associated with mental health, social support, and neighborhood factors among veterans. Eat Behav. 2016;23:168- 173. doi:10.1016/j.eatbeh.2016.10.003
- Becerra MB, Hassija CM, Becerra BJ. Food insecurity is associated with unhealthy dietary practices among US veterans in California. Public Health Nutr. 2017;20:2569-2576. doi:10.1017/S1368980016002147
- Monteiro CA, Cannon G, Levy RB, et al. Ultra-processed foods: what they are and how to identify them. Public Health Nutr. 2019;22:936-941. doi:10.1017/S1368980018003762
- Lane MM, Gamage E, Du S, et al. Ultra-processed food exposure and adverse health outcomes: umbrella review of epidemiological meta-analyses. BMJ. February 2024:e077310. doi:10.1136/bmj-2023-077310
- Powell LM, Jones K, Duran AC, et al. The price of ultra-processed foods and beverages and adult body weight: Evidence from U.S. veterans. Econ Hum Biol. 2019;34:39- 48. doi:10.1016/j.ehb.2019.05.006
- Marino M, Puppo F, Del Bo’ C, et al. A systematic review of worldwide consumption of ultra-processed foods: findings and criticisms. Nutrients. 2021;13. doi:10.3390/nu13082778
- Parrington D, Kurtz J, Fawcett J, et al. Pilot study on the effects of a whole-food, plant-strong diet on cardiovascular risk factors in veterans: part 3. Curr Dev Nutr. 2022;6:385. doi:10.1093/cdn/nzac054.040
- Williams AM, Couch CA, Emmerich SD, et al. Ultra-processed Food Consumption in Youth and Adults: United States, August 2021-August 2023. NCHS Data Brief. 2025. doi:10.15620/cdc/174612
- Serra MC, Addison O, Giffuni J, et al. Changes in self-reported fruit and vegetable intake following nutritional modification in high risk older veterans. J Nutr Gerontol Geriatr. 2021;40:1-8. doi:10.1080/21551197.2020.1863892
- Gupta S, Hawk T, Aggarwal A, et al. Characterizing ultra-processed foods by energy density, nutrient density, and cost. Front Nutr. 2019;6:1-9. doi:10.3389/fnut.2019.00070
- Robinson LA, Colin CR, Smith KS, et al. Diet quality is associated with nutrition knowledge and physical activity in the US military veterans enrolled in university programmes. BMJ Mil Heal. 2023:e002525. doi:10.1136/military-2023-002525
- Yoon J, Zulman D, Scott JY, et al. Costs associated with multimorbidity among VA patients. Med Care. 2014;52:S31-6. doi:10.1097/MLR.0000000000000061
- End Veteran Hunger Act of 2022, H.R. 8852, 117th Cong. (2022). Accessed January 26, 2026. https://www.congress.gov/bill/117th-congress/house-bill/8852.
- Collins RA, Baker B, Coyle DH, et al. Dietary assessment methods in military and veteran populations: a scoping review. Nutrients. 2020;12:1-21. doi:10.3390/nu12030769
- Smiljanec K, Mbakwe AU, Ramos-Gonzalez M, et al. Associations of ultra-processed and unprocessed/minimally processed food consumption with peripheral and central hemodynamics, and arterial stiffness in young healthy adults. Nutrients. 2020;12. doi:10.3390/nu12113229
- Rohatgi KW, Tinius RA, Cade WT, et al. Relationships between consumption of ultra-processed foods, gestational weight gain and neonatal outcomes in a sample of US pregnant women. PeerJ. 2017;5:e4091. doi:10.7717/peerj.4091
Seventy-Five Percent of Total Energy Intake Comes From Ultra-Processed Foods Among a Sample of Veterans With Overweight and Obesity: An Exploratory Analysis of Three-Day Food Records
Seventy-Five Percent of Total Energy Intake Comes From Ultra-Processed Foods Among a Sample of Veterans With Overweight and Obesity: An Exploratory Analysis of Three-Day Food Records
A Guide to Avoiding Common Procedural Coding Mistakes
A Guide to Avoiding Common Procedural Coding Mistakes
Accurate procedural coding is essential to appropriate reimbursement and regulatory compliance in dermatology. This article reviews commonly misunderstood areas of procedural coding, including new biopsy codes; coding for shave removals, destruction, excision and repair, and adjacent tissue transfer (flap closure); the National Correct Coding Initiative; Medicare payment edits; Mohs micrographic surgery (MMS) codes; and correct use of key modifiers. Practical guidance is provided to help avoid frequent errors.
NEW BIOPSY CODES
The most common questions about procedural coding relate to the new Current Procedural Terminology (CPT) biopsy codes, which are reported based on method of removal. Primary codes include the following:
- 11102: tangential biopsy of skin (eg, shave, scoop, saucerize, curette) for a single lesion
- 11104: punch biopsy of skin, including simple closure, when performed, for a single lesion
- 11106: incisional biopsy of skin (eg, wedge), including simple closure, when performed, for a single lesion
Add-on codes are used for each separate or additional lesion:
- 11103: tangential biopsy
- 11105: punch biopsy
- 11107: incisional biopsy
When multiple biopsy types are performed on the same date of service, only one primary code is reported along with add-on codes for any additional biopsies. The primary code reported should have the highest relative value unit (generally incisional > punch > tangential) plus the add-on codes for additional biopsies performed. Sampling of the stratum corneum only (eg, skin scraping or tape stripping) does not constitute a skin biopsy and is not reportable as a procedure.
SHAVE REMOVAL CODES
Shave removal codes are appropriate when the intent is removal of the entire lesion and there is only dermis remaining at the base of the wound. Tangential biopsy codes are appropriate when the intent is to sample a portion of a lesion for diagnosis. If saucerization of a lesion is appropriate and only fat remains at the base of the wound, the procedure is correctly coded as an excision. If any dermis remains at the base of the wound, the procedure is properly coded as shave removal. Shave codes do not distinguish between benign and malignant lesions and do not include the margin of normal skin, only the diameter of the lesion itself.
DESTRUCTION CODES
Destruction codes include both premalignant and benign lesions and may be reported as add-on codes or standalone codes, depending on lesion type and number. The 17000 series is used for destruction of premalignant lesions such as actinic keratosis, large cell acanthoma, actinic cheilitis, and porokeratosis:
- 17000: destruction of the first premalignant lesion
- 17003: destruction of each additional premalignant lesion (up to 13 lesions); reported in addition to 17000
- 17004: destruction of 15 or more premalignant lesions; reported as a standalone code (not in addition to 17000)
The following codes are used for destruction of benign lesions:
- 17110: destruction of benign lesions (up to 14 lesions)
- 17111: destruction of 15 or more benign lesions; reported as a standalone code (not in addition to 17110)
EXCISION AND REPAIR CODES
Individual excisions are reported separately, while repairs are reported as the sum of the lengths within grouped anatomic zones. The groupings differ for intermediate and complex closures, so be sure to refer to your coding manual. Intermediate or complex closures should be reported separately for skin excisions, whereas simple closures are already included in the excision code and are not reported separately. Excision diameter includes the margins necessary to ensure complete removal of the tumor for both benign and malignant tumors. For neoplasms of uncertain behavior, defer billing until pathology results are available to ensure accurate reporting as either a benign or malignant tumor excision. Lesion size is measured prior to excision and includes the lesion plus the narrowest intended clinical margin; this measurement reflects the width of the excised specimen rather than the length of the repair.
Malignant tumor excisions continue to be worth more because of the greater risk and preservice and postservice work involved. Only about 50% of payment relates to the procedure itself; the other 50% relates to risk and preoperative and postoperative counseling as well as bundled follow-up visits in the global period. That accounts for the difference in compensation for benign vs malignant tumors as well as the 50% multiple surgical reduction for multiple lesions, as the equipment and cognitive portion bundled into the procedure are not separate for each procedure.
Historically, Medicare has bundled complex closures with benign excisions under 0.5 cm. Medicare also applies medically unlikely edits that may limit payment when more than 5 excisions, closures, or destruction procedures (excluding add-on codes) are reported on the same date of service. Medicare may pay for the additional procedures if a copy of the record and a letter of medical necessity are included.
CODING FOR ADJACENT TISSUE TRANSFER (FLAP CLOSURE)
When reporting adjacent tissue transfers, the total size of the defect includes primary and secondary defects when calculating the area of the flap. The areas of the primary and secondary defects are added together when the flap represents a single repair. The sums are reported separately if they are distinct repairs. Adjacent tissue transfer already includes payment for the excision of malignant or benign lesions. Do not code separately for the excision.
CORRECT CODING INITIATIVE
On January 1, 1996, the Medicare program implemented the National Correct Coding Initiative (https://www.cms.gov/national-correct-coding-initiative-ncci), employing nearly 83,000 code edits, in an attempt to eliminate unbundling or other inappropriate reporting of CPT codes. When procedures are performed on separate and distinct lesions, a modifier is required to bypass the edit that would otherwise deny payment for the second procedure. Medicare publishes lists of paired codes (column 1 paired with column 2). The code in column 2 is the one that requires modifier 59 or 79.
MEDICARE PAYMENT EDITS
Mutually Exclusive Edits
Mutually exclusive edits seek to identify services that cannot reasonably be performed in the same session. The “comprehensive” code will be paid and the “component” code disallowed.
Medically Unlikely Edits
The Centers for Medicare & Medicaid Services stop paying when multiples of a procedure exceed the medically unlikely edits, but payment may be made if accompanied by a copy of the medical record and letter of medical necessity. A common example would be a transplant recipient requiring destruction of many malignant lesions in a single session, exceeding the medically unlikely edits for the procedure.
MOHS MICROGRAPHIC SURGERY CODES
Mohs micrographic surgery codes require that a single physician act as both surgeon and pathologist. Do not report 88305 separately, as the pathology interpretation is already included in the MMS reimbursement. Repairs, grafts, and adjacent tissue transfer are separately reportable with the CPT codes for MMS.
The CPT codes for MMS include skin biopsy and excision services (11102-11107, 11600-11646, and 17260-17286); however, if a suspected skin cancer is biopsied for pathologic diagnosis prior to MMS, the biopsy (11102-11107) and frozen section pathology (88331) may be reported separately utilizing modifier 59 or 58 to distinguish the diagnostic biopsy from the definitive MMS. The biopsy should not duplicate a prior biopsy unless that biopsy result cannot be located; it must be performed before MMS and must determine the subsequent procedure. Although CPT indicates that modifier 59 should be used, it also is acceptable to utilize modifier 58 to indicate that the diagnostic skin biopsy and MMS were staged or planned procedures. This may be appropriate in the following scenarios:
- The lesion for which MMS is planned has not been biopsied within the previous 60 days,
- The surgeon cannot obtain a pathology report, with reasonable effort, from the referring physician, or
- The biopsy is performed on a lesion that is not associated with the MMS.
KEY MODIFIERS AND HOW THEY ARE USED
Modifiers are essential tools in dermatology coding that are used to indicate when procedures or evaluation and management (E/M) services are distinct, staged, bilateral, or related to specific global periods. Correct application ensures accurate reimbursement, prevents claim denials, and reflects the true work performed. The following list summarizes commonly used modifiers and guidance for their proper use.
Modifier 59: Distinct Procedural Service
Modifier 59 is used to clearly designate when distinct, independent, and separate multiple procedures are provided. The procedure must not be a component of another procedure. Examples include:
- Different procedures or surgeries
- Surgery on different sites or organ systems
- Separate incision/excision
- Separate lesions
When code 17000 is paired with the new biopsy codes, modifier 59 is paired with code 17000.
Modifier 79: Distinct Procedural Service During a Postoperative Period
Modifier 79 is used to clearly designate when distinct, independent, and separate multiple procedures are provided. The procedure must not be a component of another procedure. Examples include:
- Different procedures or surgeries
- Surgery on different sites or organ systems
- Separate incision/excision
- Separate lesions
Modifier 58: Staged or Planned Procedure
Modifier 58 is most commonly used when a staged excision is planned in advance or when a positive tumor margin requires further excision during a global period.
Modifier 25: Significant, Separately Identifiable E/M Service
Modifier 25 is defined as a significant and separately identifiable E/M service performed by the same physician on the same day as a procedure or other service. It is used to describe a separate, distinctly identifiable E/M service rendered during the same visit as another procedure. The modifier must be appended to the E/M code. The decision to perform a 0- or 10-day global procedure on the same date of service is already bundled into the payment for the procedure and does not qualify as a separate billable service.
Modifier 24: Unrelated E/M Service During a Postoperative Period
Modifier 24 is defined as an unrelated E/M service performed by the same physician during a postoperative period. It is used when a separate, unrelated E/M service is provided during the global period of a surgical procedure.
Modifiers 24 and 25: Documentation and Distinction
The CPT definition of modifier 25 states that an E/M service may be prompted by the system or condition for which a separate procedure or service is needed. Neither modifier requires a separate diagnosis; however, both require clearly distinguishable cognitive services beyond those typically associated with the procedure itself. This includes evaluation beyond the examination of the lesion, discussion of risks, benefits, and alternatives, and the decision to perform a 0- or 10-day global procedure.
Modifier 50: Bilateral Procedure
Modifier 50 is defined as a bilateral procedure and is used when the same procedure is performed on both sides of the body, such as application of Unna boots. When reporting this modifier, specify the quantity applied. Because Unna boots may be required on the arms as well as the legs, the billing system cannot determine how many were applied unless the quantity is clearly indicated.
Modifier 57: Decision for Surgery
Modifier 57 is reported when an E/M service involves the decision to perform a 90-day global procedure on the same date of service. For 10-day global procedures, the decision to perform surgery on the same day does not justify a separate E/M service. The global period timing begins at midnight, with the 10-day global starting on the day of the procedure and the 90-day global starting the day before the procedure; for example, if an excision is performed today and an adjacent tissue transfer is performed tomorrow, the excision is considered within the global period.
FINAL THOUGHTS
Physicians remain responsible for accurately selecting diagnosis and procedure codes that reflect medically necessary services, and CPT codes continue to define the procedures that are reported. The Relative Value Scale Update Committee determines the value of each procedure based on physician survey data, including time and follow-up visit utilization, as well as practice expense, which represents a substantial portion of each code’s value. Our specialty relies on dedicated volunteers who devote significant time and effort to ensuring accurate representation of the work we perform for our patients. When the opportunity arises, please thank them for their service.
A Guide to Avoiding Common Procedural Coding Mistakes
A Guide to Avoiding Common Procedural Coding Mistakes
PRACTICE POINTS
- When multiple biopsy types are performed on the same date of service, only one primary code is reported, along with add-on codes for any additional biopsies.
- When multiple biopsy types are performed on the same date of service, the primary code goes to incisional biopsy if one is performed or punch biopsy if there was no incisional biopsy.

Light-Brown Macule on the Upper Arm
Light-Brown Macule on the Upper Arm
THE DIAGNOSIS: Pigmented Bowen Disease
Histopathology revealed atypical keratinocytes throughout the entire thickness of a pigmented epidermis extending from the basal layer (Figure). Diffuse epidermal hyperpigmentation and melanophages in the papillary dermis were present. There was no dermal invasion or atypical melanocytic proliferation. On dermoscopy, this lesion had small brown globules, smudging, and an asymmetric nonspecific homogeneous pattern. Based on these features as well as the clinical findings, a diagnosis of pigmented Bowen disease (PBD), a rare subtype of squamous cell carcinoma in situ, was made. Complete removal of the lesion was achieved via the biopsy, and the patient was counselled regarding the malignant but noninvasive nature of the lesion. Appropriate follow-up was recommended to monitor for recurrence.
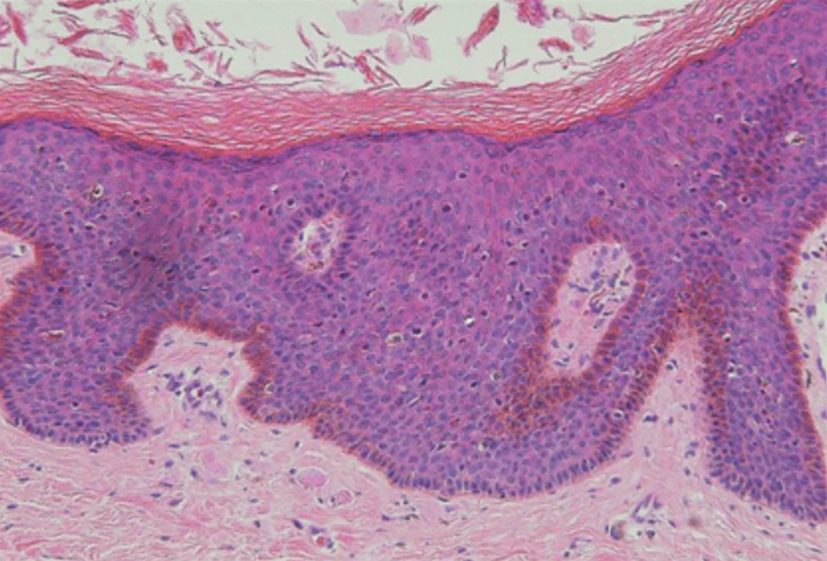
Our case presentation of PBD on the right upper arm in a female patient with a light skin tone is not classic, as PBD lesions usually manifest as well-demarcated scaly plaques on sun-protected sites in men with darker skin tones who are in the sixth to seventh decades of life.1
Dermoscopy of PBD in patients with lighter skin tones can present diagnostic challenges because characteristic clustered glomerular vessels may be faint or absent, particularly in small lesions such as this one. In such cases, PBD may instead demonstrate structureless brown pigmentation and irregular globules, patterns that overlap with pigmented actinic keratosis (PAK) and melanoma.3
Our case underscores the importance of maintaining a broad differential when evaluating small pigmented macules and reinforces biopsy as the diagnostic gold standard for PBD when dermoscopic findings are nonspecific.
- Mota AN, Piñeiro-Maceira J, Alves Mde F, et al. Pigmented Bowen’s disease. An Bras Dermatol. 2014;89:825-827. doi:10.1590 /abd1806-4841.20142725
- Lee JW, Hur J, Yeo KY, et al. A case of pigmented Bowen’s disease. Ann Dermatol. 2009;21:197-199. doi:10.5021/ad.2009.21.2.197
- Markowitz O. A Practical Guide to Dermoscopy. Philadelphia, PA: Wolters Kluwer; 2017.
- Fernández-Figueras MT, Carrato C, Sáenz X, et al. Actinic keratosis with atypical basal cells (AK I) is the most common lesion associated with invasive squamous cell carcinoma of the skin. J Eur Acad Dermatol Venereol. 2015;29:991-997. doi:10.1111/jdv.12848
THE DIAGNOSIS: Pigmented Bowen Disease
Histopathology revealed atypical keratinocytes throughout the entire thickness of a pigmented epidermis extending from the basal layer (Figure). Diffuse epidermal hyperpigmentation and melanophages in the papillary dermis were present. There was no dermal invasion or atypical melanocytic proliferation. On dermoscopy, this lesion had small brown globules, smudging, and an asymmetric nonspecific homogeneous pattern. Based on these features as well as the clinical findings, a diagnosis of pigmented Bowen disease (PBD), a rare subtype of squamous cell carcinoma in situ, was made. Complete removal of the lesion was achieved via the biopsy, and the patient was counselled regarding the malignant but noninvasive nature of the lesion. Appropriate follow-up was recommended to monitor for recurrence.
Our case presentation of PBD on the right upper arm in a female patient with a light skin tone is not classic, as PBD lesions usually manifest as well-demarcated scaly plaques on sun-protected sites in men with darker skin tones who are in the sixth to seventh decades of life.1
Dermoscopy of PBD in patients with lighter skin tones can present diagnostic challenges because characteristic clustered glomerular vessels may be faint or absent, particularly in small lesions such as this one. In such cases, PBD may instead demonstrate structureless brown pigmentation and irregular globules, patterns that overlap with pigmented actinic keratosis (PAK) and melanoma.3
Our case underscores the importance of maintaining a broad differential when evaluating small pigmented macules and reinforces biopsy as the diagnostic gold standard for PBD when dermoscopic findings are nonspecific.
- Mota AN, Piñeiro-Maceira J, Alves Mde F, et al. Pigmented Bowen’s disease. An Bras Dermatol. 2014;89:825-827. doi:10.1590 /abd1806-4841.20142725
- Lee JW, Hur J, Yeo KY, et al. A case of pigmented Bowen’s disease. Ann Dermatol. 2009;21:197-199. doi:10.5021/ad.2009.21.2.197
- Markowitz O. A Practical Guide to Dermoscopy. Philadelphia, PA: Wolters Kluwer; 2017.
- Fernández-Figueras MT, Carrato C, Sáenz X, et al. Actinic keratosis with atypical basal cells (AK I) is the most common lesion associated with invasive squamous cell carcinoma of the skin. J Eur Acad Dermatol Venereol. 2015;29:991-997. doi:10.1111/jdv.12848
Light-Brown Macule on the Upper Arm
Light-Brown Macule on the Upper Arm
An otherwise healthy 61-year-old woman with a light skin tone presented to the dermatology clinic for evaluation of a pigmented lesion on the right anterior distal upper arm of approximately 6 months’ duration. The patient reported no personal history of nonmelanoma skin cancer, atypical nevi, or melanoma but noted she had a family history of melanoma. Physical examination revealed an asymptomatic light-brown macule on the right anterior distal upper arm measuring about 3 mm with notable border irregularity and delineation. Dermoscopy findings showed a darker brown area at the lateral edge adjacent to the larger, amorphous, lighter-brown area with irregular brown globules present throughout the lesion. A biopsy of the lesion was performed.
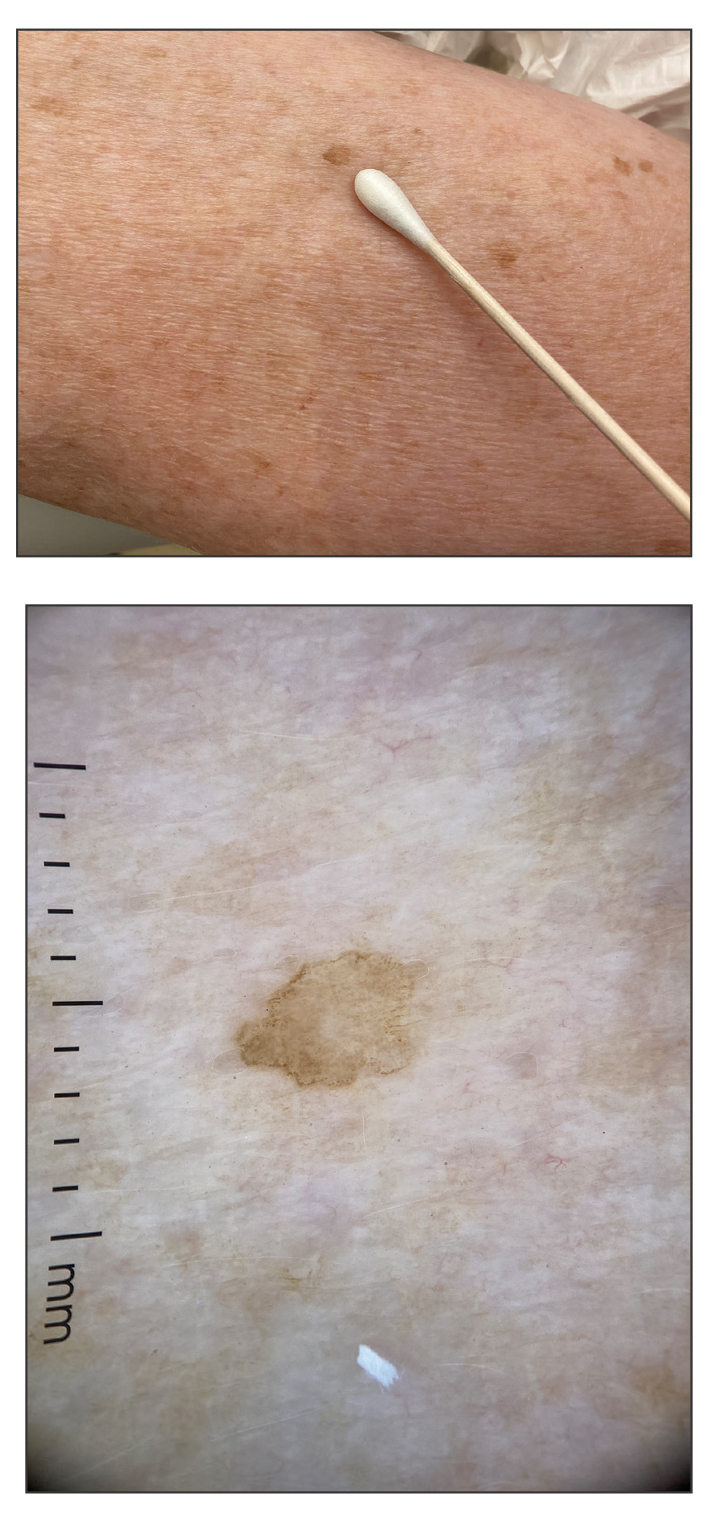

Malignancy Risk Among Psoriasis Patients Treated With Interleukin Inhibitors: A Retrospective Matched-Cohort Study
Malignancy Risk Among Psoriasis Patients Treated With Interleukin Inhibitors: A Retrospective Matched-Cohort Study
To the Editor:
Psoriasis is a chronic immune-mediated inflammatory skin disease that affects approximately 2% to 3% of the global population and an estimated 7.5 million adults in the United States.1 The condition is characterized by recurrent episodes of erythematous scaly plaques driven by dysregulated immune responses, particularly involving the interleukin (IL) 23/T-helper (Th) 17 axis.2 Although cutaneous symptoms are the most visible manifestation, psoriasis is a systemic disorder with broad multisystem involvement. Comorbidities include psoriatic arthritis, metabolic syndrome, cardiovascular disease, inflammatory bowel disease, depression, and anxiety.1 These conditions contribute to a heightened risk for premature mortality, increased health care utilization, and an estimated direct cost burden exceeding $11 billion annually in the United States alone.3 Patients with moderate to severe disease frequently require systemic therapy, and long-term disease control is essential to prevent cumulative inflammatory damage and reduce associated morbidity.4
Globally, psoriasis prevalence and disease severity vary by geography, ethnicity, and environmental factors, with higher rates in Northern Europe and North America and lower reported prevalence in East Asia and sub-Saharan Africa.5 In lower-resource settings, access to advanced therapies is limited, and patients often are treated with less effective or more toxic systemic agents, such as methotrexate or cyclosporine.5 These disparities not only affect quality of life but also may influence comorbidity and malignancy patterns, underscoring the importance of studying biologic safety in diverse real-world populations.
Over the past decade, the therapeutic landscape for psoriasis has been transformed by biologic agents targeting specific immune pathways.6 Interleukin 17 inhibitors (eg, secukinumab, ixekizumab, brodalumab, bimekizumab) act by neutralizing IL-17A, IL-17F, or the IL-17 receptor, thereby reducing keratinocyte activation, neutrophil recruitment, and downstream cytokine production.6 Interleukin 23 inhibitors (eg, guselkumab, risankizumab, tildrakizumab) block the p19 subunit of IL-23, halting the expansion and maintenance of pathogenic Th17 cells.6 Ustekinumab, an IL-12/23 inhibitor, targets the shared p40 subunit of IL-12 and IL-23, attenuating both Th1 and Th17 signaling.6 These agents achieve rapid, durable skin clearance in a large proportion of patients, improve psoriatic arthritis symptoms, and generally are well tolerated, even with long-term use.6
Although efficacy is well established, the immunomodulatory nature of IL inhibitors raises theoretical concerns about malignancy risk. Immune surveillance plays a critical role in detecting and eliminating emerging tumor cells.7 Data from other systemic immunosuppressants, such as cyclosporine, show increased risks for certain cancers8; however, the IL-17 and IL-23 pathways have dual roles in cancer biology.7 In some tumor contexts, these cytokines promote carcinogenesis through angiogenesis, epithelial proliferation, and suppression of antitumor immunity; therefore, inhibiting these pathways could theoretically reduce cancer risk.7 The uncertainty around this risk-benefit balance has made malignancy a central consideration for dermatologists, particularly when initiating therapy in patients with a history of cancer or other risk factors.
The perception of malignancy risk can influence patient willingness to start biologics as well as physician prescribing patterns.9 Some clinicians opt for alternative therapies in individuals with a personal or family history of cancer despite limited direct evidence of harm from IL inhibitors. Conversely, a reassuring malignancy safety profile may support broader adoption of these therapies, especially in patients requiring lifelong disease control.9 Shared decision-making in this context requires robust, real-world evidence that accounts for both common and rare malignancy outcomes.
Randomized controlled trials of IL inhibitors have not demonstrated a consistent malignancy signal, but these studies often are underpowered for rare outcomes and limited by short follow-up durations, typically less than 1 year. They also frequently exclude high-risk populations, limiting generalizability.10 Observational studies using real-world data can address these gaps by including more diverse patient populations, longer observation windows, and larger sample sizes capable of detecting differences in uncommon outcomes.
The TriNetX Analytics Network (http://www.trinetx.com) offers a unique platform for large-scale, real-world pharmacoepidemiologic research. This federated database aggregates deidentified electronic health record data from more than 100 million patients across the United States and internationally, including at academic medical centers, integrated delivery networks, and community hospitals.4 Data contributors refresh their datasets regularly, ensuring near-contemporary representation of prescribing trends and clinical outcomes. Standardized terminology mapping, consistent International Classification of Diseases, Tenth Revision, Clinical Modification (ICD-10-CM) coding, and centralized data-quality checks enhance the reliability of analyses. Governance protocols and compliance with the Health Insurance Portability and Accountability Act deidentification standards further ensure ethical use of the data. The breadth and depth of the TriNetX network make it possible to evaluate not only common malignancies but also rare cancer types that smaller studies cannot assess with sufficient statistical power.
We performed a retrospective matched-cohort study, querying data from January 1, 2014, through December 31, 2024, using TriNetX to examine whether IL inhibitor exposure is associated with differences in incident malignancy risk among adults with psoriasis. Patients aged 18 years or older with a psoriasis diagnosis (ICD-10-CM code L40.x) and documented exposure to an IL-17, IL-23, or IL-12/23 inhibitor were eligible. Patients with a prior malignancy diagnosis were excluded to reduce prevalence bias. To ensure that malignancies were incident, we included only those diagnosed at least 1 day after initiation of an IL inhibitor.
The comparison cohort consisted of psoriasis patients without IL inhibitor exposure during their observation period. We used 1:1 propensity score matching based on age, sex, race, and ethnicity, applying a caliper of 0.1 to balance baseline characteristics and minimize demographic confounding. The index date for unexposed patients was randomly assigned within their observation period to align follow-up timing with exposed patients. Outcomes were identified by ICD-10-CM codes grouped by skin, hematologic, and solid-organ malignancies. Odds ratios (ORs) with 95% confidence intervals (CIs) were calculated, with statistical significance set at P<.05. Odds ratios were selected over hazard ratios due to variability in precise follow-up time capture and the primary analytic goal of comparing proportional odds within matched follow-up windows.
Propensity score matching was employed because it is a well-established technique in pharmacoepidemiology to mimic some of the balance achieved in randomized trials. By equating treatment and control groups on measured confounders, matching helps isolate the treatment effect, particularly important in nonrandomized datasets in which prescribing decisions may be influenced by baseline characteristics. Grouping cancers into clinically relevant categories allowed us to assess patterns of association, as some cancer types (eg, melanoma, lymphomas) may have pathophysiologic links to inflammatory pathways targeted by IL inhibitors.
The final cohort included 133,352 patients, with 66,676 in each group. The mean (SD) age was 49.3 (16.0) years, and demographic variables were well balanced after matching. The mean follow-up was approximately 3.8 years. Interleukin 17 inhibitors were the most frequently prescribed, followed by IL-23 inhibitors and ustekinumab. Baseline comorbidities such as cardiovascular disease, diabetes, and obesity were comparable between groups, reducing the likelihood of confounding from these factors.
Interleukin inhibitor exposure was associated with significantly reduced odds of several malignancies (eTable). Among skin cancers, melanoma risk was reduced by 36% (OR, 0.641; 95% CI, 0.534-0.77; P<.0001), basal cell carcinoma by 43% (OR, 0.565; 95% CI, 0.48-0.665; P<.0001), and squamous cell carcinoma by 18% (OR, 0.821; 95% CI, 0.676-0.996; P=.0452). Hematologic malignancies showed similar reductions, with non-Hodgkin lymphoma odds reduced by 35% (OR, 0.646; 95% CI, 0.512-0.815; P=.0002) and Hodgkin lymphoma by 50% (OR, 0.5; 95% CI, 0.292-0.855; P=.0098).
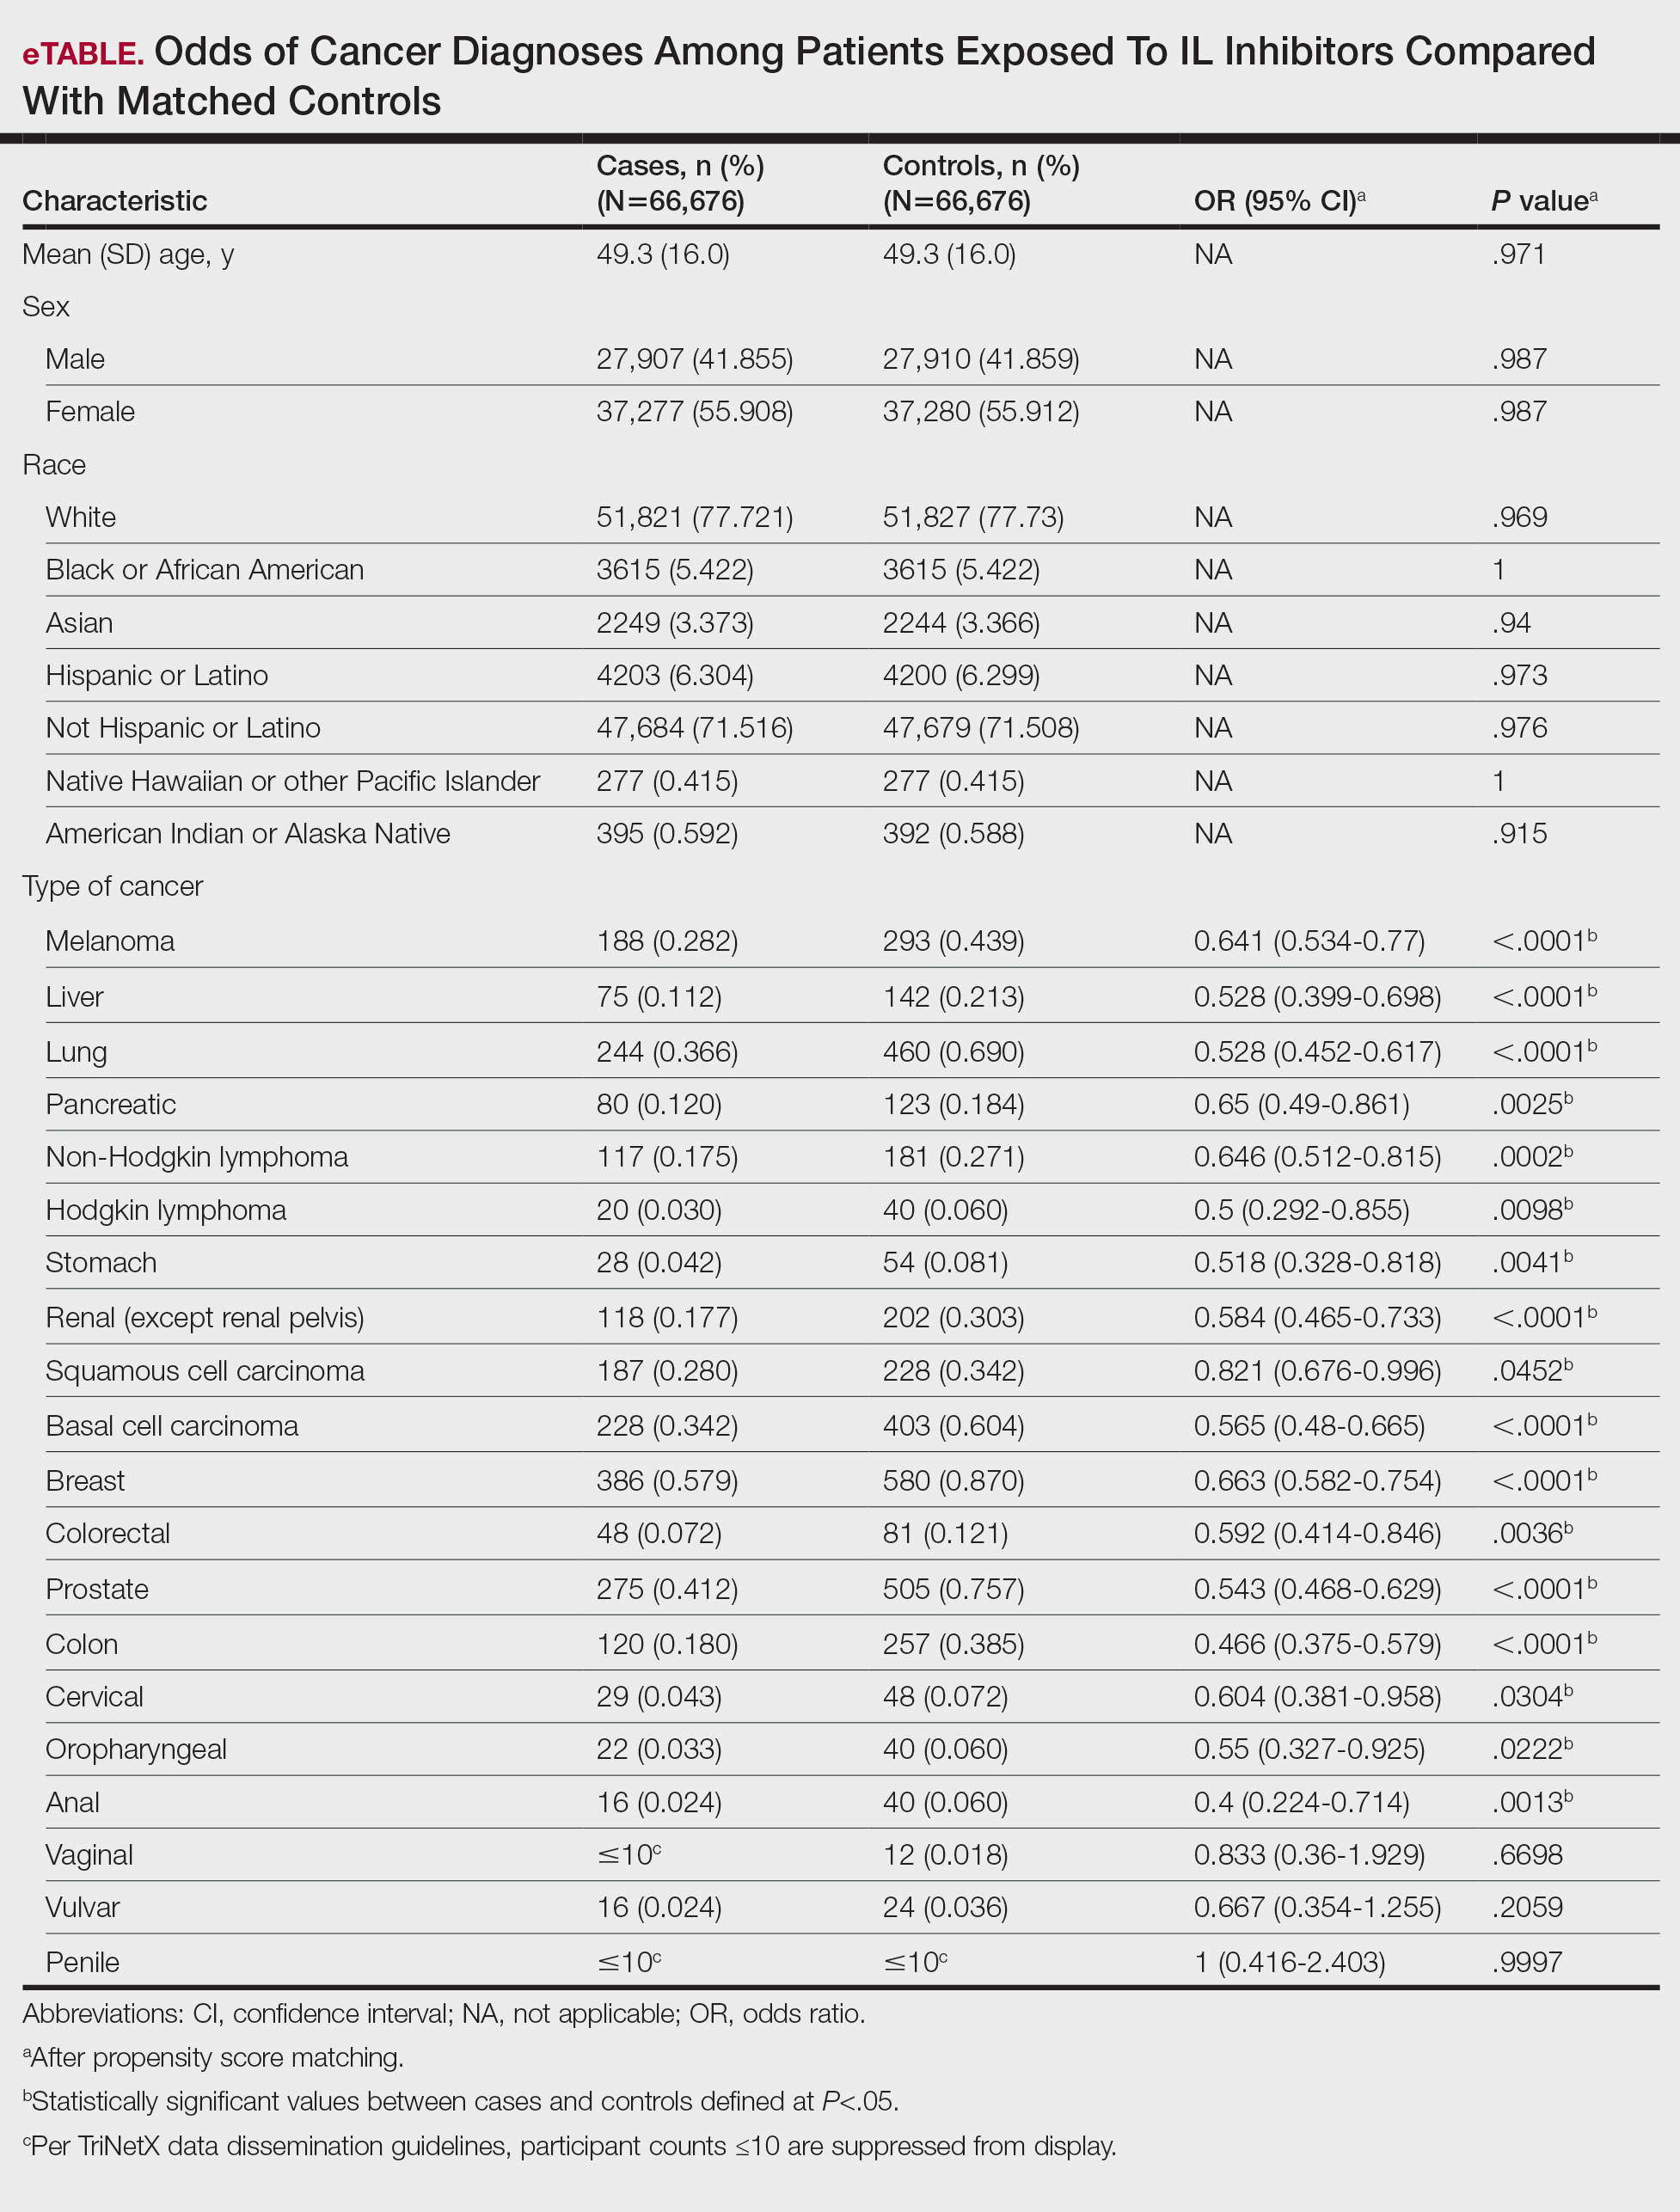
Protective associations also were observed for several solid tumors: lung (OR, 0.528; 95% CI, 0.452-0.617; P<.0001), liver (OR, 0.528; 95% CI, 0.399-0.698; P<.0001), pancreatic (OR, 0.65; 95% CI, 0.49-0.861; P=.0025), breast (OR, 0.663; 95% CI, 0.582-0.754; P<.0001), prostate (OR, 0.543; 95% CI, 0.468-0.629; P<.0001), colorectal (OR, 0.592; 95% CI, 0.414-0.846; P=.0036), colon (OR, 0.466; 95% CI, 0.375-0.579; P<.0001), and oropharyngeal (OR, 0.55; 95% CI, 0.327-0.925; P=.0222) cancers. Cervical cancer (OR, 0.604; 95% CI, 0.381-0.958; P=.0304) and anal cancer (OR, 0.4; 95% CI, 0.224-0.714; P=.0013) also showed significant reductions. Vaginal, vulvar, and penile cancers demonstrated no significant differences, likely due to their low incidence and limited statistical power.
The biological plausibility of these findings is supported by preclinical studies implicating IL-17 and IL-23 in tumor-promoting inflammation.11 These cytokines can recruit myeloid-derived suppressor cells, promote angiogenesis, and facilitate tumor-immune evasion. Inhibition may shift the immune microenvironment toward enhanced tumor surveillance, reduce protumorigenic cytokine signaling, and normalize regulatory T-cell function.11 These mechanisms could explain observed reductions in melanoma, lymphomas, and certain solid tumors.
Our results are consistent with several large registry studies showing no increased cancer incidence in IL inhibitor users and extend prior findings by demonstrating significant reductions in multiple cancer types.12 The melanoma reduction contrasts with the findings in earlier biologic safety studies, possibly due to our larger sample size, broader geographic representation, and inclusion of multiple IL inhibitor classes.13 Similar reductions have not been consistently observed with tumor necrosis factor α inhibitors, which have different immunologic targets and a more complex malignancy safety history.14
Limitations of our study include the retrospective design, potential misclassification of cancer diagnoses, and lack of data on unmeasured confounders such as sun exposure, smoking, alcohol use, and family cancer history. Surveillance bias is possible, though it would likely bias toward higher, not lower, cancer detection in biologic users. Our mean follow-up period of 3.8 years may not be sufficient for cancers with long latency periods.
If replicated, our findings could have meaningful public health implications. Reassurance regarding malignancy safety may increase patient acceptance and physician confidence in prescribing IL inhibitors, particularly for patients requiring long-term therapy. From a payer perspective, the potential for reduced cancer incidence could translate into substantial cost savings over time, offsetting the high up-front cost of biologics. Additionally, these results may be relevant to other IL inhibitor indications, including psoriatic arthritis, ankylosing spondylitis, and inflammatory bowel disease, in which similar pathophysiologic mechanisms may be at play.
In conclusion, this large matched-cohort study found that IL inhibitor therapy in psoriasis was associated with significantly reduced odds of multiple malignancies, including melanoma, lymphomas, and several solid tumors. These findings contribute to the growing body of real-world evidence supporting the long-term safety of IL inhibitors and underscore the need for continued pharmacovigilance and mechanistic research.
- Armstrong AW, Mehta MD, Schupp CW, et al. Psoriasis prevalence in adults in the United States. JAMA Dermatol. 2021;157:940-946. doi:10.1001/jamadermatol.2021.2007
- Deng Z, Wang S, Wu C, et al. IL-17 inhibitor-associated inflammatory bowel disease: a study based on literature and database analysis. Front Pharmacol. 2023;14:1124628. doi:10.3389/fphar.2023.1124628
- Al Sawah S, Foster SA, Goldblum OM, et al. Healthcare costs in psoriasis and psoriasis sub-groups over time following psoriasis diagnosis. J Med Econ. 2017;20:982-990. doi:10.1080/13696998.2017.1345749
- Korman NJ. Management of psoriasis as a systemic disease: what is the evidence? Br J Dermatol. 2020;182:840-848. doi:10.1111/bjd.18245
- Damiani G, Bragazzi NL, Karimkhani Aksut C, et al. The global, regional, and national burden of psoriasis: results and insights from the Global Burden of Disease 2019 Study. Front Med (Lausanne). 2021;8:743180. doi:10.3389/fmed.2021.743180
- Metko D, Torres T, Vender R. Viewpoint about biologic agents for psoriasis: are they immunosuppressants or immunomodulators? J Int Med Res. 2023;51:3000605231175547. doi:10.1177/03000605231175547
- Tsai YC, Tsai TF. Anti-interleukin and interleukin therapies for psoriasis: current evidence and clinical usefulness. Ther Adv Musculoskelet Dis. 2017;9:277-294. doi:10.1177/1759720X17735756
- Durnian JM, Stewart RM, Tatham R, et al. Cyclosporin-A associated malignancy. Clin Ophthalmol. 2007;1:421-430.
- DeWitt EM, Lin L, Glick HA, et al. Pattern and predictors of the initiation of biologic agents for the treatment of rheumatoid arthritis in the United States: an analysis using a large observational data bank. Clin Ther. 2009;31:1871-1858. doi:10.1016/j.clinthera.2009.08.020
- Vangilbergen M, Stockman A, Van De Velde A, et al. The role of interleukin-17 and interleukin-23 inhibitors in the development, progression, and recurrence of cancer: a systematic review. JAAD Int. 2024;17:71-79. doi:10.1016/j.jdin.2024.06.006
- Navarro-Compán V, Puig L, Vidal S, et al. The paradigm of IL-23-independent production of IL-17F and IL-17A and their role in chronic inflammatory diseases. Front Immunol. 2023;14:1191782. doi:10.3389/fimmu.2023.1191782
- Bencardino S, Bernardi F, Allocca M, et al. Advanced therapies for inflammatory bowel disease and risk of skin cancer: what’s new? Cancers (Basel). 2025;17:1710. doi:10.3390/cancers17101710
- Esse S, Mason KJ, Green AC, et al. Melanoma risk in patients treated with biologic therapy for common inflammatory diseases: a systematic review and meta-analysis. JAMA Dermatol. 2020;156:787-794. doi:10.1001/jamadermatol.2020.1300
- Solomon DH, Mercer E, Kavanaugh A. Observational studies on the risk of cancer associated with tumor necrosis factor inhibitors in rheumatoid arthritis: a review of their methodologies and results. Arthritis Rheum. 2012;64:21-32. doi:10.1002/art.30653
To the Editor:
Psoriasis is a chronic immune-mediated inflammatory skin disease that affects approximately 2% to 3% of the global population and an estimated 7.5 million adults in the United States.1 The condition is characterized by recurrent episodes of erythematous scaly plaques driven by dysregulated immune responses, particularly involving the interleukin (IL) 23/T-helper (Th) 17 axis.2 Although cutaneous symptoms are the most visible manifestation, psoriasis is a systemic disorder with broad multisystem involvement. Comorbidities include psoriatic arthritis, metabolic syndrome, cardiovascular disease, inflammatory bowel disease, depression, and anxiety.1 These conditions contribute to a heightened risk for premature mortality, increased health care utilization, and an estimated direct cost burden exceeding $11 billion annually in the United States alone.3 Patients with moderate to severe disease frequently require systemic therapy, and long-term disease control is essential to prevent cumulative inflammatory damage and reduce associated morbidity.4
Globally, psoriasis prevalence and disease severity vary by geography, ethnicity, and environmental factors, with higher rates in Northern Europe and North America and lower reported prevalence in East Asia and sub-Saharan Africa.5 In lower-resource settings, access to advanced therapies is limited, and patients often are treated with less effective or more toxic systemic agents, such as methotrexate or cyclosporine.5 These disparities not only affect quality of life but also may influence comorbidity and malignancy patterns, underscoring the importance of studying biologic safety in diverse real-world populations.
Over the past decade, the therapeutic landscape for psoriasis has been transformed by biologic agents targeting specific immune pathways.6 Interleukin 17 inhibitors (eg, secukinumab, ixekizumab, brodalumab, bimekizumab) act by neutralizing IL-17A, IL-17F, or the IL-17 receptor, thereby reducing keratinocyte activation, neutrophil recruitment, and downstream cytokine production.6 Interleukin 23 inhibitors (eg, guselkumab, risankizumab, tildrakizumab) block the p19 subunit of IL-23, halting the expansion and maintenance of pathogenic Th17 cells.6 Ustekinumab, an IL-12/23 inhibitor, targets the shared p40 subunit of IL-12 and IL-23, attenuating both Th1 and Th17 signaling.6 These agents achieve rapid, durable skin clearance in a large proportion of patients, improve psoriatic arthritis symptoms, and generally are well tolerated, even with long-term use.6
Although efficacy is well established, the immunomodulatory nature of IL inhibitors raises theoretical concerns about malignancy risk. Immune surveillance plays a critical role in detecting and eliminating emerging tumor cells.7 Data from other systemic immunosuppressants, such as cyclosporine, show increased risks for certain cancers8; however, the IL-17 and IL-23 pathways have dual roles in cancer biology.7 In some tumor contexts, these cytokines promote carcinogenesis through angiogenesis, epithelial proliferation, and suppression of antitumor immunity; therefore, inhibiting these pathways could theoretically reduce cancer risk.7 The uncertainty around this risk-benefit balance has made malignancy a central consideration for dermatologists, particularly when initiating therapy in patients with a history of cancer or other risk factors.
The perception of malignancy risk can influence patient willingness to start biologics as well as physician prescribing patterns.9 Some clinicians opt for alternative therapies in individuals with a personal or family history of cancer despite limited direct evidence of harm from IL inhibitors. Conversely, a reassuring malignancy safety profile may support broader adoption of these therapies, especially in patients requiring lifelong disease control.9 Shared decision-making in this context requires robust, real-world evidence that accounts for both common and rare malignancy outcomes.
Randomized controlled trials of IL inhibitors have not demonstrated a consistent malignancy signal, but these studies often are underpowered for rare outcomes and limited by short follow-up durations, typically less than 1 year. They also frequently exclude high-risk populations, limiting generalizability.10 Observational studies using real-world data can address these gaps by including more diverse patient populations, longer observation windows, and larger sample sizes capable of detecting differences in uncommon outcomes.
The TriNetX Analytics Network (http://www.trinetx.com) offers a unique platform for large-scale, real-world pharmacoepidemiologic research. This federated database aggregates deidentified electronic health record data from more than 100 million patients across the United States and internationally, including at academic medical centers, integrated delivery networks, and community hospitals.4 Data contributors refresh their datasets regularly, ensuring near-contemporary representation of prescribing trends and clinical outcomes. Standardized terminology mapping, consistent International Classification of Diseases, Tenth Revision, Clinical Modification (ICD-10-CM) coding, and centralized data-quality checks enhance the reliability of analyses. Governance protocols and compliance with the Health Insurance Portability and Accountability Act deidentification standards further ensure ethical use of the data. The breadth and depth of the TriNetX network make it possible to evaluate not only common malignancies but also rare cancer types that smaller studies cannot assess with sufficient statistical power.
We performed a retrospective matched-cohort study, querying data from January 1, 2014, through December 31, 2024, using TriNetX to examine whether IL inhibitor exposure is associated with differences in incident malignancy risk among adults with psoriasis. Patients aged 18 years or older with a psoriasis diagnosis (ICD-10-CM code L40.x) and documented exposure to an IL-17, IL-23, or IL-12/23 inhibitor were eligible. Patients with a prior malignancy diagnosis were excluded to reduce prevalence bias. To ensure that malignancies were incident, we included only those diagnosed at least 1 day after initiation of an IL inhibitor.
The comparison cohort consisted of psoriasis patients without IL inhibitor exposure during their observation period. We used 1:1 propensity score matching based on age, sex, race, and ethnicity, applying a caliper of 0.1 to balance baseline characteristics and minimize demographic confounding. The index date for unexposed patients was randomly assigned within their observation period to align follow-up timing with exposed patients. Outcomes were identified by ICD-10-CM codes grouped by skin, hematologic, and solid-organ malignancies. Odds ratios (ORs) with 95% confidence intervals (CIs) were calculated, with statistical significance set at P<.05. Odds ratios were selected over hazard ratios due to variability in precise follow-up time capture and the primary analytic goal of comparing proportional odds within matched follow-up windows.
Propensity score matching was employed because it is a well-established technique in pharmacoepidemiology to mimic some of the balance achieved in randomized trials. By equating treatment and control groups on measured confounders, matching helps isolate the treatment effect, particularly important in nonrandomized datasets in which prescribing decisions may be influenced by baseline characteristics. Grouping cancers into clinically relevant categories allowed us to assess patterns of association, as some cancer types (eg, melanoma, lymphomas) may have pathophysiologic links to inflammatory pathways targeted by IL inhibitors.
The final cohort included 133,352 patients, with 66,676 in each group. The mean (SD) age was 49.3 (16.0) years, and demographic variables were well balanced after matching. The mean follow-up was approximately 3.8 years. Interleukin 17 inhibitors were the most frequently prescribed, followed by IL-23 inhibitors and ustekinumab. Baseline comorbidities such as cardiovascular disease, diabetes, and obesity were comparable between groups, reducing the likelihood of confounding from these factors.
Interleukin inhibitor exposure was associated with significantly reduced odds of several malignancies (eTable). Among skin cancers, melanoma risk was reduced by 36% (OR, 0.641; 95% CI, 0.534-0.77; P<.0001), basal cell carcinoma by 43% (OR, 0.565; 95% CI, 0.48-0.665; P<.0001), and squamous cell carcinoma by 18% (OR, 0.821; 95% CI, 0.676-0.996; P=.0452). Hematologic malignancies showed similar reductions, with non-Hodgkin lymphoma odds reduced by 35% (OR, 0.646; 95% CI, 0.512-0.815; P=.0002) and Hodgkin lymphoma by 50% (OR, 0.5; 95% CI, 0.292-0.855; P=.0098).
Protective associations also were observed for several solid tumors: lung (OR, 0.528; 95% CI, 0.452-0.617; P<.0001), liver (OR, 0.528; 95% CI, 0.399-0.698; P<.0001), pancreatic (OR, 0.65; 95% CI, 0.49-0.861; P=.0025), breast (OR, 0.663; 95% CI, 0.582-0.754; P<.0001), prostate (OR, 0.543; 95% CI, 0.468-0.629; P<.0001), colorectal (OR, 0.592; 95% CI, 0.414-0.846; P=.0036), colon (OR, 0.466; 95% CI, 0.375-0.579; P<.0001), and oropharyngeal (OR, 0.55; 95% CI, 0.327-0.925; P=.0222) cancers. Cervical cancer (OR, 0.604; 95% CI, 0.381-0.958; P=.0304) and anal cancer (OR, 0.4; 95% CI, 0.224-0.714; P=.0013) also showed significant reductions. Vaginal, vulvar, and penile cancers demonstrated no significant differences, likely due to their low incidence and limited statistical power.
The biological plausibility of these findings is supported by preclinical studies implicating IL-17 and IL-23 in tumor-promoting inflammation.11 These cytokines can recruit myeloid-derived suppressor cells, promote angiogenesis, and facilitate tumor-immune evasion. Inhibition may shift the immune microenvironment toward enhanced tumor surveillance, reduce protumorigenic cytokine signaling, and normalize regulatory T-cell function.11 These mechanisms could explain observed reductions in melanoma, lymphomas, and certain solid tumors.
Our results are consistent with several large registry studies showing no increased cancer incidence in IL inhibitor users and extend prior findings by demonstrating significant reductions in multiple cancer types.12 The melanoma reduction contrasts with the findings in earlier biologic safety studies, possibly due to our larger sample size, broader geographic representation, and inclusion of multiple IL inhibitor classes.13 Similar reductions have not been consistently observed with tumor necrosis factor α inhibitors, which have different immunologic targets and a more complex malignancy safety history.14
Limitations of our study include the retrospective design, potential misclassification of cancer diagnoses, and lack of data on unmeasured confounders such as sun exposure, smoking, alcohol use, and family cancer history. Surveillance bias is possible, though it would likely bias toward higher, not lower, cancer detection in biologic users. Our mean follow-up period of 3.8 years may not be sufficient for cancers with long latency periods.
If replicated, our findings could have meaningful public health implications. Reassurance regarding malignancy safety may increase patient acceptance and physician confidence in prescribing IL inhibitors, particularly for patients requiring long-term therapy. From a payer perspective, the potential for reduced cancer incidence could translate into substantial cost savings over time, offsetting the high up-front cost of biologics. Additionally, these results may be relevant to other IL inhibitor indications, including psoriatic arthritis, ankylosing spondylitis, and inflammatory bowel disease, in which similar pathophysiologic mechanisms may be at play.
In conclusion, this large matched-cohort study found that IL inhibitor therapy in psoriasis was associated with significantly reduced odds of multiple malignancies, including melanoma, lymphomas, and several solid tumors. These findings contribute to the growing body of real-world evidence supporting the long-term safety of IL inhibitors and underscore the need for continued pharmacovigilance and mechanistic research.
- Armstrong AW, Mehta MD, Schupp CW, et al. Psoriasis prevalence in adults in the United States. JAMA Dermatol. 2021;157:940-946. doi:10.1001/jamadermatol.2021.2007
- Deng Z, Wang S, Wu C, et al. IL-17 inhibitor-associated inflammatory bowel disease: a study based on literature and database analysis. Front Pharmacol. 2023;14:1124628. doi:10.3389/fphar.2023.1124628
- Al Sawah S, Foster SA, Goldblum OM, et al. Healthcare costs in psoriasis and psoriasis sub-groups over time following psoriasis diagnosis. J Med Econ. 2017;20:982-990. doi:10.1080/13696998.2017.1345749
- Korman NJ. Management of psoriasis as a systemic disease: what is the evidence? Br J Dermatol. 2020;182:840-848. doi:10.1111/bjd.18245
- Damiani G, Bragazzi NL, Karimkhani Aksut C, et al. The global, regional, and national burden of psoriasis: results and insights from the Global Burden of Disease 2019 Study. Front Med (Lausanne). 2021;8:743180. doi:10.3389/fmed.2021.743180
- Metko D, Torres T, Vender R. Viewpoint about biologic agents for psoriasis: are they immunosuppressants or immunomodulators? J Int Med Res. 2023;51:3000605231175547. doi:10.1177/03000605231175547
- Tsai YC, Tsai TF. Anti-interleukin and interleukin therapies for psoriasis: current evidence and clinical usefulness. Ther Adv Musculoskelet Dis. 2017;9:277-294. doi:10.1177/1759720X17735756
- Durnian JM, Stewart RM, Tatham R, et al. Cyclosporin-A associated malignancy. Clin Ophthalmol. 2007;1:421-430.
- DeWitt EM, Lin L, Glick HA, et al. Pattern and predictors of the initiation of biologic agents for the treatment of rheumatoid arthritis in the United States: an analysis using a large observational data bank. Clin Ther. 2009;31:1871-1858. doi:10.1016/j.clinthera.2009.08.020
- Vangilbergen M, Stockman A, Van De Velde A, et al. The role of interleukin-17 and interleukin-23 inhibitors in the development, progression, and recurrence of cancer: a systematic review. JAAD Int. 2024;17:71-79. doi:10.1016/j.jdin.2024.06.006
- Navarro-Compán V, Puig L, Vidal S, et al. The paradigm of IL-23-independent production of IL-17F and IL-17A and their role in chronic inflammatory diseases. Front Immunol. 2023;14:1191782. doi:10.3389/fimmu.2023.1191782
- Bencardino S, Bernardi F, Allocca M, et al. Advanced therapies for inflammatory bowel disease and risk of skin cancer: what’s new? Cancers (Basel). 2025;17:1710. doi:10.3390/cancers17101710
- Esse S, Mason KJ, Green AC, et al. Melanoma risk in patients treated with biologic therapy for common inflammatory diseases: a systematic review and meta-analysis. JAMA Dermatol. 2020;156:787-794. doi:10.1001/jamadermatol.2020.1300
- Solomon DH, Mercer E, Kavanaugh A. Observational studies on the risk of cancer associated with tumor necrosis factor inhibitors in rheumatoid arthritis: a review of their methodologies and results. Arthritis Rheum. 2012;64:21-32. doi:10.1002/art.30653
Malignancy Risk Among Psoriasis Patients Treated With Interleukin Inhibitors: A Retrospective Matched-Cohort Study
Malignancy Risk Among Psoriasis Patients Treated With Interleukin Inhibitors: A Retrospective Matched-Cohort Study
Practice Points
- Interleukin (IL) inhibitor therapy for psoriasis was associated with reduced odds of multiple malignancies in a large matched-cohort analysis.
- Potential mechanisms for reduced cancer risk include inhibition of tumor-promoting inflammation and restoration of antitumor immune surveillance, although further mechanistic and longitudinal studies are needed.
- These findings provide real-world evidence supporting the long-term malignancy safety of IL inhibitors, which may reassure clinicians and patients considering these agents for chronic disease management.

A Simple Alternative for Intralesional Cryosurgery of Keloids and Hypertrophic Scars Using a Disposable Infusion Set
A Simple Alternative for Intralesional Cryosurgery of Keloids and Hypertrophic Scars Using a Disposable Infusion Set
Practice Gap
Intralesional cryosurgery is a highly effective treatment for dermatologic conditions, notably keloids and hypertrophic scars.1 Conventional methods typically use specialized double-lumen intralesional probes or Luer lock adapters connected to hypodermic or lumbar puncture needles, allowing cryogen to flow internally to cool the probe or needle and treat the lesion via conduction.2 However, specialized intralesional probes are expensive and often are difficult to obtain. Furthermore, Luer lock adapters with needles directly attached to the handle unit can be ergonomically challenging, as the procedure requires simultaneous maintenance of a perpendicular handheld position, precise needle passage through the exact center of the lesion, and protection of the surrounding perilesional healthy skin from cold injury. Consequently, these limitations restrict widespread adoption, necessitating simpler, more accessible, and cost-effective alternatives. Herein, we present a novel, practical, and economical cryogen delivery method that adapts a disposable infusion set to a standard cryospray nozzle.
The Technique
This technique involves detaching the infusion set tubing and securely connecting it to the cryospray nozzle (Figure 1). Brief activation of the cryospray to constrict the nozzle or a small incision in the tubing may be required to ensure a tight fit, which can be secured with medical tape to maintain consistent cryogen flow. Local anesthesia is administered directly into and around the lesion, particularly translesionally for keloids, to avoid unnecessary trauma to the surrounding healthy skin, which could trigger further keloid formation. A needle is inserted through the lesion with the tip extending beyond its distal boundary, ensuring the tip remains outside the lesion during cryogen application to prevent cryoinsufflation. If necessary, gentle bending of the needle helps ensure optimal cryogen distribution within the lesion (Figures 2A and 2B). However, this may slightly reduce flow and extend freezing duration; therefore, bending the needle should be performed cautiously and is specifically recommended for effectively treating lesions on curved anatomic sites (eg, the auricle of the ear) to optimize freezing and protect surrounding tissues.
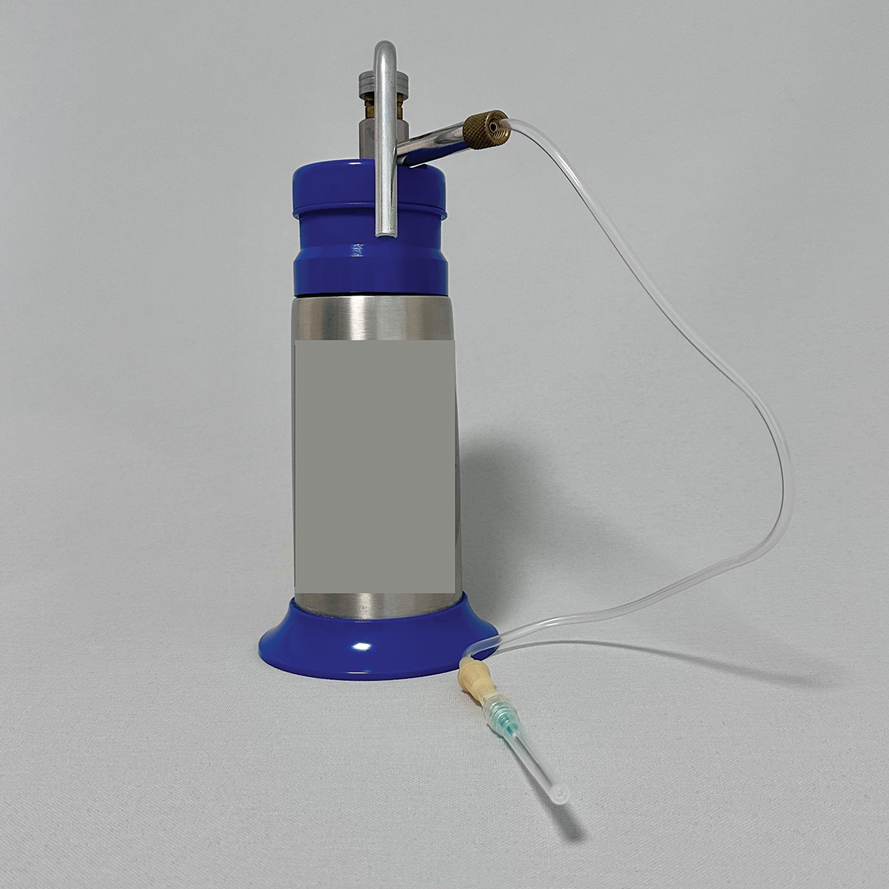
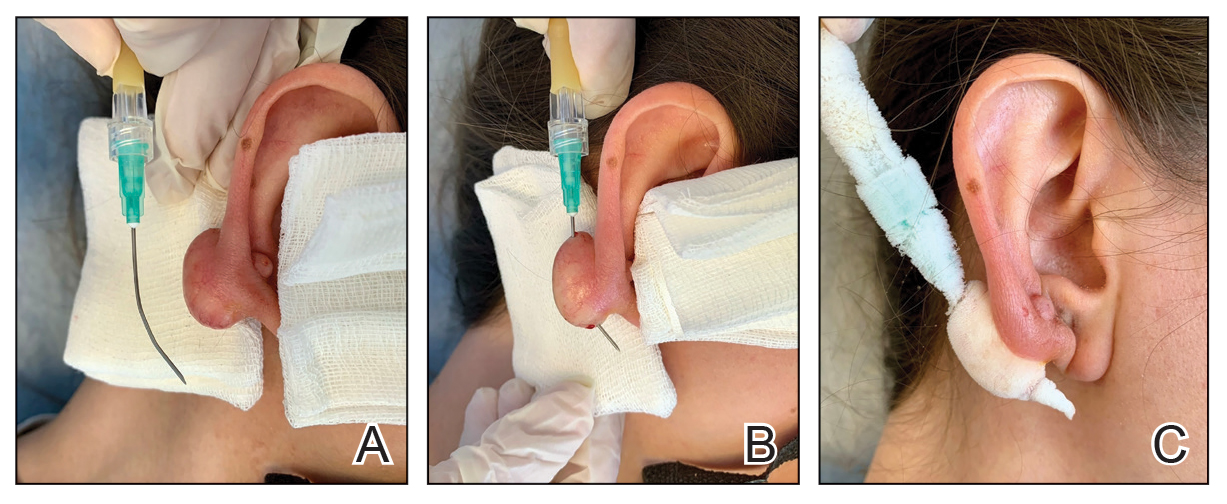
During initial cryogen release, covering the needle tip with gauze prevents aerosolization of biological debris, while placing a wooden tongue depressor between the needle tip and the patient’s skin prevents inadvertent cold injury. After cryogen flow is initiated, the lesion begins to freeze at both the needle entry and exit points, forming what is referred to as ice balls. Over time, typically within several seconds to a few minutes depending on lesion size and tissue characteristics, these ice balls merge centrally, forming a single ice ball encompassing the entire lesion (Figure 2C). Cryogen flow should be maintained during a single application until the unified ice ball appearance is achieved, confirming effective cooling.
Practice Implications
Studies have consistently shown that intralesional cryosurgery is associated with a reduction in the size and symptoms of hypertrophic scars and keloids.1,2 Multimodal treatment approaches, including intralesional methods, are especially valued for their targeted efficacy and minimal adverse effects. Our simplified method offers practical economic advantages, making it highly suitable for broad adoption across diverse clinical settings, particularly those that are resource limited. Clinicians can safely and effectively utilize this technique without specialized or costly equipment, considerably enhancing clinical efficiency and accessibility. The straightforwardness of this method also facilitates the training of medical personnel, enabling rapid integration into clinical practice and the flexibility to treat various lesion types and sizes effectively.
- McGoldrick RB, Theodorakopoulou E, Azzopardi E, et al. Lasers and ancillary treatments for scar management part 2: keloid, hypertrophic, pigmented and acne scars. Scars Burn Heal. 2017;3:1-16. doi:10.1177/2059513116689805
- Gupta S, Kumar B. Intralesional cryosurgery using lumbar puncture and/or hypodermic needles for large, bulky, recalcitrant keloids. Int J Dermatol. 2001;40:349-353. doi:10.1046/j.1365-4362.2001.01117.x
Practice Gap
Intralesional cryosurgery is a highly effective treatment for dermatologic conditions, notably keloids and hypertrophic scars.1 Conventional methods typically use specialized double-lumen intralesional probes or Luer lock adapters connected to hypodermic or lumbar puncture needles, allowing cryogen to flow internally to cool the probe or needle and treat the lesion via conduction.2 However, specialized intralesional probes are expensive and often are difficult to obtain. Furthermore, Luer lock adapters with needles directly attached to the handle unit can be ergonomically challenging, as the procedure requires simultaneous maintenance of a perpendicular handheld position, precise needle passage through the exact center of the lesion, and protection of the surrounding perilesional healthy skin from cold injury. Consequently, these limitations restrict widespread adoption, necessitating simpler, more accessible, and cost-effective alternatives. Herein, we present a novel, practical, and economical cryogen delivery method that adapts a disposable infusion set to a standard cryospray nozzle.
The Technique
This technique involves detaching the infusion set tubing and securely connecting it to the cryospray nozzle (Figure 1). Brief activation of the cryospray to constrict the nozzle or a small incision in the tubing may be required to ensure a tight fit, which can be secured with medical tape to maintain consistent cryogen flow. Local anesthesia is administered directly into and around the lesion, particularly translesionally for keloids, to avoid unnecessary trauma to the surrounding healthy skin, which could trigger further keloid formation. A needle is inserted through the lesion with the tip extending beyond its distal boundary, ensuring the tip remains outside the lesion during cryogen application to prevent cryoinsufflation. If necessary, gentle bending of the needle helps ensure optimal cryogen distribution within the lesion (Figures 2A and 2B). However, this may slightly reduce flow and extend freezing duration; therefore, bending the needle should be performed cautiously and is specifically recommended for effectively treating lesions on curved anatomic sites (eg, the auricle of the ear) to optimize freezing and protect surrounding tissues.
During initial cryogen release, covering the needle tip with gauze prevents aerosolization of biological debris, while placing a wooden tongue depressor between the needle tip and the patient’s skin prevents inadvertent cold injury. After cryogen flow is initiated, the lesion begins to freeze at both the needle entry and exit points, forming what is referred to as ice balls. Over time, typically within several seconds to a few minutes depending on lesion size and tissue characteristics, these ice balls merge centrally, forming a single ice ball encompassing the entire lesion (Figure 2C). Cryogen flow should be maintained during a single application until the unified ice ball appearance is achieved, confirming effective cooling.
Practice Implications
Studies have consistently shown that intralesional cryosurgery is associated with a reduction in the size and symptoms of hypertrophic scars and keloids.1,2 Multimodal treatment approaches, including intralesional methods, are especially valued for their targeted efficacy and minimal adverse effects. Our simplified method offers practical economic advantages, making it highly suitable for broad adoption across diverse clinical settings, particularly those that are resource limited. Clinicians can safely and effectively utilize this technique without specialized or costly equipment, considerably enhancing clinical efficiency and accessibility. The straightforwardness of this method also facilitates the training of medical personnel, enabling rapid integration into clinical practice and the flexibility to treat various lesion types and sizes effectively.
- McGoldrick RB, Theodorakopoulou E, Azzopardi E, et al. Lasers and ancillary treatments for scar management part 2: keloid, hypertrophic, pigmented and acne scars. Scars Burn Heal. 2017;3:1-16. doi:10.1177/2059513116689805
- Gupta S, Kumar B. Intralesional cryosurgery using lumbar puncture and/or hypodermic needles for large, bulky, recalcitrant keloids. Int J Dermatol. 2001;40:349-353. doi:10.1046/j.1365-4362.2001.01117.x
A Simple Alternative for Intralesional Cryosurgery of Keloids and Hypertrophic Scars Using a Disposable Infusion Set
A Simple Alternative for Intralesional Cryosurgery of Keloids and Hypertrophic Scars Using a Disposable Infusion Set

Thick Yellow Plaques on the Eyelids
Thick Yellow Plaques on the Eyelids
THE DIAGNOSIS: Adult-Onset Asthma With Periocular Xanthogranuloma
In the context of pre-existing sinonasal disease and features consistent with adult-onset asthma, the constellation of clinical findings including linear periorbital yellow-orange plaques, imaging demonstrating extension of xanthogranulomatous lesions into the orbital fat, histopathologic features, and serologic abnormalities including elevated IgG4 levels supported a diagnosis of adult-onset asthma with periocular xanthogranuloma (AAPOX).
Adult-onset xanthogranuloma is a non–Langerhans cell histiocytosis (historically classified as type II) within the group of adult orbital xanthogranulomatous diseases resulting from infiltration and proliferation of histiocytes in the orbital and ocular adnexal structures and eyelids. Adult orbital xanthogranulomatous diseases are classified as 4 distinct conditions: adult-onset xanthogranuloma, AAPOX, Erdheim-Chester disease, and necrobiotic xanthogranuloma (NXG). Erdheim-Chester disease is the most severe among this group and often is fatal due to infiltration of the xanthogranulomas into multiple organ systems and tissues, including the long bones, heart, lungs, and retroperitoneum. Neurologic symptoms such as incoordination can occur. Adult-onset xanthogranuloma manifests as an isolated cutaneous lesion without systemic involvement. This entity often is self-limited and does not require aggressive treatment. Adult-onset asthma with periocular xanthogranuloma affects more males than females.1 Clinically, it manifests as bilateral yellow-orange, thickened, indurated eyelid plaques that can extend to the extraocular muscles or lacrimal glands. As the name suggests, this entity is associated with adult-onset asthma or rhinosinusitis as well as lymphadenopathy and extension into the orbital fat.1
When patients present with periorbital lesions and optic symptoms such as visual disturbances, tearing, and/ or a foreign body sensation in the eyes, a work-up should be performed to rule out infiltration of orbital adnexal structures and other organ systems, as AAPOX can be associated with IgG4-related disease. Histologically, adult xanthogranulomatous diseases are characterized by sheets of foamy histiocytes accompanied by variable numbers of lymphoid aggregates, plasma cells, and Touton giant cells. These infiltrating xanthoma cells appear as a garland or wreathlike nuclei surrounded by foamy cytoplasm. Oil-red O staining of frozen sections confirms the lipid content of the xanthoma cells.2 Immunohistochemically, the foamy histiocytes are strongly positive for CD68, CD163, and factor XIIIa but usually are negative for S100, CD1a and Birbeck granules.3 More distinctively, AAPOX is associated with prominent lymphoid aggregates containing reactive germinal centers.1
Given that AAPOX is a systemic multiorgan disease, local therapies such as surgical debulking or intralesional corticosteroids generally are insufficient to address the underlying pathology and therefore necessitate systemic, often multimodal, treatment within a multidisciplinary framework.1,4 Systemic corticosteroids remain first-line therapy, with steroid-sparing agents (eg, methotrexate, azathioprine, cyclophosphamide) used in refractory cases or to reduce steroid dependence.4,5 Rituximab has demonstrated efficacy in AAPOX, further highlighting the association between AAPOX and IgG4-related disease.5 Inebilizumab, a B-cell–depleting monoclonal antibody targeting CD19 and approved for the treatment of IgG4- related disease, represents a theoretically promising therapeutic option; however, additional studies are needed to establish its efficacy and safety in AAPOX.5
Necrobiotic xanthogranuloma is another xanthogranulomatous disorder that manifests as yellow-orange papules or nodules that gradually form infiltrative plaques. Scarring and ulceration can occur in 40% to 50% of patients.6 The most common site of involvement is the periorbital area, affecting 80% of cases, often resulting in ophthalmologic complications.6 Necrobiotic xanthogranuloma lesions also can involve the trunk, arms, and legs. Extracutaneous sites include the lungs, myocardium, larynx, pharynx, skeletal muscles, kidneys, ovaries, and intestines. The prognosis of NXG is poor due to associated hematologic malignancies such as multiple myeloma and lymphoma. About 80% of patients have a serum monoclonal gammopathy.6 Histologically, NXG shows features overlapping with other xanthogranulomatous disorders, such as foamy histiocytes, multinucleated giant cells, Touton giant cells, and nodular lymphocytic aggregates6,7; however, broad zones of necrobiosis are a distinct histologic finding in NXG that helps differentiate it from other xanthogranulomatous disorders (Figure 1).6
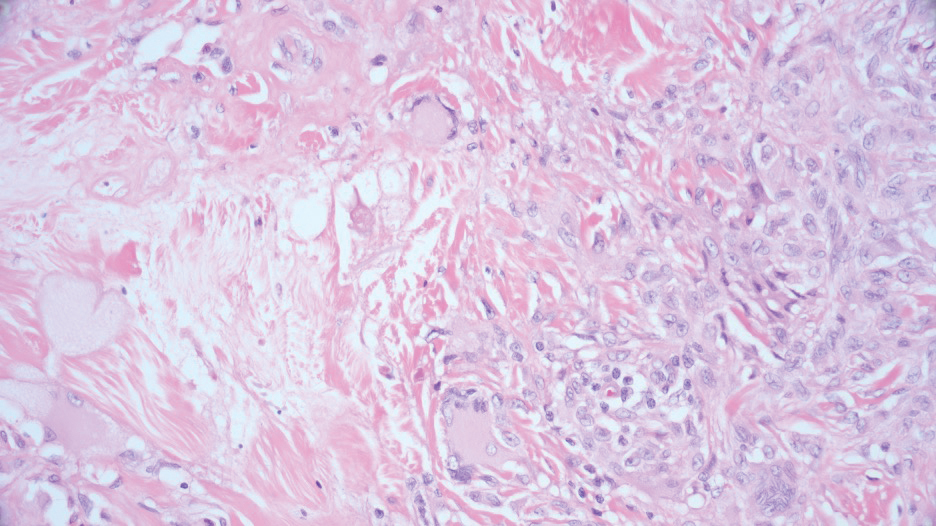
Xanthelasma manifests as yellow plaques on the medial upper and lower eyelids and lateral canthi resulting from accumulation of cholesterol-rich material in the skin, soft tissue, and sometimes the tendons. Fifty percent of patients have a primary or secondary lipid disorder such as familial dyslipidemia, thyroid disease, diabetes mellitus, or primary biliary cholangitis.8 Histologically, xanthelasmas demonstrate lipid-laden foamy histiocytes in the superficial dermis (Figure 2).8 Despite some clinical overlap in our case, the depth of orbital involvement and supportive systemic and histopathologic findings (including Touton giant cells) supported the diagnosis of AAPOX rather than xanthelasma.
Juvenile xanthogranuloma manifests as solitary to multiple firm, yellow-orange papules or nodules on the face, neck, and upper torso. The lesions develop in early childhood, with 75% of lesions appearing in the first year of life, but rarely it may develop in adulthood.9 The most common extracutaneous manifestation involves ocular structures, most frequently the iris, followed by the lungs. Cutaneous lesions usually are asymptomatic and involute over the span of a few years. Ocular lesions can result in blindness, and juvenile xanthogranuloma also has been associated with neurofibromatosis type 1 and juvenile chronic myelogenous leukemia.9 The histopathology of juvenile xanthogranuloma often will show a dense histiocytic infiltrate in the dermis with blunting of the overlying rete ridges admixed with lymphocytes, plasma cells, and eosinophils. In the more mature phase, foam cells, foreign body giant cells, and Touton giant cells predominate. Touton giant cells have a garlandlike appearance (Figure 3).9
Reticulohistiocytoma (or solitary epithelioid histiocytoma) and multicentric reticulohistiocytosis are rare histiocytic proliferations. Multicentric reticulohistiocytosis refers to a systemic disease with arthropathy and multiple cutaneous histiocytic lesions located on acral sites and the face. Solitary reticulohistiocytoma manifests as papules or nodules found in many body locations, such as the trunk, arms, and legs. The lesions are uncommon on the face, which almost always is involved in multicentric reticulohistiocytosis. Solitary reticulohistiocytomas tend not to recur once excised and do not demonstrate systemic involvement. Histologically, the lesions demonstrate large eosinophilic epithelioid histiocytes with abundant glassy cytoplasm (Figure 4). Some of the epithelioid histiocytes are multinucleated, and immunophenotyping will show positivity for lysozyme, CD68, and CD163.10
- Kerstetter J, Wang J. Adult orbital xanthogranulomatous disease: a review with emphasis on etiology, systemic associations, diagnostic tools, and treatment. Dermatol Clin. 2015;33:457-463. doi:10.1016 /j.det.2015.03.010
- Mandic` JJ, Bakula M, Šklebar LK, et al. Histiocytosis and adult-onset orbital xanthogranuloma in 2023: a review of the literature and mini case series. Int Ophthalmol. 2024;44:301. doi:10.1007/s10792-024-03181-y
- Campochiaro C, Tomelleri A, Cavalli G, et al. Erdheim-Chester disease. Eur J Intern Med. 2015;26:223-229. doi: 10.1016/j.ejim.2015.03.004
- Detiger SE, Hötte GJ, Verdijk RM, et al. Adult orbital xanthogranuloma: long-term follow-up of treated cases. Eye (Lond). 2023;37:2475-2481. doi: 10.1038/s41433-022-02357-z
- Stone JH, Khosroshahi A, Zhang W, et al. Inebilizumab for treatment of IgG4-related disease. N Engl J Med. 2025;392:1168-1177. doi:10.1056 /NEJMoa2409712
- Wood AJ, Wagner MVU, Abbott JJ, et al. Necrobiotic xanthogranuloma: a review of 17 cases with emphasis on clinical and pathologic correlation. Arch Dermatol. 2009;145:279–284. doi:10.1001 /archdermatol.2008.583
- Schadt C, Jacobsen E. Necrobiotic xanthogranuloma. In: Connor RF, ed. UpToDate. Wolters Kluwer.
- Al Aboud AM, Shah SS, Blair K, et al. Xanthelasma palpebrarum. StatPearls [Internet]. StatPearls Publishing; 2024. Updated March 1, 2024. Accessed February 10, 2026. https://www.ncbi.nlm .nih.gov/books/NBK531501/
- Collie JS, Harper CD, Fillman EP. Juvenile xanthogranuloma. StatPearls [Internet]. StatPearls Publishing; 2024. Updated August 8, 2023. Accessed February 10, 2026. https://www.ncbi.nlm.nih .gov/books/NBK526103/
- Miettinen M, Fetsch JF. Reticulohistiocytoma (solitary epithelioid histiocytoma): a clinicopathologic and immunohistochemical study of 44 cases. Am J Surg Pathol. 2006;30:521-528. doi:10.1097/00000478 -200604000-00014
THE DIAGNOSIS: Adult-Onset Asthma With Periocular Xanthogranuloma
In the context of pre-existing sinonasal disease and features consistent with adult-onset asthma, the constellation of clinical findings including linear periorbital yellow-orange plaques, imaging demonstrating extension of xanthogranulomatous lesions into the orbital fat, histopathologic features, and serologic abnormalities including elevated IgG4 levels supported a diagnosis of adult-onset asthma with periocular xanthogranuloma (AAPOX).
Adult-onset xanthogranuloma is a non–Langerhans cell histiocytosis (historically classified as type II) within the group of adult orbital xanthogranulomatous diseases resulting from infiltration and proliferation of histiocytes in the orbital and ocular adnexal structures and eyelids. Adult orbital xanthogranulomatous diseases are classified as 4 distinct conditions: adult-onset xanthogranuloma, AAPOX, Erdheim-Chester disease, and necrobiotic xanthogranuloma (NXG). Erdheim-Chester disease is the most severe among this group and often is fatal due to infiltration of the xanthogranulomas into multiple organ systems and tissues, including the long bones, heart, lungs, and retroperitoneum. Neurologic symptoms such as incoordination can occur. Adult-onset xanthogranuloma manifests as an isolated cutaneous lesion without systemic involvement. This entity often is self-limited and does not require aggressive treatment. Adult-onset asthma with periocular xanthogranuloma affects more males than females.1 Clinically, it manifests as bilateral yellow-orange, thickened, indurated eyelid plaques that can extend to the extraocular muscles or lacrimal glands. As the name suggests, this entity is associated with adult-onset asthma or rhinosinusitis as well as lymphadenopathy and extension into the orbital fat.1
When patients present with periorbital lesions and optic symptoms such as visual disturbances, tearing, and/ or a foreign body sensation in the eyes, a work-up should be performed to rule out infiltration of orbital adnexal structures and other organ systems, as AAPOX can be associated with IgG4-related disease. Histologically, adult xanthogranulomatous diseases are characterized by sheets of foamy histiocytes accompanied by variable numbers of lymphoid aggregates, plasma cells, and Touton giant cells. These infiltrating xanthoma cells appear as a garland or wreathlike nuclei surrounded by foamy cytoplasm. Oil-red O staining of frozen sections confirms the lipid content of the xanthoma cells.2 Immunohistochemically, the foamy histiocytes are strongly positive for CD68, CD163, and factor XIIIa but usually are negative for S100, CD1a and Birbeck granules.3 More distinctively, AAPOX is associated with prominent lymphoid aggregates containing reactive germinal centers.1
Given that AAPOX is a systemic multiorgan disease, local therapies such as surgical debulking or intralesional corticosteroids generally are insufficient to address the underlying pathology and therefore necessitate systemic, often multimodal, treatment within a multidisciplinary framework.1,4 Systemic corticosteroids remain first-line therapy, with steroid-sparing agents (eg, methotrexate, azathioprine, cyclophosphamide) used in refractory cases or to reduce steroid dependence.4,5 Rituximab has demonstrated efficacy in AAPOX, further highlighting the association between AAPOX and IgG4-related disease.5 Inebilizumab, a B-cell–depleting monoclonal antibody targeting CD19 and approved for the treatment of IgG4- related disease, represents a theoretically promising therapeutic option; however, additional studies are needed to establish its efficacy and safety in AAPOX.5
Necrobiotic xanthogranuloma is another xanthogranulomatous disorder that manifests as yellow-orange papules or nodules that gradually form infiltrative plaques. Scarring and ulceration can occur in 40% to 50% of patients.6 The most common site of involvement is the periorbital area, affecting 80% of cases, often resulting in ophthalmologic complications.6 Necrobiotic xanthogranuloma lesions also can involve the trunk, arms, and legs. Extracutaneous sites include the lungs, myocardium, larynx, pharynx, skeletal muscles, kidneys, ovaries, and intestines. The prognosis of NXG is poor due to associated hematologic malignancies such as multiple myeloma and lymphoma. About 80% of patients have a serum monoclonal gammopathy.6 Histologically, NXG shows features overlapping with other xanthogranulomatous disorders, such as foamy histiocytes, multinucleated giant cells, Touton giant cells, and nodular lymphocytic aggregates6,7; however, broad zones of necrobiosis are a distinct histologic finding in NXG that helps differentiate it from other xanthogranulomatous disorders (Figure 1).6
Xanthelasma manifests as yellow plaques on the medial upper and lower eyelids and lateral canthi resulting from accumulation of cholesterol-rich material in the skin, soft tissue, and sometimes the tendons. Fifty percent of patients have a primary or secondary lipid disorder such as familial dyslipidemia, thyroid disease, diabetes mellitus, or primary biliary cholangitis.8 Histologically, xanthelasmas demonstrate lipid-laden foamy histiocytes in the superficial dermis (Figure 2).8 Despite some clinical overlap in our case, the depth of orbital involvement and supportive systemic and histopathologic findings (including Touton giant cells) supported the diagnosis of AAPOX rather than xanthelasma.
Juvenile xanthogranuloma manifests as solitary to multiple firm, yellow-orange papules or nodules on the face, neck, and upper torso. The lesions develop in early childhood, with 75% of lesions appearing in the first year of life, but rarely it may develop in adulthood.9 The most common extracutaneous manifestation involves ocular structures, most frequently the iris, followed by the lungs. Cutaneous lesions usually are asymptomatic and involute over the span of a few years. Ocular lesions can result in blindness, and juvenile xanthogranuloma also has been associated with neurofibromatosis type 1 and juvenile chronic myelogenous leukemia.9 The histopathology of juvenile xanthogranuloma often will show a dense histiocytic infiltrate in the dermis with blunting of the overlying rete ridges admixed with lymphocytes, plasma cells, and eosinophils. In the more mature phase, foam cells, foreign body giant cells, and Touton giant cells predominate. Touton giant cells have a garlandlike appearance (Figure 3).9
Reticulohistiocytoma (or solitary epithelioid histiocytoma) and multicentric reticulohistiocytosis are rare histiocytic proliferations. Multicentric reticulohistiocytosis refers to a systemic disease with arthropathy and multiple cutaneous histiocytic lesions located on acral sites and the face. Solitary reticulohistiocytoma manifests as papules or nodules found in many body locations, such as the trunk, arms, and legs. The lesions are uncommon on the face, which almost always is involved in multicentric reticulohistiocytosis. Solitary reticulohistiocytomas tend not to recur once excised and do not demonstrate systemic involvement. Histologically, the lesions demonstrate large eosinophilic epithelioid histiocytes with abundant glassy cytoplasm (Figure 4). Some of the epithelioid histiocytes are multinucleated, and immunophenotyping will show positivity for lysozyme, CD68, and CD163.10
- Kerstetter J, Wang J. Adult orbital xanthogranulomatous disease: a review with emphasis on etiology, systemic associations, diagnostic tools, and treatment. Dermatol Clin. 2015;33:457-463. doi:10.1016 /j.det.2015.03.010
- Mandic` JJ, Bakula M, Šklebar LK, et al. Histiocytosis and adult-onset orbital xanthogranuloma in 2023: a review of the literature and mini case series. Int Ophthalmol. 2024;44:301. doi:10.1007/s10792-024-03181-y
- Campochiaro C, Tomelleri A, Cavalli G, et al. Erdheim-Chester disease. Eur J Intern Med. 2015;26:223-229. doi: 10.1016/j.ejim.2015.03.004
- Detiger SE, Hötte GJ, Verdijk RM, et al. Adult orbital xanthogranuloma: long-term follow-up of treated cases. Eye (Lond). 2023;37:2475-2481. doi: 10.1038/s41433-022-02357-z
- Stone JH, Khosroshahi A, Zhang W, et al. Inebilizumab for treatment of IgG4-related disease. N Engl J Med. 2025;392:1168-1177. doi:10.1056 /NEJMoa2409712
- Wood AJ, Wagner MVU, Abbott JJ, et al. Necrobiotic xanthogranuloma: a review of 17 cases with emphasis on clinical and pathologic correlation. Arch Dermatol. 2009;145:279–284. doi:10.1001 /archdermatol.2008.583
- Schadt C, Jacobsen E. Necrobiotic xanthogranuloma. In: Connor RF, ed. UpToDate. Wolters Kluwer.
- Al Aboud AM, Shah SS, Blair K, et al. Xanthelasma palpebrarum. StatPearls [Internet]. StatPearls Publishing; 2024. Updated March 1, 2024. Accessed February 10, 2026. https://www.ncbi.nlm .nih.gov/books/NBK531501/
- Collie JS, Harper CD, Fillman EP. Juvenile xanthogranuloma. StatPearls [Internet]. StatPearls Publishing; 2024. Updated August 8, 2023. Accessed February 10, 2026. https://www.ncbi.nlm.nih .gov/books/NBK526103/
- Miettinen M, Fetsch JF. Reticulohistiocytoma (solitary epithelioid histiocytoma): a clinicopathologic and immunohistochemical study of 44 cases. Am J Surg Pathol. 2006;30:521-528. doi:10.1097/00000478 -200604000-00014
Thick Yellow Plaques on the Eyelids
Thick Yellow Plaques on the Eyelids
A 54-year-old man presented to the dermatology department for evaluation of enlarging lesions on the eyelids of 18 months’ duration causing tearing, dryness, and heaviness. The patient’s medical history was positive for hyperlipidemia, chronic rhinosinusitis, and mild asthma diagnosed in adulthood. A review of systems was negative for bone pain, polyuria, polydipsia, dysuria, hematuria, decreased coordination, chest pain, palpitations, abdominal pain, easy bruising, and jaundice. Laboratory testing revealed elevated IgG4 levels and a slight increase in gamma globulins on serum protein electrophoresis, with no evidence of paraproteinemia. Liver and kidney function test results were within normal limits. Magnetic resonance imaging of the orbits revealed bilateral superolateral intraorbital masses within the extraconal fat that were displacing the superior and lateral rectus muscles. No intraconal masses were identified. Due to bilateral eyelid ptosis, the patient underwent debulking by oculoplastic surgery, and the tissue was submitted for histologic examination.